Races in Darien, Illinois (IL) Detailed Stats
Data:
Races - White alone (%)
Races - White alone (% change since 2000)
Races - Black alone (%)
Races - Black alone (% change since 2000)
Races - American Indian alone (%)
Races - American Indian alone (% change since 2000)
Races - Asian alone (%)
Races - Asian alone (% change since 2000)
Races - Hispanic (%)
Races - Hispanic (% change since 2000)
Races - Native Hawaiian and Other Pacific Islander alone (%)
Races - Native Hawaiian and Other Pacific Islander alone (% change since 2000)
Races - Two or more races(%)
Races - Two or more races(% change since 2000)
Races - Other race alone (%)
Races - Other race alone (% change since 2000)
Racial diversity
Place of birth - Born in state of residence (%)
Place of birth - Born in state of residence (%) - White
Place of birth - Born in state of residence (%) - Black or African American
Place of birth - Born in state of residence (%) - Asian
Place of birth - Born in state of residence (%) - Hispanic or Latino
Place of birth - Born in state of residence (%) - American Indian and Alaska Native
Place of birth - Born in state of residence (%) - Multirace
Place of birth - Born in state of residence (%) - Other Race
Place of birth - Born in other state (%)
Place of birth - Born in other state (%) - White
Place of birth - Born in other state (%) - Black or African American
Place of birth - Born in other state (%) - Asian
Place of birth - Born in other state (%) - Hispanic or Latino
Place of birth - Born in other state (%) - American Indian and Alaska Native
Place of birth - Born in other state (%) - Multirace
Place of birth - Born in other state (%) - Other Race
Place of birth - Native, outside of US (%)
Place of birth - Native, outside of US (%) - White
Place of birth - Native, outside of US (%) - Black or African American
Place of birth - Native, outside of US (%) - Asian
Place of birth - Native, outside of US (%) - Hispanic or Latino
Place of birth - Native, outside of US (%) - American Indian and Alaska Native
Place of birth - Native, outside of US (%) - Multirace
Place of birth - Native, outside of US (%) - Other Race
Place of birth - Foreign born (%)
Place of birth - Foreign born (%) - White
Place of birth - Foreign born (%) - Black or African American
Place of birth - Foreign born (%) - Asian
Place of birth - Foreign born (%) - Hispanic or Latino
Place of birth - Foreign born (%) - American Indian and Alaska Native
Place of birth - Foreign born (%) - Multirace
Place of birth - Foreign born (%) - Other Race
Residents speaking English at home (%)
Residents speaking English at home - Born in the United States (%)
Residents speaking English at home - Native, born elsewhere (%)
Residents speaking English at home - Foreign born (%)
Residents speaking Spanish at home (%)
Residents speaking Spanish at home - Born in the United States (%)
Residents speaking Spanish at home - Native, born elsewhere (%)
Residents speaking Spanish at home - Foreign born (%)
Residents speaking other language at home (%)
Residents speaking other language at home - Born in the United States (%)
Residents speaking other language at home - Native, born elsewhere (%)
Residents speaking other language at home - Foreign born (%)
Marital status - Never married (%)
Marital status - Now married (%)
Marital status - Separated (%)
Marital status - Widowed (%)
Marital status - Divorced (%)
Ancestries Reported - Arab (%)
Ancestries Reported - Czech (%)
Ancestries Reported - Danish (%)
Ancestries Reported - Dutch (%)
Ancestries Reported - English (%)
Ancestries Reported - French (%)
Ancestries Reported - French Canadian (%)
Ancestries Reported - German (%)
Ancestries Reported - Greek (%)
Ancestries Reported - Hungarian (%)
Ancestries Reported - Irish (%)
Ancestries Reported - Italian (%)
Ancestries Reported - Lithuanian (%)
Ancestries Reported - Norwegian (%)
Ancestries Reported - Polish (%)
Ancestries Reported - Portuguese (%)
Ancestries Reported - Russian (%)
Ancestries Reported - Scotch-Irish (%)
Ancestries Reported - Scottish (%)
Ancestries Reported - Slovak (%)
Ancestries Reported - Subsaharan African (%)
Ancestries Reported - Swedish (%)
Ancestries Reported - Swiss (%)
Ancestries Reported - Ukrainian (%)
Ancestries Reported - United States (%)
Ancestries Reported - Welsh (%)
Ancestries Reported - West Indian (%)
Ancestries Reported - Other (%)
Geographical mobility - Same house 1 year ago (%)
Geographical mobility - Same house 1 year ago (%) - White
Geographical mobility - Same house 1 year ago (%) - Black or African American
Geographical mobility - Same house 1 year ago (%) - Asian
Geographical mobility - Same house 1 year ago (%) - Hispanic or Latino
Geographical mobility - Same house 1 year ago (%) - American Indian and Alaska Native
Geographical mobility - Same house 1 year ago (%) - Multirace
Geographical mobility - Same house 1 year ago (%) - Other Race
Geographical mobility - Moved within same county (%)
Geographical mobility - Moved within same county (%) - White
Geographical mobility - Moved within same county (%) - Black or African American
Geographical mobility - Moved within same county (%) - Asian
Geographical mobility - Moved within same county (%) - Hispanic or Latino
Geographical mobility - Moved within same county (%) - American Indian and Alaska Native
Geographical mobility - Moved within same county (%) - Multirace
Geographical mobility - Moved within same county (%) - Other Race
Geographical mobility - Moved from different county within same state (%)
Geographical mobility - Moved from different county within same state (%) - White
Geographical mobility - Moved from different county within same state (%) - Black or African American
Geographical mobility - Moved from different county within same state (%) - Asian
Geographical mobility - Moved from different county within same state (%) - Hispanic or Latino
Geographical mobility - Moved from different county within same state (%) - American Indian and Alaska Native
Geographical mobility - Moved from different county within same state (%) - Multirace
Geographical mobility - Moved from different county within same state (%) - Other Race
Geographical mobility - Moved from different state (%)
Geographical mobility - Moved from different state (%) - White
Geographical mobility - Moved from different state (%) - Black or African American
Geographical mobility - Moved from different state (%) - Asian
Geographical mobility - Moved from different state (%) - Hispanic or Latino
Geographical mobility - Moved from different state (%) - American Indian and Alaska Native
Geographical mobility - Moved from different state (%) - Multirace
Geographical mobility - Moved from different state (%) - Other Race
Geographical mobility - Moved from abroad (%)
Geographical mobility - Moved from abroad (%) - White
Geographical mobility - Moved from abroad (%) - Black or African American
Geographical mobility - Moved from abroad (%) - Asian
Geographical mobility - Moved from abroad (%) - Hispanic or Latino
Geographical mobility - Moved from abroad (%) - American Indian and Alaska Native
Geographical mobility - Moved from abroad (%) - Multirace
Geographical mobility - Moved from abroad (%) - Other Race
Place of birth for the foreign-born population - Ireland (%)
Place of birth for the foreign-born population - Denmark (%)
Place of birth for the foreign-born population - Norway (%)
Place of birth for the foreign-born population - Sweden (%)
Place of birth for the foreign-born population - United Kingdom (%)
Place of birth for the foreign-born population - England (%)
Place of birth for the foreign-born population - Scotland (%)
Place of birth for the foreign-born population - Other Northern Europe (%)
Place of birth for the foreign-born population - Austria (%)
Place of birth for the foreign-born population - Belgium (%)
Place of birth for the foreign-born population - France (%)
Place of birth for the foreign-born population - Germany (%)
Place of birth for the foreign-born population - Netherlands (%)
Place of birth for the foreign-born population - Switzerland (%)
Place of birth for the foreign-born population - Other Western Europe (%)
Place of birth for the foreign-born population - Greece (%)
Place of birth for the foreign-born population - Italy (%)
Place of birth for the foreign-born population - Portugal (%)
Place of birth for the foreign-born population - Spain (%)
Place of birth for the foreign-born population - Other Southern Europe (%)
Place of birth for the foreign-born population - Albania (%)
Place of birth for the foreign-born population - Belarus (%)
Place of birth for the foreign-born population - Bosnia and Herzegovina (%)
Place of birth for the foreign-born population - Bulgaria (%)
Place of birth for the foreign-born population - Croatia (%)
Place of birth for the foreign-born population - Czechoslovakia (%)
Place of birth for the foreign-born population - Hungary (%)
Place of birth for the foreign-born population - Latvia (%)
Place of birth for the foreign-born population - Lithuania (%)
Place of birth for the foreign-born population - North Macedonia (Macedonia) (%)
Place of birth for the foreign-born population - Moldova (%)
Place of birth for the foreign-born population - Poland (%)
Place of birth for the foreign-born population - Romania (%)
Place of birth for the foreign-born population - Russia (%)
Place of birth for the foreign-born population - Serbia (%)
Place of birth for the foreign-born population - Ukraine (%)
Place of birth for the foreign-born population - Other Eastern Europe (%)
Place of birth for the foreign-born population - China (%)
Place of birth for the foreign-born population - Hong Kong (%)
Place of birth for the foreign-born population - Taiwan (%)
Place of birth for the foreign-born population - Japan (%)
Place of birth for the foreign-born population - Korea (%)
Place of birth for the foreign-born population - Other Eastern Asia (%)
Place of birth for the foreign-born population - Afghanistan (%)
Place of birth for the foreign-born population - Bangladesh (%)
Place of birth for the foreign-born population - India (%)
Place of birth for the foreign-born population - Iran (%)
Place of birth for the foreign-born population - Kazakhstan (%)
Place of birth for the foreign-born population - Nepal (%)
Place of birth for the foreign-born population - Pakistan (%)
Place of birth for the foreign-born population - Sri Lanka (%)
Place of birth for the foreign-born population - Uzbekistan (%)
Place of birth for the foreign-born population - Other South Central Asia (%)
Place of birth for the foreign-born population - Burma (%)
Place of birth for the foreign-born population - Cambodia (%)
Place of birth for the foreign-born population - Indonesia (%)
Place of birth for the foreign-born population - Laos (%)
Place of birth for the foreign-born population - Malaysia (%)
Place of birth for the foreign-born population - Philippines (%)
Place of birth for the foreign-born population - Singapore (%)
Place of birth for the foreign-born population - Thailand (%)
Place of birth for the foreign-born population - Vietnam (%)
Place of birth for the foreign-born population - Other South Eastern Asia (%)
Place of birth for the foreign-born population - Armenia (%)
Place of birth for the foreign-born population - Iraq (%)
Place of birth for the foreign-born population - Israel (%)
Place of birth for the foreign-born population - Jordan (%)
Place of birth for the foreign-born population - Kuwait (%)
Place of birth for the foreign-born population - Lebanon (%)
Place of birth for the foreign-born population - Saudi Arabia (%)
Place of birth for the foreign-born population - Syria (%)
Place of birth for the foreign-born population - Turkey (%)
Place of birth for the foreign-born population - Yemen (%)
Place of birth for the foreign-born population - Other Western Asia (%)
Place of birth for the foreign-born population - Eritrea (%)
Place of birth for the foreign-born population - Ethiopia (%)
Place of birth for the foreign-born population - Kenya (%)
Place of birth for the foreign-born population - Somalia (%)
Place of birth for the foreign-born population - Uganda (%)
Place of birth for the foreign-born population - Zimbabwe (%)
Place of birth for the foreign-born population - Other Eastern Africa (%)
Place of birth for the foreign-born population - Cameroon (%)
Place of birth for the foreign-born population - Congo (%)
Place of birth for the foreign-born population - Democratic Republic of Congo (Zaire) (%)
Place of birth for the foreign-born population - Other Middle Africa (%)
Place of birth for the foreign-born population - Egypt (%)
Place of birth for the foreign-born population - Morocco (%)
Place of birth for the foreign-born population - Sudan (%)
Place of birth for the foreign-born population - Other Northern Africa (%)
Place of birth for the foreign-born population - South Africa (%)
Place of birth for the foreign-born population - Other Southern Africa (%)
Place of birth for the foreign-born population - Cabo Verde (%)
Place of birth for the foreign-born population - Ghana (%)
Place of birth for the foreign-born population - Liberia (%)
Place of birth for the foreign-born population - Nigeria (%)
Place of birth for the foreign-born population - Senegal (%)
Place of birth for the foreign-born population - Sierra Leone (%)
Place of birth for the foreign-born population - Other Western Africa (%)
Place of birth for the foreign-born population - Australia (%)
Place of birth for the foreign-born population - New Zealand (%)
Place of birth for the foreign-born population - Fiji (%)
Place of birth for the foreign-born population - Micronesia (%)
Place of birth for the foreign-born population - Bahamas (%)
Place of birth for the foreign-born population - Barbados (%)
Place of birth for the foreign-born population - Cuba (%)
Place of birth for the foreign-born population - Dominica (%)
Place of birth for the foreign-born population - Dominican Republic (%)
Place of birth for the foreign-born population - Grenada (%)
Place of birth for the foreign-born population - Haiti (%)
Place of birth for the foreign-born population - Jamaica (%)
Place of birth for the foreign-born population - St. Vincent and the Grenadines (%)
Place of birth for the foreign-born population - Trinidad and Tobago (%)
Place of birth for the foreign-born population - West Indies (%)
Place of birth for the foreign-born population - Other Caribbean (%)
Place of birth for the foreign-born population - Belize (%)
Place of birth for the foreign-born population - Costa Rica (%)
Place of birth for the foreign-born population - El Salvador (%)
Place of birth for the foreign-born population - Guatemala (%)
Place of birth for the foreign-born population - Honduras (%)
Place of birth for the foreign-born population - Mexico (%)
Place of birth for the foreign-born population - Nicaragua (%)
Place of birth for the foreign-born population - Panama (%)
Place of birth for the foreign-born population - Other Central America (%)
Place of birth for the foreign-born population - Argentina (%)
Place of birth for the foreign-born population - Bolivia (%)
Place of birth for the foreign-born population - Brazil (%)
Place of birth for the foreign-born population - Chile (%)
Place of birth for the foreign-born population - Colombia (%)
Place of birth for the foreign-born population - Ecuador (%)
Place of birth for the foreign-born population - Guyana (%)
Place of birth for the foreign-born population - Peru (%)
Place of birth for the foreign-born population - Uruguay (%)
Place of birth for the foreign-born population - Venezuela (%)
Place of birth for the foreign-born population - Other South America (%)
Place of birth for the foreign-born population - Canada (%)
Place of birth for the foreign-born population - Other Northern America (%)
Place of birth for the foreign-born population - Other (%)
Latest news about races in Darien, IL collected exclusively by city-data.com from local newspapers, TV, and radio stations
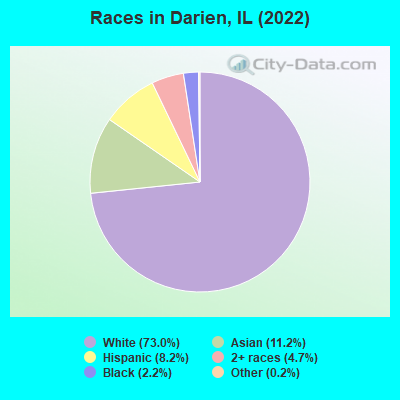
According to 2022 data, the most numerous races in Darien, IL are White alone (15,850 residents), Hispanic (1,790 residents), and Black alone (485 residents). 74.2% of Darien residents speak English at home. 18.5% of Darien, IL residents are foreign-born (9.0% born in Asia, 7.0% born in Europe), which is 24.2% greater than the foreign-born rate of 14.0% across the entire state of Illinois.
Race distribution in Darien
2000 2022
8,424,140 67.8% White alone 1,856,152 14.9% Black alone 1,530,262 12.3% Hispanic 419,916 3.4% Asian alone 153,996 1.2% Two or more races 13,479 0.1% Other race alone 18,232 0.1% American Indian alone 3,116 0.03% Native Hawaiian and Other
7,356,301 58.5% White alone 2,299,726 18.3% Hispanic 1,660,423 13.2% Black alone 747,296 5.9% Asian alone 458,599 3.6% Two or more races 45,386 0.4% Other race alone 10,405 0.08% American Indian alone 3,896 0.03% Native Hawaiian and Other
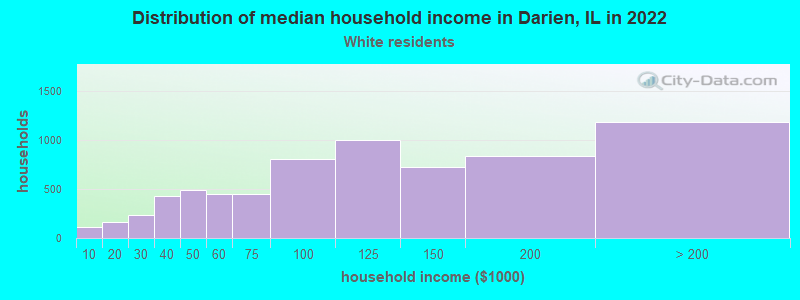
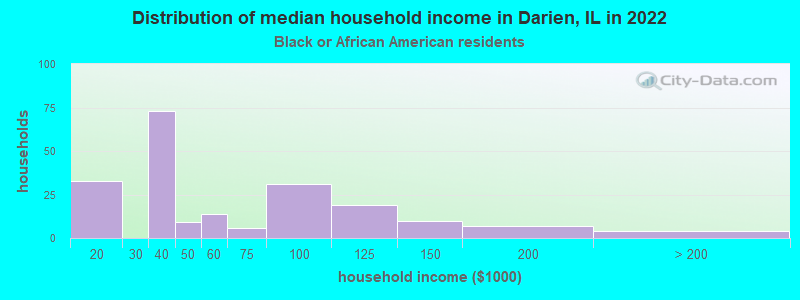
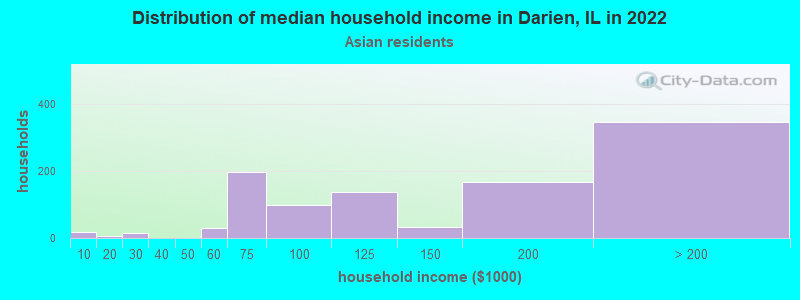
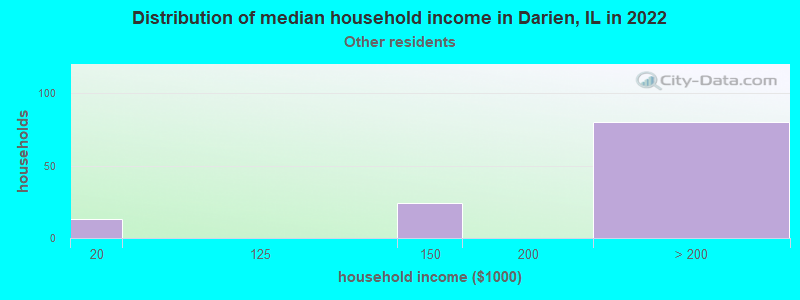
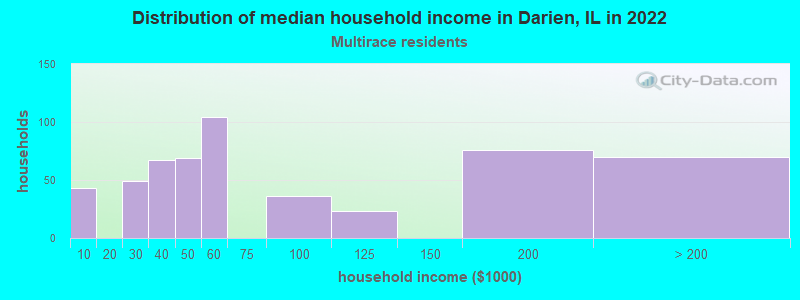
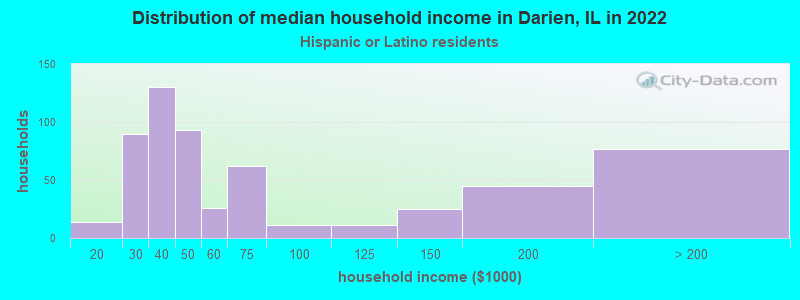
Income and house value in Darien Median household income in 2022 $107,223 White non-Hispanic householders$125,475 Asian householdersover $200,000 Some other race householders$53,150 Two or more races householders$43,778 Hispanic or Latino race householdersMedian 2022 house value $388,752 White Non-Hispanic householders$623,808 Black or African American householders $440,476 Asian householders$498,457 Some other race householders$329,114 Two or more races householders$391,882 Hispanic or Latino householders
Median age by race in Darien
48.2 Median age for White residents47.7 49.1 34.0 Median age for Black or African American residents28.8 56.1 -699,421,964.6 Median age for American Indian / Alaska Native residents-721,943,047.9 -545,253,862.6 56.3 Median age for Asian residents55.8 56.4 -593,236,714.4 Median age for Native Hawaiian / Pacific Islander residents-658,536,584.7 -576,015,108.0 34.3 Median age for Other race residents25.9 36.3 26.8 Median age for Two or more races residents27.7 24.6 47.8 Median age for White alone residents47.5 49.2 29.6 Median age for Hispanic or Latino residents26.9 30.5
Owner/renter occupied households by race in Darien
House owners and renters - White residents 5,778 83.6% Owner occupied1,134 16.4% Renter occupiedHouse owners and renters - Black or African American residents 66 32.2% Owner occupied139 67.8% Renter occupiedHouse owners and renters - American Indian / Alaska Native residents 29 100.0% Renter occupiedHouse owners and renters - Asian residents 1,014 93.0% Owner occupied76 7.0% Renter occupiedHouse owners and renters - Other race residents 96 79.7% Owner occupied24 20.3% Renter occupiedHouse owners and renters - Two or more races residents 294 56.1% Owner occupied230 43.9% Renter occupiedHouse owners and renters - White alone residents 5,793 83.9% Owner occupied1,108 16.1% Renter occupiedHouse owners and renters - Hispanic or Latino residents 277 47.2% Owner occupied310 52.8% Renter occupied
Language usage in Darien
English speakers - Total 74.2% of residents of Darien speak English at home.
4.3% of residents speak Spanish at home 675 74.9% Speak English very well226 25.1% Speak English less than very well20.9% of residents speak other language at home 3,414 78.0% Speak English very well962 22.0% Speak English less than very well
English speakers - Born in the United States 92.7% of residents of Darien speak English at home.
1.7% of residents speak Spanish at home 39 100.0% Speak English very well5.9% of residents speak other language at home 140 100.0% Speak English very well
English speakers - Native, born elsewhere 59.6% of residents of Darien speak English at home.
19.3% of residents speak Spanish at home 31 100.0% Speak English very well12.4% of residents speak other language at home 11 55.0% Speak English very well9 45.0% Speak English less than very well
English speakers - Foreign-born 9.2% of residents of Darien speak English at home.
8.7% of residents speak Spanish at home 139 39.9% Speak English very well209 60.1% Speak English less than very well81.0% of residents speak other language at home 2,338 72.2% Speak English very well902 27.8% Speak English less than very well
White (Caucasian) - Speak only English Native:
95.1% (12,813)Foreign-born:
13.8% (226)
White (Caucasian) - Speak another language Native:
5.2% (695)Foreign-born:
85.6% (1,401)
Black or African American - Speak only English Native:
99.6% (578)Foreign-born:
46.1% (2)
Black or African American - Speak another language Native:
1.3% (8)Foreign-born:
100.0% (4)
Asian - Speak only English Native:
71.0% (440)Foreign-born:
5.3% (94)
Asian - Speak another language Native:
31.5% (196)Foreign-born:
95.4% (1,702)
Other race - Speak another language Native:
56.9% (181)Foreign-born:
100.0% (16)
Two or more races - Speak only English Native:
62.4% (1,109)Foreign-born:
19.5% (57)
Two or more races - Speak another language Native:
38.1% (677)Foreign-born:
78.7% (230)
White alone - Speak only English Native:
94.3% (12,849)Foreign-born:
13.7% (250)
White alone - Speak another language Native:
5.6% (760)Foreign-born:
86.1% (1,565)
Hispanic or Latino - Speak only English Native:
52.6% (657)Foreign-born:
0.8% (3)
Hispanic or Latino - Speak another language Native:
46.8% (584)Foreign-born:
100.0% (342)
Foreign-born residents in Darien 4,015 residents are foreign born (9.0% Asia , 7.0% Europe ).
This city:
18.5%Illinois:
14.1%
Marital status for residents in Darien Marital status - White (Caucasian) population 15 years and over
Males 28.6% Never married55.4% Now married1.1% Separated6.3% Widowed8.7% DivorcedFemales 22.6% Never married58.1% Now married0.4% Separated8.1% Widowed10.8% DivorcedWomen who gave birth in the past 12 months Now married:
55.8% (81)Unmarried:
44.2% (65)
Women who did not give birth in the past 12 months Now married:
50.7% (1,406)Unmarried:
49.3% (1,368)
Marital status - Black or African American population 15 years and over
Males 45.9% Never married52.9% Now married0.0% Separated1.2% Widowed0.0% DivorcedFemales 45.7% Never married15.0% Now married0.0% Separated0.0% Widowed39.3% DivorcedWomen who did not give birth in the past 12 months Now married:
3.2% (3)Unmarried:
96.8% (94)
Marital status - Asian population 15 years and over
Males 18.8% Never married77.8% Now married1.6% Separated1.8% Widowed0.0% DivorcedFemales 21.5% Never married61.5% Now married0.0% Separated3.6% Widowed13.5% DivorcedWomen who gave birth in the past 12 months Now married:
100.0% (9)Unmarried:
0.0% (0)
Women who did not give birth in the past 12 months Now married:
56.1% (244)Unmarried:
43.9% (191)
Marital status - Other race population 15 years and over
Males 44.9% Never married46.6% Now married8.5% Separated0.0% Widowed0.0% DivorcedFemales 10.3% Never married89.7% Now married0.0% Separated0.0% Widowed0.0% DivorcedWomen who did not give birth in the past 12 months Now married:
87.0% (84)Unmarried:
13.0% (13)
Marital status - Two or more races population 15 years and over
Males 53.0% Never married39.7% Now married5.2% Separated0.0% Widowed2.1% DivorcedFemales 57.3% Never married31.8% Now married9.9% Separated0.0% Widowed1.0% DivorcedWomen who gave birth in the past 12 months Now married:
100.0% (7)Unmarried:
0.0% (0)
Women who did not give birth in the past 12 months Now married:
36.4% (271)Unmarried:
63.6% (473)
Marital status - White alone, not Hispanic / Latino population 15 years and over
Males 27.8% Never married56.2% Now married1.1% Separated6.2% Widowed8.7% DivorcedFemales 22.5% Never married57.8% Now married0.5% Separated8.3% Widowed11.0% DivorcedWomen who gave birth in the past 12 months Now married:
53.2% (78)Unmarried:
46.8% (69)
Women who did not give birth in the past 12 months Now married:
50.6% (1,451)Unmarried:
49.4% (1,419)
Marital status - Hispanic or Latino population 15 years and over
Males 46.5% Never married42.8% Now married5.3% Separated2.8% Widowed2.6% DivorcedFemales 36.6% Never married53.5% Now married9.9% Separated0.0% Widowed0.0% DivorcedWomen who gave birth in the past 12 months Now married:
100.0% (15)Unmarried:
0.0% (0)
Women who did not give birth in the past 12 months Now married:
56.4% (274)Unmarried:
43.6% (212)
Ancestries in Darien
1,104 10.3% Italian992 9.3% Polish860 8.0% Irish592 5.5% European465 4.3% German322 3.0% Czech305 2.8% Lithuanian226 2.1% Ukrainian215 2.0% English204 1.9% American196 1.8% Greek173 1.6% Slovak133 1.2% Egyptian131 1.2% Dutch123 1.1% Macedonian117 1.1% Swedish102 1.0% Serbian96 0.9% Bulgarian86 0.8% Syrian66 0.6% Croatian59 0.6% Albanian58 0.5% Russian42 0.4% Eastern European40 0.4% Norwegian35 0.3% Hungarian34 0.3% Romanian31 0.3% French Canadian24 0.2% Lebanese24 0.2% Danish24 0.2% Northern European21 0.2% African20 0.2% Czechoslovakian19 0.2% Scottish16 0.1% Armenian14 0.1% Jordanian10 0.09% Latvian10 0.09% British9 0.08% French7 0.07% Slovene7 0.07% Belgian6 0.06% Yugoslavian4 0.04% Swiss1 0.01% Haitian
Geographical mobility in Darien Same house 1 year ago 14,535 93.9% White (Caucasian)520 95.0% Black or African American42 99.7% American Indian / Alaska Native2,311 94.7% Asian222 59.9% Other race1,771 78.4% Two or more races14,897 94.4% White alone, not Hispanic / Latino1,218 69.1% Hispanic or LatinoMoved within same county 245 1.6% White / Caucasian39 7.1% Black or African American15 0.6% Asian90 24.2% Other race312 13.8% Two or more races191 1.2% White alone, not Hispanic / Latino376 21.3% Hispanic or LatinoMoved within same state 564 3.6% White / Caucasian3 0.5% Black or African American57 2.3% Asian41 11.1% Other race80 3.5% Two or more races556 3.5% White alone, not Hispanic / Latino103 5.8% Hispanic or LatinoMoved from different state 71 0.5% White / Caucasian27 1.1% Asian74 0.5% White alone, not Hispanic / LatinoMoved from abroad 170 1.1% White7 0.3% Asian35 1.6% Two or more races182 1.2% White alone, not Hispanic / Latino
Children Nativity (place of birth) in Darien
Children under 6 years - Living with two parents Both parents native 677 100.0% NativeBoth parents foreign-born 89 100.0% NativeOne native, one foreign-born parent 56 100.0% NativeChildren under 6 years - Living with one parent Native parent 168 100.0% NativeChildren 6 to 17 years - Living with two parents Both parents native 1,489 100.0% NativeBoth parents foreign-born 303 87.6% Native43 12.4% Foreign-bornOne native, one foreign-born parent 162 100.0% NativeChildren 6 to 17 years - Living with one parent Native parent 427 100.0% NativeForeign-born parent 143 49.6% Native145 50.4% Foreign-born