Races in Danvers, Massachusetts (MA) Detailed Stats
Data:
Races - White alone (%)
Races - White alone (% change since 2000)
Races - Black alone (%)
Races - Black alone (% change since 2000)
Races - American Indian alone (%)
Races - American Indian alone (% change since 2000)
Races - Asian alone (%)
Races - Asian alone (% change since 2000)
Races - Hispanic (%)
Races - Hispanic (% change since 2000)
Races - Native Hawaiian and Other Pacific Islander alone (%)
Races - Native Hawaiian and Other Pacific Islander alone (% change since 2000)
Races - Two or more races(%)
Races - Two or more races(% change since 2000)
Races - Other race alone (%)
Races - Other race alone (% change since 2000)
Racial diversity
Place of birth - Born in state of residence (%)
Place of birth - Born in state of residence (%) - White
Place of birth - Born in state of residence (%) - Black or African American
Place of birth - Born in state of residence (%) - Asian
Place of birth - Born in state of residence (%) - Hispanic or Latino
Place of birth - Born in state of residence (%) - American Indian and Alaska Native
Place of birth - Born in state of residence (%) - Multirace
Place of birth - Born in state of residence (%) - Other Race
Place of birth - Born in other state (%)
Place of birth - Born in other state (%) - White
Place of birth - Born in other state (%) - Black or African American
Place of birth - Born in other state (%) - Asian
Place of birth - Born in other state (%) - Hispanic or Latino
Place of birth - Born in other state (%) - American Indian and Alaska Native
Place of birth - Born in other state (%) - Multirace
Place of birth - Born in other state (%) - Other Race
Place of birth - Native, outside of US (%)
Place of birth - Native, outside of US (%) - White
Place of birth - Native, outside of US (%) - Black or African American
Place of birth - Native, outside of US (%) - Asian
Place of birth - Native, outside of US (%) - Hispanic or Latino
Place of birth - Native, outside of US (%) - American Indian and Alaska Native
Place of birth - Native, outside of US (%) - Multirace
Place of birth - Native, outside of US (%) - Other Race
Place of birth - Foreign born (%)
Place of birth - Foreign born (%) - White
Place of birth - Foreign born (%) - Black or African American
Place of birth - Foreign born (%) - Asian
Place of birth - Foreign born (%) - Hispanic or Latino
Place of birth - Foreign born (%) - American Indian and Alaska Native
Place of birth - Foreign born (%) - Multirace
Place of birth - Foreign born (%) - Other Race
Residents speaking English at home (%)
Residents speaking English at home - Born in the United States (%)
Residents speaking English at home - Native, born elsewhere (%)
Residents speaking English at home - Foreign born (%)
Residents speaking Spanish at home (%)
Residents speaking Spanish at home - Born in the United States (%)
Residents speaking Spanish at home - Native, born elsewhere (%)
Residents speaking Spanish at home - Foreign born (%)
Residents speaking other language at home (%)
Residents speaking other language at home - Born in the United States (%)
Residents speaking other language at home - Native, born elsewhere (%)
Residents speaking other language at home - Foreign born (%)
Marital status - Never married (%)
Marital status - Now married (%)
Marital status - Separated (%)
Marital status - Widowed (%)
Marital status - Divorced (%)
Ancestries Reported - Arab (%)
Ancestries Reported - Czech (%)
Ancestries Reported - Danish (%)
Ancestries Reported - Dutch (%)
Ancestries Reported - English (%)
Ancestries Reported - French (%)
Ancestries Reported - French Canadian (%)
Ancestries Reported - German (%)
Ancestries Reported - Greek (%)
Ancestries Reported - Hungarian (%)
Ancestries Reported - Irish (%)
Ancestries Reported - Italian (%)
Ancestries Reported - Lithuanian (%)
Ancestries Reported - Norwegian (%)
Ancestries Reported - Polish (%)
Ancestries Reported - Portuguese (%)
Ancestries Reported - Russian (%)
Ancestries Reported - Scotch-Irish (%)
Ancestries Reported - Scottish (%)
Ancestries Reported - Slovak (%)
Ancestries Reported - Subsaharan African (%)
Ancestries Reported - Swedish (%)
Ancestries Reported - Swiss (%)
Ancestries Reported - Ukrainian (%)
Ancestries Reported - United States (%)
Ancestries Reported - Welsh (%)
Ancestries Reported - West Indian (%)
Ancestries Reported - Other (%)
Geographical mobility - Same house 1 year ago (%)
Geographical mobility - Same house 1 year ago (%) - White
Geographical mobility - Same house 1 year ago (%) - Black or African American
Geographical mobility - Same house 1 year ago (%) - Asian
Geographical mobility - Same house 1 year ago (%) - Hispanic or Latino
Geographical mobility - Same house 1 year ago (%) - American Indian and Alaska Native
Geographical mobility - Same house 1 year ago (%) - Multirace
Geographical mobility - Same house 1 year ago (%) - Other Race
Geographical mobility - Moved within same county (%)
Geographical mobility - Moved within same county (%) - White
Geographical mobility - Moved within same county (%) - Black or African American
Geographical mobility - Moved within same county (%) - Asian
Geographical mobility - Moved within same county (%) - Hispanic or Latino
Geographical mobility - Moved within same county (%) - American Indian and Alaska Native
Geographical mobility - Moved within same county (%) - Multirace
Geographical mobility - Moved within same county (%) - Other Race
Geographical mobility - Moved from different county within same state (%)
Geographical mobility - Moved from different county within same state (%) - White
Geographical mobility - Moved from different county within same state (%) - Black or African American
Geographical mobility - Moved from different county within same state (%) - Asian
Geographical mobility - Moved from different county within same state (%) - Hispanic or Latino
Geographical mobility - Moved from different county within same state (%) - American Indian and Alaska Native
Geographical mobility - Moved from different county within same state (%) - Multirace
Geographical mobility - Moved from different county within same state (%) - Other Race
Geographical mobility - Moved from different state (%)
Geographical mobility - Moved from different state (%) - White
Geographical mobility - Moved from different state (%) - Black or African American
Geographical mobility - Moved from different state (%) - Asian
Geographical mobility - Moved from different state (%) - Hispanic or Latino
Geographical mobility - Moved from different state (%) - American Indian and Alaska Native
Geographical mobility - Moved from different state (%) - Multirace
Geographical mobility - Moved from different state (%) - Other Race
Geographical mobility - Moved from abroad (%)
Geographical mobility - Moved from abroad (%) - White
Geographical mobility - Moved from abroad (%) - Black or African American
Geographical mobility - Moved from abroad (%) - Asian
Geographical mobility - Moved from abroad (%) - Hispanic or Latino
Geographical mobility - Moved from abroad (%) - American Indian and Alaska Native
Geographical mobility - Moved from abroad (%) - Multirace
Geographical mobility - Moved from abroad (%) - Other Race
Place of birth for the foreign-born population - Ireland (%)
Place of birth for the foreign-born population - Denmark (%)
Place of birth for the foreign-born population - Norway (%)
Place of birth for the foreign-born population - Sweden (%)
Place of birth for the foreign-born population - United Kingdom (%)
Place of birth for the foreign-born population - England (%)
Place of birth for the foreign-born population - Scotland (%)
Place of birth for the foreign-born population - Other Northern Europe (%)
Place of birth for the foreign-born population - Austria (%)
Place of birth for the foreign-born population - Belgium (%)
Place of birth for the foreign-born population - France (%)
Place of birth for the foreign-born population - Germany (%)
Place of birth for the foreign-born population - Netherlands (%)
Place of birth for the foreign-born population - Switzerland (%)
Place of birth for the foreign-born population - Other Western Europe (%)
Place of birth for the foreign-born population - Greece (%)
Place of birth for the foreign-born population - Italy (%)
Place of birth for the foreign-born population - Portugal (%)
Place of birth for the foreign-born population - Spain (%)
Place of birth for the foreign-born population - Other Southern Europe (%)
Place of birth for the foreign-born population - Albania (%)
Place of birth for the foreign-born population - Belarus (%)
Place of birth for the foreign-born population - Bosnia and Herzegovina (%)
Place of birth for the foreign-born population - Bulgaria (%)
Place of birth for the foreign-born population - Croatia (%)
Place of birth for the foreign-born population - Czechoslovakia (%)
Place of birth for the foreign-born population - Hungary (%)
Place of birth for the foreign-born population - Latvia (%)
Place of birth for the foreign-born population - Lithuania (%)
Place of birth for the foreign-born population - North Macedonia (Macedonia) (%)
Place of birth for the foreign-born population - Moldova (%)
Place of birth for the foreign-born population - Poland (%)
Place of birth for the foreign-born population - Romania (%)
Place of birth for the foreign-born population - Russia (%)
Place of birth for the foreign-born population - Serbia (%)
Place of birth for the foreign-born population - Ukraine (%)
Place of birth for the foreign-born population - Other Eastern Europe (%)
Place of birth for the foreign-born population - China (%)
Place of birth for the foreign-born population - Hong Kong (%)
Place of birth for the foreign-born population - Taiwan (%)
Place of birth for the foreign-born population - Japan (%)
Place of birth for the foreign-born population - Korea (%)
Place of birth for the foreign-born population - Other Eastern Asia (%)
Place of birth for the foreign-born population - Afghanistan (%)
Place of birth for the foreign-born population - Bangladesh (%)
Place of birth for the foreign-born population - India (%)
Place of birth for the foreign-born population - Iran (%)
Place of birth for the foreign-born population - Kazakhstan (%)
Place of birth for the foreign-born population - Nepal (%)
Place of birth for the foreign-born population - Pakistan (%)
Place of birth for the foreign-born population - Sri Lanka (%)
Place of birth for the foreign-born population - Uzbekistan (%)
Place of birth for the foreign-born population - Other South Central Asia (%)
Place of birth for the foreign-born population - Burma (%)
Place of birth for the foreign-born population - Cambodia (%)
Place of birth for the foreign-born population - Indonesia (%)
Place of birth for the foreign-born population - Laos (%)
Place of birth for the foreign-born population - Malaysia (%)
Place of birth for the foreign-born population - Philippines (%)
Place of birth for the foreign-born population - Singapore (%)
Place of birth for the foreign-born population - Thailand (%)
Place of birth for the foreign-born population - Vietnam (%)
Place of birth for the foreign-born population - Other South Eastern Asia (%)
Place of birth for the foreign-born population - Armenia (%)
Place of birth for the foreign-born population - Iraq (%)
Place of birth for the foreign-born population - Israel (%)
Place of birth for the foreign-born population - Jordan (%)
Place of birth for the foreign-born population - Kuwait (%)
Place of birth for the foreign-born population - Lebanon (%)
Place of birth for the foreign-born population - Saudi Arabia (%)
Place of birth for the foreign-born population - Syria (%)
Place of birth for the foreign-born population - Turkey (%)
Place of birth for the foreign-born population - Yemen (%)
Place of birth for the foreign-born population - Other Western Asia (%)
Place of birth for the foreign-born population - Eritrea (%)
Place of birth for the foreign-born population - Ethiopia (%)
Place of birth for the foreign-born population - Kenya (%)
Place of birth for the foreign-born population - Somalia (%)
Place of birth for the foreign-born population - Uganda (%)
Place of birth for the foreign-born population - Zimbabwe (%)
Place of birth for the foreign-born population - Other Eastern Africa (%)
Place of birth for the foreign-born population - Cameroon (%)
Place of birth for the foreign-born population - Congo (%)
Place of birth for the foreign-born population - Democratic Republic of Congo (Zaire) (%)
Place of birth for the foreign-born population - Other Middle Africa (%)
Place of birth for the foreign-born population - Egypt (%)
Place of birth for the foreign-born population - Morocco (%)
Place of birth for the foreign-born population - Sudan (%)
Place of birth for the foreign-born population - Other Northern Africa (%)
Place of birth for the foreign-born population - South Africa (%)
Place of birth for the foreign-born population - Other Southern Africa (%)
Place of birth for the foreign-born population - Cabo Verde (%)
Place of birth for the foreign-born population - Ghana (%)
Place of birth for the foreign-born population - Liberia (%)
Place of birth for the foreign-born population - Nigeria (%)
Place of birth for the foreign-born population - Senegal (%)
Place of birth for the foreign-born population - Sierra Leone (%)
Place of birth for the foreign-born population - Other Western Africa (%)
Place of birth for the foreign-born population - Australia (%)
Place of birth for the foreign-born population - New Zealand (%)
Place of birth for the foreign-born population - Fiji (%)
Place of birth for the foreign-born population - Micronesia (%)
Place of birth for the foreign-born population - Bahamas (%)
Place of birth for the foreign-born population - Barbados (%)
Place of birth for the foreign-born population - Cuba (%)
Place of birth for the foreign-born population - Dominica (%)
Place of birth for the foreign-born population - Dominican Republic (%)
Place of birth for the foreign-born population - Grenada (%)
Place of birth for the foreign-born population - Haiti (%)
Place of birth for the foreign-born population - Jamaica (%)
Place of birth for the foreign-born population - St. Vincent and the Grenadines (%)
Place of birth for the foreign-born population - Trinidad and Tobago (%)
Place of birth for the foreign-born population - West Indies (%)
Place of birth for the foreign-born population - Other Caribbean (%)
Place of birth for the foreign-born population - Belize (%)
Place of birth for the foreign-born population - Costa Rica (%)
Place of birth for the foreign-born population - El Salvador (%)
Place of birth for the foreign-born population - Guatemala (%)
Place of birth for the foreign-born population - Honduras (%)
Place of birth for the foreign-born population - Mexico (%)
Place of birth for the foreign-born population - Nicaragua (%)
Place of birth for the foreign-born population - Panama (%)
Place of birth for the foreign-born population - Other Central America (%)
Place of birth for the foreign-born population - Argentina (%)
Place of birth for the foreign-born population - Bolivia (%)
Place of birth for the foreign-born population - Brazil (%)
Place of birth for the foreign-born population - Chile (%)
Place of birth for the foreign-born population - Colombia (%)
Place of birth for the foreign-born population - Ecuador (%)
Place of birth for the foreign-born population - Guyana (%)
Place of birth for the foreign-born population - Peru (%)
Place of birth for the foreign-born population - Uruguay (%)
Place of birth for the foreign-born population - Venezuela (%)
Place of birth for the foreign-born population - Other South America (%)
Place of birth for the foreign-born population - Canada (%)
Place of birth for the foreign-born population - Other Northern America (%)
Place of birth for the foreign-born population - Other (%)
Latest news about races in Danvers, MA collected exclusively by city-data.com from local newspapers, TV, and radio stations
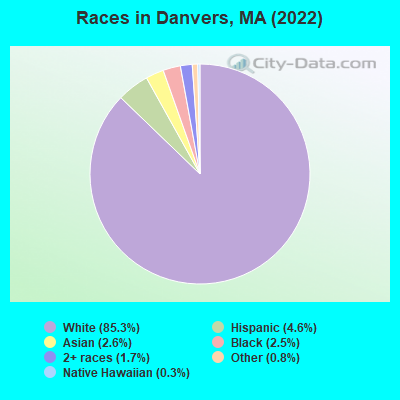
According to 2022 data, the most numerous races in Danvers, MA are White alone (23,818 residents), Hispanic (1,272 residents), and Asian alone (735 residents). 86.5% of Danvers residents speak English at home. 9.5% of Danvers, MA residents are foreign-born (4.0% born in Latin America, 2.2% born in Asia, 2.2% born in Europe), which is 90.1% less than the foreign-born rate of 18.0% across the entire state of Massachusetts.
Race distribution in Danvers
2000 2022
5,198,359 81.9% White alone 428,729 6.8% Hispanic 318,329 5.0% Black alone 236,786 3.7% Asian alone 110,338 1.7% Two or more races 43,586 0.7% Other race alone 11,264 0.2% American Indian alone 1,706 0.03% Native Hawaiian and Other
4,676,627 67.0% White alone 911,038 13.0% Hispanic 501,463 7.2% Asian alone 459,740 6.6% Black alone 341,889 4.9% Two or more races 84,403 1.2% Other race alone 5,838 0.08% American Indian alone 976 0.01% Native Hawaiian and Other
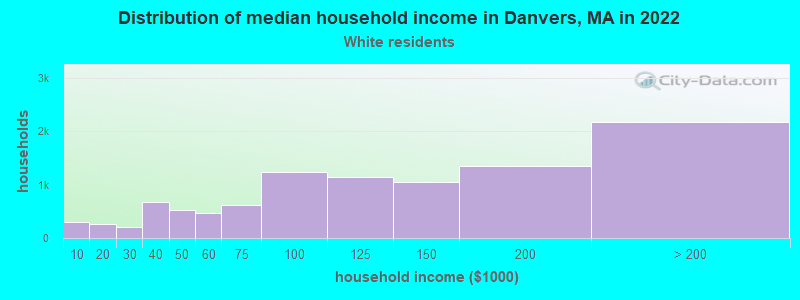
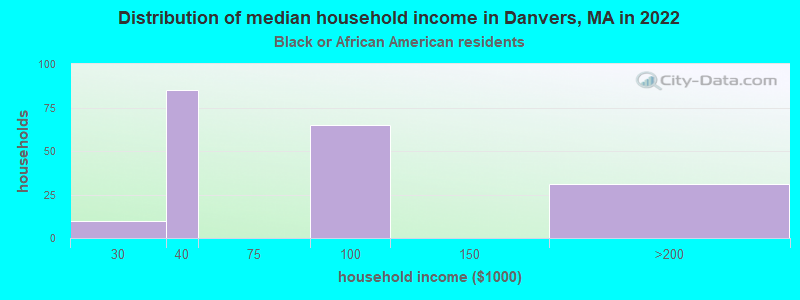
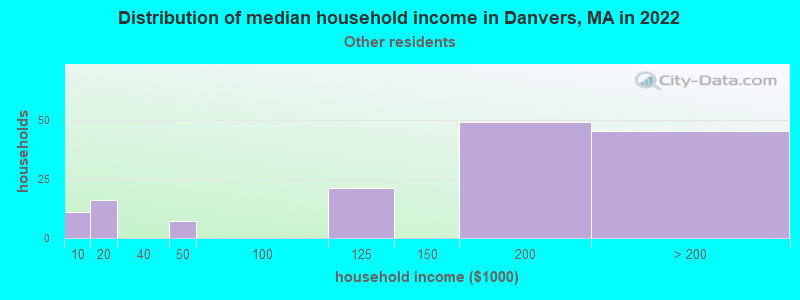
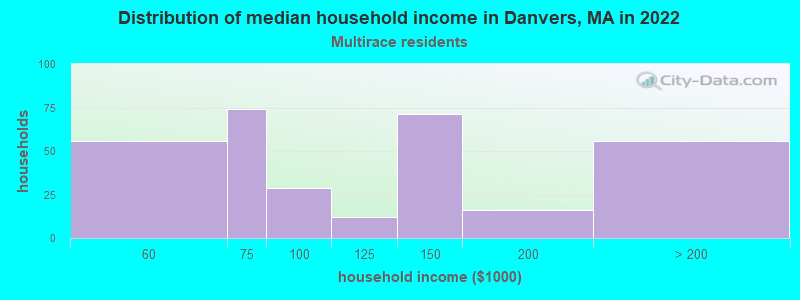
Income and house value in Danvers Median household income in 2022 $116,844 White non-Hispanic householders$102,184 Black householders$92,249 Asian householders$187,153 Some other race householders$128,913 Two or more races householders$77,654 Hispanic or Latino race householdersMedian 2022 house value $657,343 White Non-Hispanic householders$533,096 Black or African American householders over $1,000,000 Asian householders$394,917 Some other race householders$462,016 Two or more races householders$223,473 Hispanic or Latino householders
Median age by race in Danvers
49.8 Median age for White residents47.9 50.0 29.8 Median age for Black or African American residents32.3 29.3 -713,541,666.0 Median age for American Indian / Alaska Native residents-679,156,908.0 -364,551,862.7 35.9 Median age for Asian residents31.8 36.7 -514,227,641.8 Median age for Native Hawaiian / Pacific Islander residents-666,666,666.0 -508,717,948.2 30.7 Median age for Other race residents31.5 30.8 30.2 Median age for Two or more races residents29.4 35.4 49.7 Median age for White alone residents48.9 50.3 29.4 Median age for Hispanic or Latino residents30.2 28.4
Owner/renter occupied households by race in Danvers
House owners and renters - White residents 7,401 73.7% Owner occupied2,635 26.3% Renter occupiedHouse owners and renters - Black or African American residents 18 13.1% Owner occupied118 86.9% Renter occupiedHouse owners and renters - Asian residents 153 76.7% Owner occupied47 23.3% Renter occupiedHouse owners and renters - Other race residents 42 30.3% Owner occupied97 69.7% Renter occupiedHouse owners and renters - Two or more races residents 188 65.4% Owner occupied99 34.6% Renter occupiedHouse owners and renters - White alone residents 7,414 73.1% Owner occupied2,734 26.9% Renter occupiedHouse owners and renters - Hispanic or Latino residents 148 40.6% Owner occupied216 59.4% Renter occupied
Language usage in Danvers
English speakers - Total 86.5% of residents of Danvers speak English at home.
3.4% of residents speak Spanish at home 628 68.6% Speak English very well288 31.4% Speak English less than very well8.8% of residents speak other language at home 1,602 68.4% Speak English very well740 31.6% Speak English less than very well
English speakers - Born in the United States 94.8% of residents of Danvers speak English at home.
3.2% of residents speak Spanish at home 119 100.0% Speak English very well2.1% of residents speak other language at home 56 70.0% Speak English very well24 30.0% Speak English less than very well
English speakers - Native, born elsewhere 77.8% of residents of Danvers speak English at home.
30.7% of residents speak Spanish at home 9 13.0% Speak English very well60 87.0% Speak English less than very well2.2% of residents speak other language at home 5 100.0% Speak English very well
English speakers - Foreign-born 21.3% of residents of Danvers speak English at home.
18.2% of residents speak Spanish at home 319 64.7% Speak English very well174 35.3% Speak English less than very well56.7% of residents speak other language at home 873 56.8% Speak English very well665 43.2% Speak English less than very well
White (Caucasian) - Speak only English Native:
98.3% (21,301)Foreign-born:
27.4% (283)
White (Caucasian) - Speak another language Native:
2.4% (520)Foreign-born:
72.7% (750)
Black or African American - Speak only English Native:
68.8% (203)Foreign-born:
17.0% (40)
Black or African American - Speak another language Native:
28.7% (85)Foreign-born:
79.9% (188)
Asian - Speak only English Native:
52.2% (115)Foreign-born:
19.6% (95)
Asian - Speak another language Native:
47.1% (104)Foreign-born:
78.9% (382)
Other race - Speak only English Native:
53.4% (129)Foreign-born:
9.2% (16)
Other race - Speak another language Native:
53.0% (128)Foreign-born:
91.0% (158)
Two or more races - Speak only English Native:
80.4% (378)Foreign-born:
35.8% (112)
Two or more races - Speak another language Native:
15.7% (74)Foreign-born:
72.6% (228)
White alone - Speak only English Native:
97.4% (21,423)Foreign-born:
33.2% (315)
White alone - Speak another language Native:
2.5% (557)Foreign-born:
66.7% (634)
Hispanic or Latino - Speak only English Native:
24.5% (100)Foreign-born:
3.6% (26)
Hispanic or Latino - Speak another language Native:
75.2% (308)Foreign-born:
96.2% (695)
Foreign-born residents in Danvers 2,645 residents are foreign born (4.0% Latin America , 2.2% Asia , 2.2% Europe ).
This city:
9.5%Massachusetts:
17.6%
Marital status for residents in Danvers Marital status - White (Caucasian) population 15 years and over
Males 31.6% Never married56.4% Now married0.9% Separated2.3% Widowed8.8% DivorcedFemales 26.9% Never married49.6% Now married1.1% Separated10.7% Widowed11.5% DivorcedWomen who gave birth in the past 12 months Now married:
52.0% (82)Unmarried:
48.0% (76)
Women who did not give birth in the past 12 months Now married:
42.5% (2,011)Unmarried:
57.5% (2,725)
Marital status - Black or African American population 15 years and over
Males 26.7% Never married65.4% Now married0.0% Separated0.0% Widowed7.8% DivorcedFemales 41.0% Never married59.0% Now married0.0% Separated0.0% Widowed0.0% DivorcedWomen who gave birth in the past 12 months Now married:
100.0% (83)Unmarried:
0.0% (0)
Women who did not give birth in the past 12 months Now married:
19.0% (15)Unmarried:
81.0% (64)
Marital status - Asian population 15 years and over
Males 42.2% Never married57.8% Now married0.0% Separated0.0% Widowed0.0% DivorcedFemales 35.1% Never married38.5% Now married0.0% Separated20.1% Widowed6.3% DivorcedWomen who did not give birth in the past 12 months Now married:
41.9% (84)Unmarried:
58.1% (117)
Marital status - Other race population 15 years and over
Males 29.8% Never married70.2% Now married0.0% Separated0.0% Widowed0.0% DivorcedFemales 12.8% Never married77.7% Now married0.0% Separated9.6% Widowed0.0% DivorcedWomen who gave birth in the past 12 months Now married:
100.0% (31)Unmarried:
0.0% (0)
Women who did not give birth in the past 12 months Now married:
76.5% (50)Unmarried:
23.5% (15)
Marital status - Two or more races population 15 years and over
Males 51.2% Never married32.3% Now married0.0% Separated0.0% Widowed16.6% DivorcedFemales 33.8% Never married59.6% Now married0.0% Separated3.1% Widowed3.5% DivorcedWomen who gave birth in the past 12 months Now married:
100.0% (17)Unmarried:
0.0% (0)
Women who did not give birth in the past 12 months Now married:
42.9% (88)Unmarried:
57.1% (117)
Marital status - White alone, not Hispanic / Latino population 15 years and over
Males 31.5% Never married56.8% Now married0.9% Separated2.4% Widowed8.4% DivorcedFemales 27.2% Never married48.8% Now married1.2% Separated11.0% Widowed11.9% DivorcedWomen who gave birth in the past 12 months Now married:
52.0% (87)Unmarried:
48.0% (80)
Women who did not give birth in the past 12 months Now married:
40.4% (1,915)Unmarried:
59.6% (2,821)
Marital status - Hispanic or Latino population 15 years and over
Males 30.5% Never married50.2% Now married0.0% Separated0.0% Widowed19.3% DivorcedFemales 15.1% Never married83.1% Now married0.0% Separated1.9% Widowed0.0% DivorcedWomen who gave birth in the past 12 months Now married:
100.0% (8)Unmarried:
0.0% (0)
Women who did not give birth in the past 12 months Now married:
83.1% (376)Unmarried:
16.9% (77)
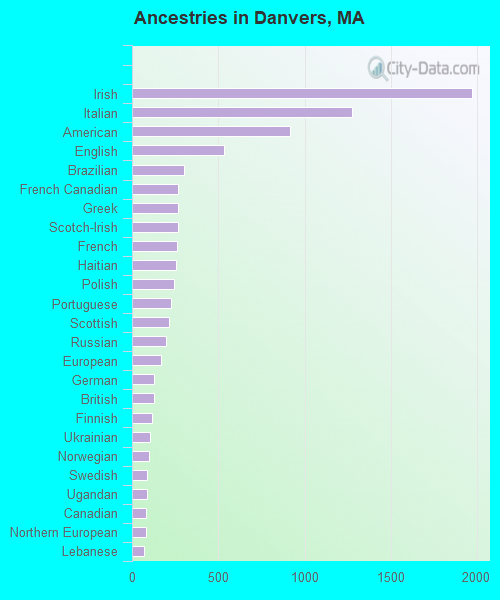
Ancestries in Danvers
1,971 18.2% Irish1,276 11.8% Italian916 8.5% American531 4.9% English302 2.8% Brazilian268 2.5% French Canadian268 2.5% Greek267 2.5% Scotch-Irish260 2.4% French257 2.4% Haitian244 2.3% Polish226 2.1% Portuguese213 2.0% Scottish199 1.8% Russian171 1.6% European130 1.2% German126 1.2% British115 1.1% Finnish102 0.9% Ukrainian98 0.9% Norwegian88 0.8% Swedish86 0.8% Ugandan83 0.8% Canadian80 0.7% Northern European71 0.7% Lebanese69 0.6% Iraqi49 0.5% Czechoslovakian34 0.3% Jordanian32 0.3% Albanian19 0.2% Swiss16 0.1% Slovene15 0.1% Israeli14 0.1% Kenyan14 0.1% Welsh13 0.1% Eastern European10 0.09% Armenian9 0.08% Belgian6 0.06% West Indian4 0.04% Lithuanian1 0.01% Hungarian
Geographical mobility in Danvers Same house 1 year ago 20,626 88.6% White (Caucasian)533 97.6% Black or African American635 85.6% Asian72 100.0% Native Hawaiian / Pacific Islander428 89.3% Other race718 87.1% Two or more races20,829 88.3% White alone, not Hispanic / Latino1,161 92.2% Hispanic or LatinoMoved within same county 1,615 6.9% White / Caucasian1 0.1% Black or African American30 4.1% Asian30 6.3% Other race84 10.1% Two or more races1,688 7.2% White alone, not Hispanic / Latino65 5.2% Hispanic or LatinoMoved within same state 673 2.9% White / Caucasian23 4.3% Black or African American1 0.3% Other race11 1.3% Two or more races714 3.0% White alone, not Hispanic / Latino2 0.1% Hispanic or LatinoMoved from different state 173 0.7% White / Caucasian26 65.4% American Indian / Alaska Native176 0.7% White alone, not Hispanic / Latino32 2.5% Hispanic or LatinoMoved from abroad 116 0.5% White32 4.4% Asian156 0.7% White alone, not Hispanic / Latino
Children Nativity (place of birth) in Danvers
Children under 6 years - Living with two parents Both parents native 868 100.0% NativeBoth parents foreign-born 117 100.0% NativeOne native, one foreign-born parent 113 100.0% NativeChildren under 6 years - Living with one parent Native parent 309 100.0% NativeForeign-born parent 35 100.0% Foreign-bornChildren 6 to 17 years - Living with two parents Both parents native 1,952 99.3% Native13 0.7% Foreign-bornBoth parents foreign-born 349 93.1% Native26 6.9% Foreign-bornOne native, one foreign-born parent 106 86.5% Native17 13.5% Foreign-bornChildren 6 to 17 years - Living with one parent Native parent 565 100.0% NativeForeign-born parent 79 48.5% Native84 51.5% Foreign-born
Grandparents responsible for own grandchildren in Danvers
Grandparents (30 to 59 years) White / Caucasian 49 35.2% Responsible for grandchildren90 64.8% Not responsible for grandchildrenWhite alone, not Hispanic / Latino 34 23.9% Responsible for grandchildren108 76.1% Not responsible for grandchildrenGrandparents (60 years and over) White / Caucasian 50 18.5% Responsible for grandchildren220 81.5% Not responsible for grandchildrenWhite alone, not Hispanic / Latino 57 20.0% Responsible for grandchildren229 80.0% Not responsible for grandchildren