Races in Curlew, Washington (WA) Detailed Stats
Ancestries, Foreign-born residents, place of birth

Data:
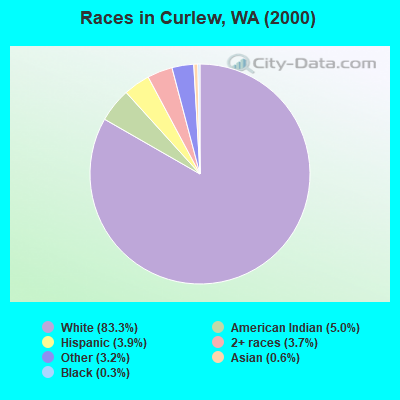
Race distribution in Curlew

- 1,33783.3%White alone
- 805.0%American Indian alone
- 623.9%Hispanic
- 593.7%Two or more races
- 523.2%Other race alone
- 100.6%Asian alone
- 50.3%Black alone
2000
2022
-
- 4,652,49078.9%White alone
- 441,5097.5%Hispanic
- 319,4015.4%Asian alone
- 184,6313.1%Black alone
- 175,9263.0%Two or more races
- 85,3961.4%American Indian alone
- 22,7790.4%Native Hawaiian and Other
Pacific Islander alone
- 11,9890.2%Other race alone
-
- 4,941,45663.5%White alone
- 1,093,31314.0%Hispanic
- 755,8329.7%Asian alone
- 523,4486.7%Two or more races
- 299,5373.8%Black alone
- 69,0240.9%American Indian alone
- 52,2310.7%Native Hawaiian and Other
Pacific Islander alone
- 50,9450.7%Other race alone
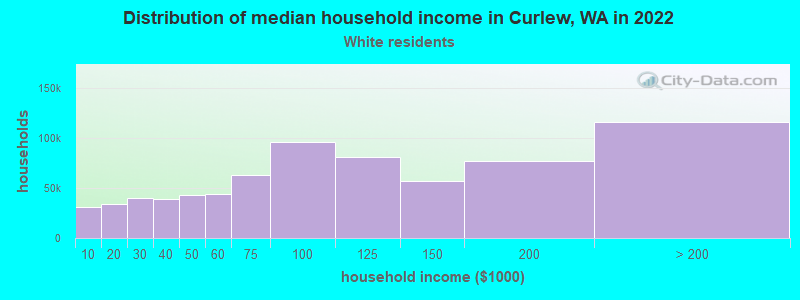
Income and house value in Curlew
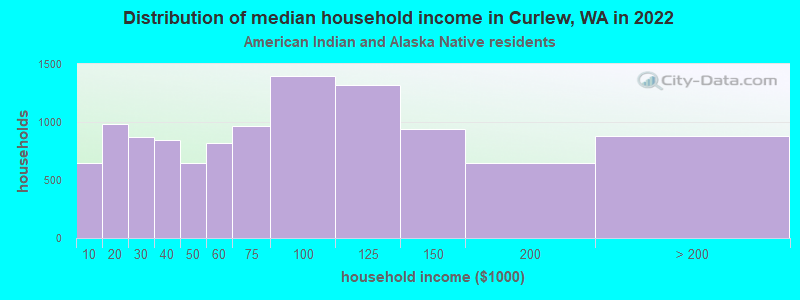
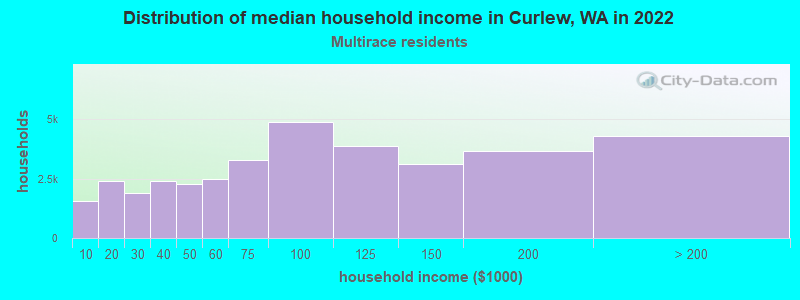
- Median household income in 2022
- $58,028White non-Hispanic householders
- $45,221American Indian and Alaska Native householders
- $17,942Some other race householders
- $22,545Two or more races householders
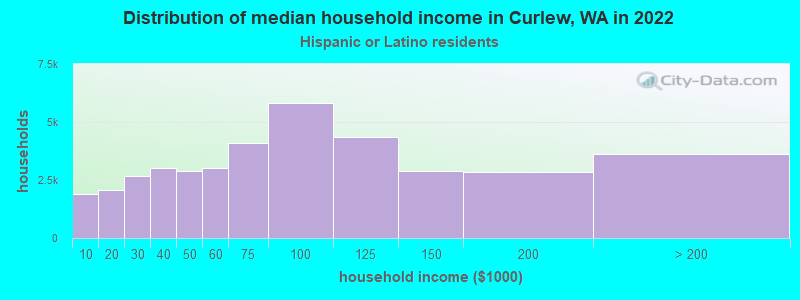
- $19,462Hispanic or Latino race householders
- Median 2022 house value
- $355,593White Non-Hispanic householders
- $200,457American Indian or Alaska Native householders