Races in Crystal Lake, Wisconsin (WI) Detailed Stats
Ancestries, Foreign-born residents, place of birth
0.8% of Crystal Lake, WI residents are foreign-born , which is 548.3% less than the foreign-born rate of 5.0% across the entire state of Wisconsin.
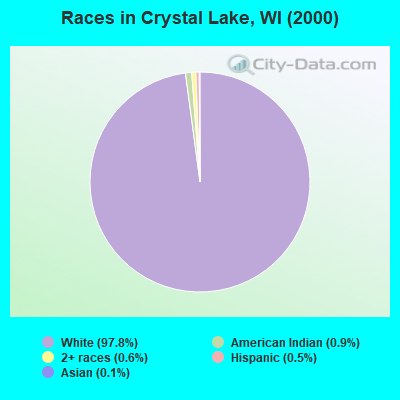
Race distribution in Crystal Lake

- 76197.8%White alone
- 70.9%American Indian alone
- 50.6%Two or more races
- 40.5%Hispanic
- 10.1%Asian alone
2000
2022
-
- 4,681,63087.3%White alone
- 300,2455.6%Black alone
- 192,9213.6%Hispanic
- 87,9951.6%Asian alone
- 51,9211.0%Two or more races
- 43,9800.8%American Indian alone
- 3,6370.07%Other race alone
- 1,3460.03%Native Hawaiian and Other
Pacific Islander alone

-
- 4,654,03179.0%White alone
- 447,0227.6%Hispanic
- 345,6785.9%Black alone
- 217,5323.7%Two or more races
- 172,2422.9%Asian alone
- 33,7620.6%American Indian alone
- 19,6800.3%Other race alone
- 2,5920.04%Native Hawaiian and Other
Pacific Islander alone

Income and house value in Crystal Lake
- Median household income in 2022
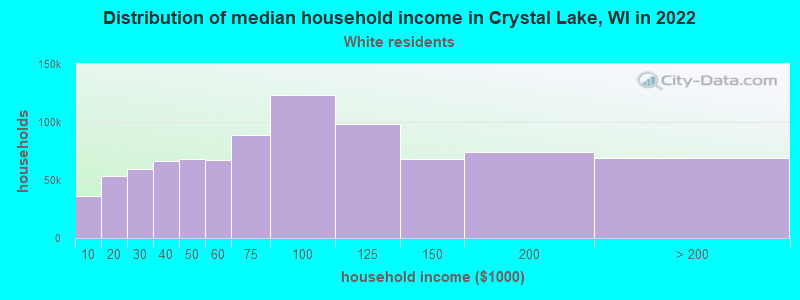
- $63,061White non-Hispanic householders
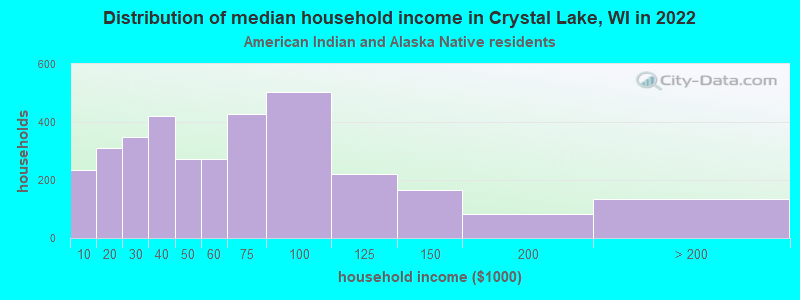
- $22,361American Indian and Alaska Native householders
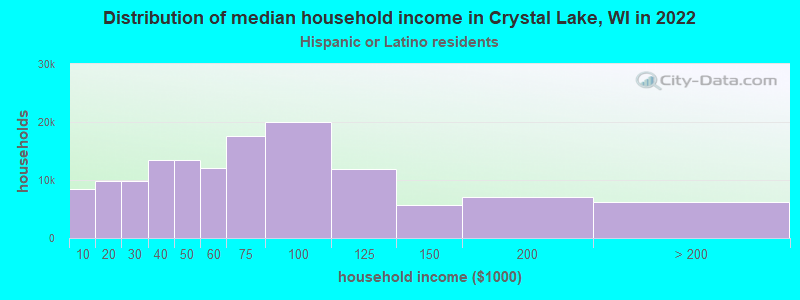
- $124,738Hispanic or Latino race householders
- Median 2022 house value
- $187,019White Non-Hispanic householders
- $236,890American Indian or Alaska Native householders
- $162,083Hispanic or Latino householders
Household income for White non-Hispanic householders
Household income for American Indian and Alaska Native householders
Household income for Hispanic or Latino race householders
Foreign-born residents in Crystal Lake
6 residents are foreign born
| This city: | 0.8% |
| Wisconsin: | 3.6% |
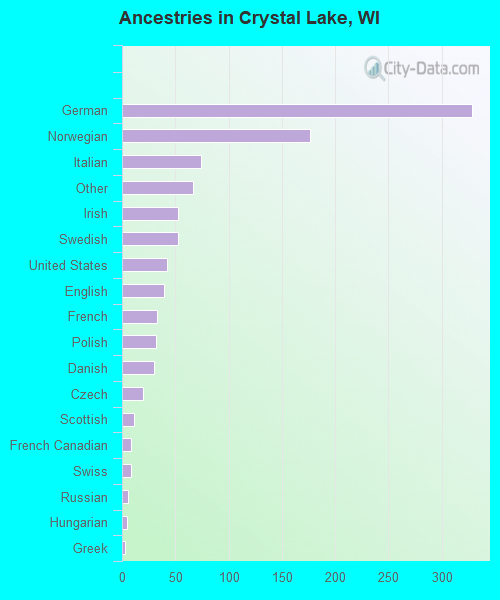
Ancestries in Crystal Lake

- 32833.1%German
- 17617.7%Norwegian
- 747.5%Italian
- 676.8%Other
- 535.3%Irish
- 535.3%Swedish
- 424.2%United States
- 393.9%English
- 333.3%French
- 323.2%Polish
- 303.0%Danish
- 202.0%Czech
- 111.1%Scottish
- 80.8%French Canadian
- 80.8%Swiss
- 60.6%Russian
- 50.5%Hungarian
- 30.3%Greek
- 20.2%Dutch
- 20.2%Scotch-Irish
Zip codes: 54826.