Races in Crookston, Minnesota (MN) Detailed Stats
Data:
Races - White alone (%)
Races - White alone (% change since 2000)
Races - Black alone (%)
Races - Black alone (% change since 2000)
Races - American Indian alone (%)
Races - American Indian alone (% change since 2000)
Races - Asian alone (%)
Races - Asian alone (% change since 2000)
Races - Hispanic (%)
Races - Hispanic (% change since 2000)
Races - Native Hawaiian and Other Pacific Islander alone (%)
Races - Native Hawaiian and Other Pacific Islander alone (% change since 2000)
Races - Two or more races(%)
Races - Two or more races(% change since 2000)
Races - Other race alone (%)
Races - Other race alone (% change since 2000)
Racial diversity
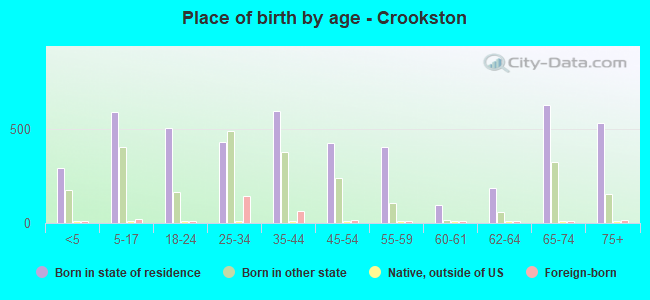
Place of birth - Born in state of residence (%)
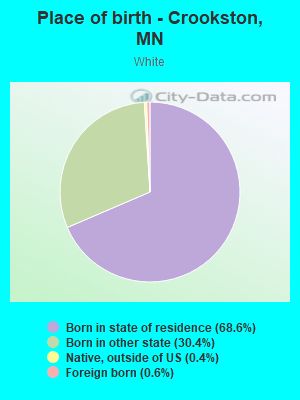
Place of birth - Born in state of residence (%) - White
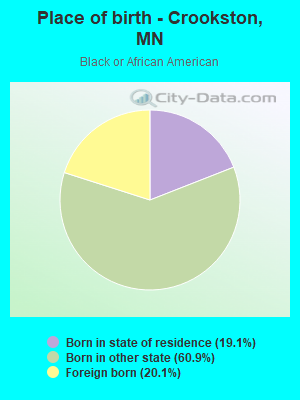
Place of birth - Born in state of residence (%) - Black or African American
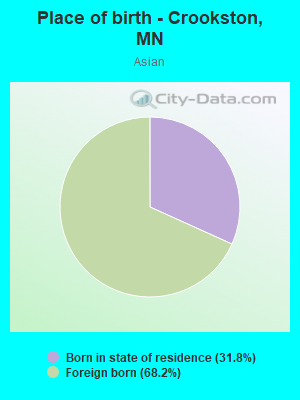
Place of birth - Born in state of residence (%) - Asian
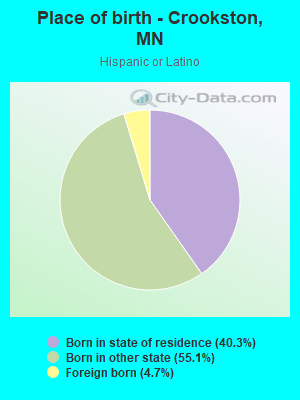
Place of birth - Born in state of residence (%) - Hispanic or Latino
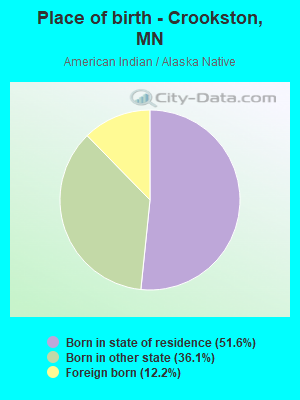
Place of birth - Born in state of residence (%) - American Indian and Alaska Native
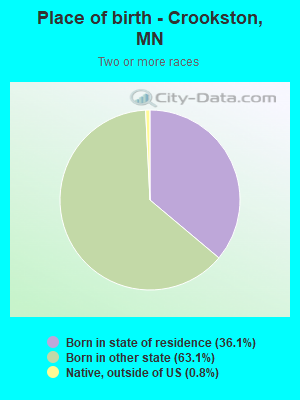
Place of birth - Born in state of residence (%) - Multirace
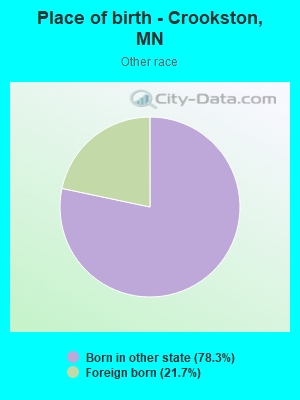
Place of birth - Born in state of residence (%) - Other Race
Place of birth - Born in other state (%)
Place of birth - Born in other state (%) - White
Place of birth - Born in other state (%) - Black or African American
Place of birth - Born in other state (%) - Asian
Place of birth - Born in other state (%) - Hispanic or Latino
Place of birth - Born in other state (%) - American Indian and Alaska Native
Place of birth - Born in other state (%) - Multirace
Place of birth - Born in other state (%) - Other Race
Place of birth - Native, outside of US (%)
Place of birth - Native, outside of US (%) - White
Place of birth - Native, outside of US (%) - Black or African American
Place of birth - Native, outside of US (%) - Asian
Place of birth - Native, outside of US (%) - Hispanic or Latino
Place of birth - Native, outside of US (%) - American Indian and Alaska Native
Place of birth - Native, outside of US (%) - Multirace
Place of birth - Native, outside of US (%) - Other Race
Place of birth - Foreign born (%)
Place of birth - Foreign born (%) - White
Place of birth - Foreign born (%) - Black or African American
Place of birth - Foreign born (%) - Asian
Place of birth - Foreign born (%) - Hispanic or Latino
Place of birth - Foreign born (%) - American Indian and Alaska Native
Place of birth - Foreign born (%) - Multirace
Place of birth - Foreign born (%) - Other Race
Residents speaking English at home (%)
Residents speaking English at home - Born in the United States (%)
Residents speaking English at home - Native, born elsewhere (%)
Residents speaking English at home - Foreign born (%)
Residents speaking Spanish at home (%)
Residents speaking Spanish at home - Born in the United States (%)
Residents speaking Spanish at home - Native, born elsewhere (%)
Residents speaking Spanish at home - Foreign born (%)
Residents speaking other language at home (%)
Residents speaking other language at home - Born in the United States (%)
Residents speaking other language at home - Native, born elsewhere (%)
Residents speaking other language at home - Foreign born (%)
Marital status - Never married (%)
Marital status - Now married (%)
Marital status - Separated (%)
Marital status - Widowed (%)
Marital status - Divorced (%)
Ancestries Reported - Arab (%)
Ancestries Reported - Czech (%)
Ancestries Reported - Danish (%)
Ancestries Reported - Dutch (%)
Ancestries Reported - English (%)
Ancestries Reported - French (%)
Ancestries Reported - French Canadian (%)
Ancestries Reported - German (%)
Ancestries Reported - Greek (%)
Ancestries Reported - Hungarian (%)
Ancestries Reported - Irish (%)
Ancestries Reported - Italian (%)
Ancestries Reported - Lithuanian (%)
Ancestries Reported - Norwegian (%)
Ancestries Reported - Polish (%)
Ancestries Reported - Portuguese (%)
Ancestries Reported - Russian (%)
Ancestries Reported - Scotch-Irish (%)
Ancestries Reported - Scottish (%)
Ancestries Reported - Slovak (%)
Ancestries Reported - Subsaharan African (%)
Ancestries Reported - Swedish (%)
Ancestries Reported - Swiss (%)
Ancestries Reported - Ukrainian (%)
Ancestries Reported - United States (%)
Ancestries Reported - Welsh (%)
Ancestries Reported - West Indian (%)
Ancestries Reported - Other (%)
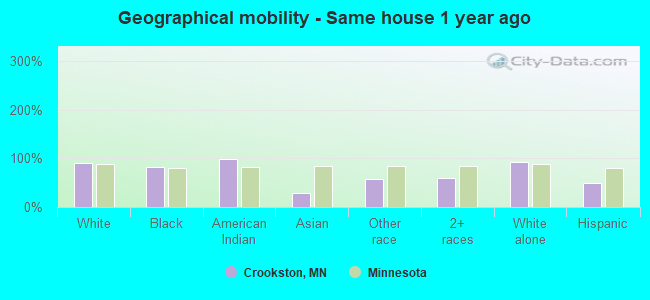
Geographical mobility - Same house 1 year ago (%)
Geographical mobility - Same house 1 year ago (%) - White
Geographical mobility - Same house 1 year ago (%) - Black or African American
Geographical mobility - Same house 1 year ago (%) - Asian
Geographical mobility - Same house 1 year ago (%) - Hispanic or Latino
Geographical mobility - Same house 1 year ago (%) - American Indian and Alaska Native
Geographical mobility - Same house 1 year ago (%) - Multirace
Geographical mobility - Same house 1 year ago (%) - Other Race
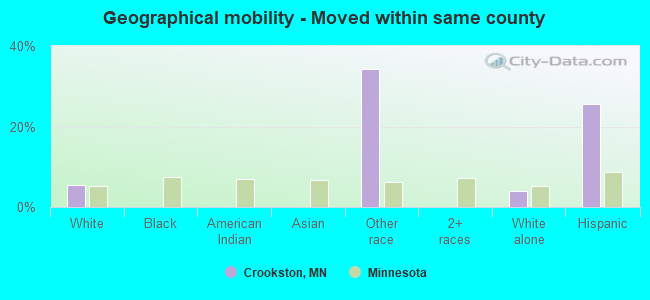
Geographical mobility - Moved within same county (%)
Geographical mobility - Moved within same county (%) - White
Geographical mobility - Moved within same county (%) - Black or African American
Geographical mobility - Moved within same county (%) - Asian
Geographical mobility - Moved within same county (%) - Hispanic or Latino
Geographical mobility - Moved within same county (%) - American Indian and Alaska Native
Geographical mobility - Moved within same county (%) - Multirace
Geographical mobility - Moved within same county (%) - Other Race
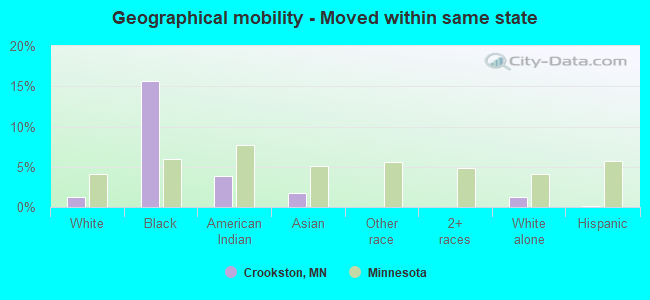
Geographical mobility - Moved from different county within same state (%)
Geographical mobility - Moved from different county within same state (%) - White
Geographical mobility - Moved from different county within same state (%) - Black or African American
Geographical mobility - Moved from different county within same state (%) - Asian
Geographical mobility - Moved from different county within same state (%) - Hispanic or Latino
Geographical mobility - Moved from different county within same state (%) - American Indian and Alaska Native
Geographical mobility - Moved from different county within same state (%) - Multirace
Geographical mobility - Moved from different county within same state (%) - Other Race
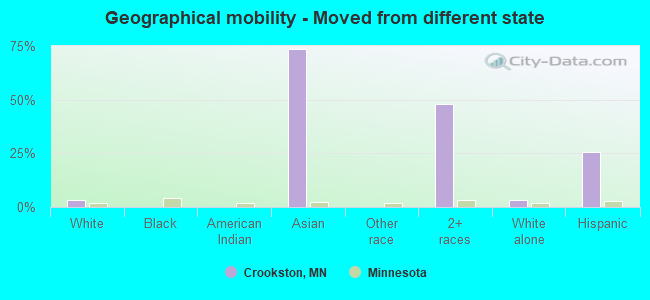
Geographical mobility - Moved from different state (%)
Geographical mobility - Moved from different state (%) - White
Geographical mobility - Moved from different state (%) - Black or African American
Geographical mobility - Moved from different state (%) - Asian
Geographical mobility - Moved from different state (%) - Hispanic or Latino
Geographical mobility - Moved from different state (%) - American Indian and Alaska Native
Geographical mobility - Moved from different state (%) - Multirace
Geographical mobility - Moved from different state (%) - Other Race
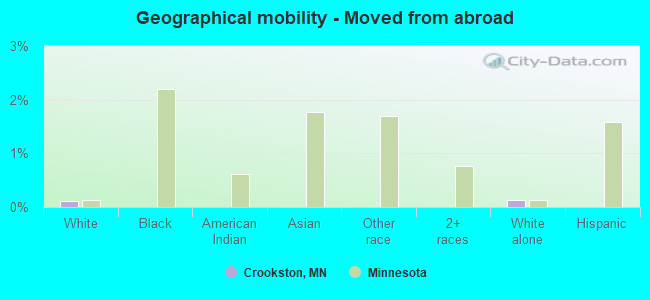
Geographical mobility - Moved from abroad (%)
Geographical mobility - Moved from abroad (%) - White
Geographical mobility - Moved from abroad (%) - Black or African American
Geographical mobility - Moved from abroad (%) - Asian
Geographical mobility - Moved from abroad (%) - Hispanic or Latino
Geographical mobility - Moved from abroad (%) - American Indian and Alaska Native
Geographical mobility - Moved from abroad (%) - Multirace
Geographical mobility - Moved from abroad (%) - Other Race
Place of birth for the foreign-born population - Ireland (%)
Place of birth for the foreign-born population - Denmark (%)
Place of birth for the foreign-born population - Norway (%)
Place of birth for the foreign-born population - Sweden (%)
Place of birth for the foreign-born population - United Kingdom (%)
Place of birth for the foreign-born population - England (%)
Place of birth for the foreign-born population - Scotland (%)
Place of birth for the foreign-born population - Other Northern Europe (%)
Place of birth for the foreign-born population - Austria (%)
Place of birth for the foreign-born population - Belgium (%)
Place of birth for the foreign-born population - France (%)
Place of birth for the foreign-born population - Germany (%)
Place of birth for the foreign-born population - Netherlands (%)
Place of birth for the foreign-born population - Switzerland (%)
Place of birth for the foreign-born population - Other Western Europe (%)
Place of birth for the foreign-born population - Greece (%)
Place of birth for the foreign-born population - Italy (%)
Place of birth for the foreign-born population - Portugal (%)
Place of birth for the foreign-born population - Spain (%)
Place of birth for the foreign-born population - Other Southern Europe (%)
Place of birth for the foreign-born population - Albania (%)
Place of birth for the foreign-born population - Belarus (%)
Place of birth for the foreign-born population - Bosnia and Herzegovina (%)
Place of birth for the foreign-born population - Bulgaria (%)
Place of birth for the foreign-born population - Croatia (%)
Place of birth for the foreign-born population - Czechoslovakia (%)
Place of birth for the foreign-born population - Hungary (%)
Place of birth for the foreign-born population - Latvia (%)
Place of birth for the foreign-born population - Lithuania (%)
Place of birth for the foreign-born population - North Macedonia (Macedonia) (%)
Place of birth for the foreign-born population - Moldova (%)
Place of birth for the foreign-born population - Poland (%)
Place of birth for the foreign-born population - Romania (%)
Place of birth for the foreign-born population - Russia (%)
Place of birth for the foreign-born population - Serbia (%)
Place of birth for the foreign-born population - Ukraine (%)
Place of birth for the foreign-born population - Other Eastern Europe (%)
Place of birth for the foreign-born population - China (%)
Place of birth for the foreign-born population - Hong Kong (%)
Place of birth for the foreign-born population - Taiwan (%)
Place of birth for the foreign-born population - Japan (%)
Place of birth for the foreign-born population - Korea (%)
Place of birth for the foreign-born population - Other Eastern Asia (%)
Place of birth for the foreign-born population - Afghanistan (%)
Place of birth for the foreign-born population - Bangladesh (%)
Place of birth for the foreign-born population - India (%)
Place of birth for the foreign-born population - Iran (%)
Place of birth for the foreign-born population - Kazakhstan (%)
Place of birth for the foreign-born population - Nepal (%)
Place of birth for the foreign-born population - Pakistan (%)
Place of birth for the foreign-born population - Sri Lanka (%)
Place of birth for the foreign-born population - Uzbekistan (%)
Place of birth for the foreign-born population - Other South Central Asia (%)
Place of birth for the foreign-born population - Burma (%)
Place of birth for the foreign-born population - Cambodia (%)
Place of birth for the foreign-born population - Indonesia (%)
Place of birth for the foreign-born population - Laos (%)
Place of birth for the foreign-born population - Malaysia (%)
Place of birth for the foreign-born population - Philippines (%)
Place of birth for the foreign-born population - Singapore (%)
Place of birth for the foreign-born population - Thailand (%)
Place of birth for the foreign-born population - Vietnam (%)
Place of birth for the foreign-born population - Other South Eastern Asia (%)
Place of birth for the foreign-born population - Armenia (%)
Place of birth for the foreign-born population - Iraq (%)
Place of birth for the foreign-born population - Israel (%)
Place of birth for the foreign-born population - Jordan (%)
Place of birth for the foreign-born population - Kuwait (%)
Place of birth for the foreign-born population - Lebanon (%)
Place of birth for the foreign-born population - Saudi Arabia (%)
Place of birth for the foreign-born population - Syria (%)
Place of birth for the foreign-born population - Turkey (%)
Place of birth for the foreign-born population - Yemen (%)
Place of birth for the foreign-born population - Other Western Asia (%)
Place of birth for the foreign-born population - Eritrea (%)
Place of birth for the foreign-born population - Ethiopia (%)
Place of birth for the foreign-born population - Kenya (%)
Place of birth for the foreign-born population - Somalia (%)
Place of birth for the foreign-born population - Uganda (%)
Place of birth for the foreign-born population - Zimbabwe (%)
Place of birth for the foreign-born population - Other Eastern Africa (%)
Place of birth for the foreign-born population - Cameroon (%)
Place of birth for the foreign-born population - Congo (%)
Place of birth for the foreign-born population - Democratic Republic of Congo (Zaire) (%)
Place of birth for the foreign-born population - Other Middle Africa (%)
Place of birth for the foreign-born population - Egypt (%)
Place of birth for the foreign-born population - Morocco (%)
Place of birth for the foreign-born population - Sudan (%)
Place of birth for the foreign-born population - Other Northern Africa (%)
Place of birth for the foreign-born population - South Africa (%)
Place of birth for the foreign-born population - Other Southern Africa (%)
Place of birth for the foreign-born population - Cabo Verde (%)
Place of birth for the foreign-born population - Ghana (%)
Place of birth for the foreign-born population - Liberia (%)
Place of birth for the foreign-born population - Nigeria (%)
Place of birth for the foreign-born population - Senegal (%)
Place of birth for the foreign-born population - Sierra Leone (%)
Place of birth for the foreign-born population - Other Western Africa (%)
Place of birth for the foreign-born population - Australia (%)
Place of birth for the foreign-born population - New Zealand (%)
Place of birth for the foreign-born population - Fiji (%)
Place of birth for the foreign-born population - Micronesia (%)
Place of birth for the foreign-born population - Bahamas (%)
Place of birth for the foreign-born population - Barbados (%)
Place of birth for the foreign-born population - Cuba (%)
Place of birth for the foreign-born population - Dominica (%)
Place of birth for the foreign-born population - Dominican Republic (%)
Place of birth for the foreign-born population - Grenada (%)
Place of birth for the foreign-born population - Haiti (%)
Place of birth for the foreign-born population - Jamaica (%)
Place of birth for the foreign-born population - St. Vincent and the Grenadines (%)
Place of birth for the foreign-born population - Trinidad and Tobago (%)
Place of birth for the foreign-born population - West Indies (%)
Place of birth for the foreign-born population - Other Caribbean (%)
Place of birth for the foreign-born population - Belize (%)
Place of birth for the foreign-born population - Costa Rica (%)
Place of birth for the foreign-born population - El Salvador (%)
Place of birth for the foreign-born population - Guatemala (%)
Place of birth for the foreign-born population - Honduras (%)
Place of birth for the foreign-born population - Mexico (%)
Place of birth for the foreign-born population - Nicaragua (%)
Place of birth for the foreign-born population - Panama (%)
Place of birth for the foreign-born population - Other Central America (%)
Place of birth for the foreign-born population - Argentina (%)
Place of birth for the foreign-born population - Bolivia (%)
Place of birth for the foreign-born population - Brazil (%)
Place of birth for the foreign-born population - Chile (%)
Place of birth for the foreign-born population - Colombia (%)
Place of birth for the foreign-born population - Ecuador (%)
Place of birth for the foreign-born population - Guyana (%)
Place of birth for the foreign-born population - Peru (%)
Place of birth for the foreign-born population - Uruguay (%)
Place of birth for the foreign-born population - Venezuela (%)
Place of birth for the foreign-born population - Other South America (%)
Place of birth for the foreign-born population - Canada (%)
Place of birth for the foreign-born population - Other Northern America (%)
Place of birth for the foreign-born population - Other (%)
Latest news about races in Crookston, MN collected exclusively by city-data.com from local newspapers, TV, and radio stations
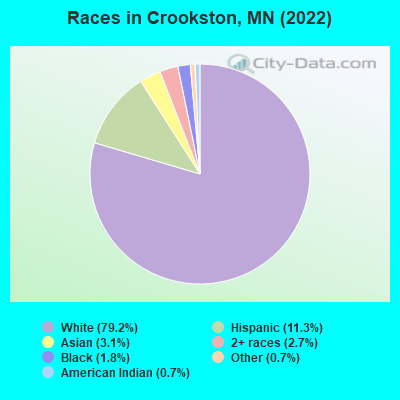
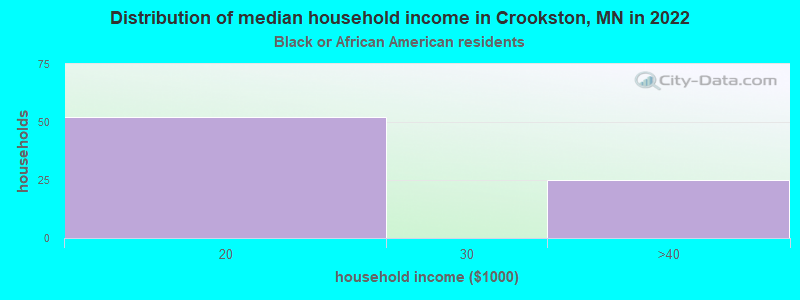
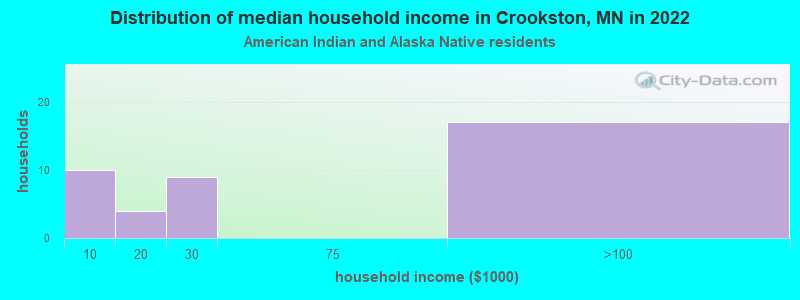
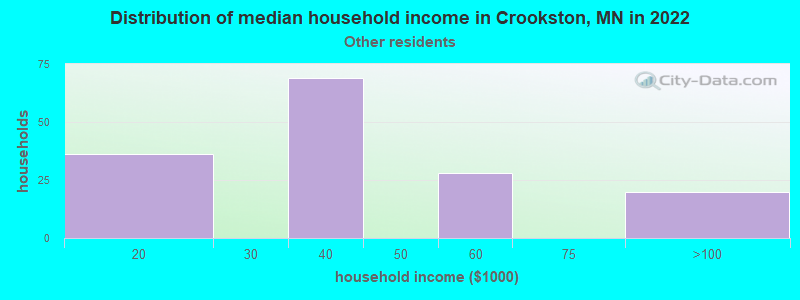
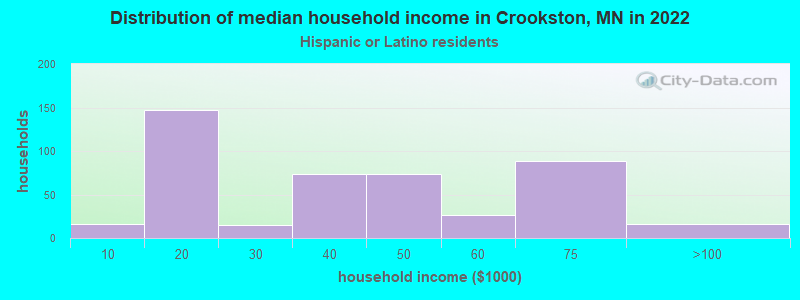
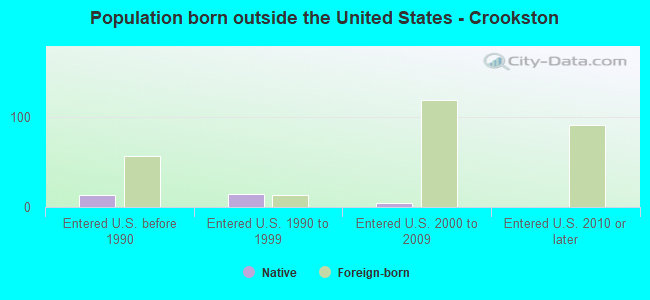
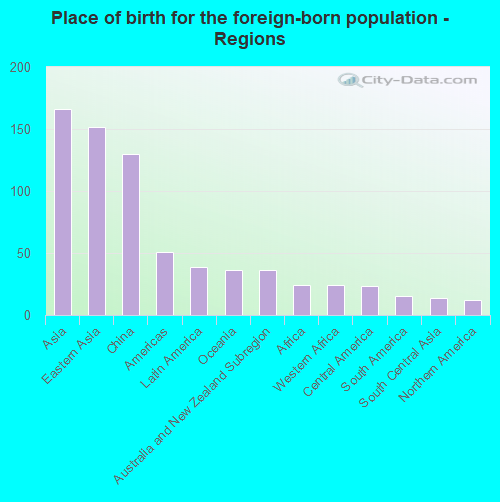
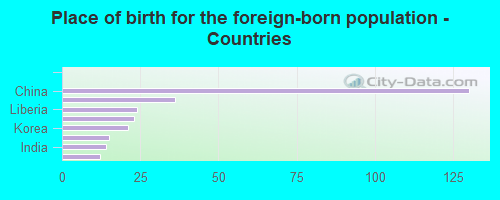
According to 2022 data, the most numerous races in Crookston, MN are White alone (5,940 residents), Black alone (132 residents), and Hispanic (846 residents). 92.4% of Crookston residents speak English at home. 3.7% of Crookston, MN residents are foreign-born (2.1% born in Asia, 0.5% born in Latin America, 0.5% born in Oceania), which is 115.1% less than the foreign-born rate of 8.0% across the entire state of Minnesota.
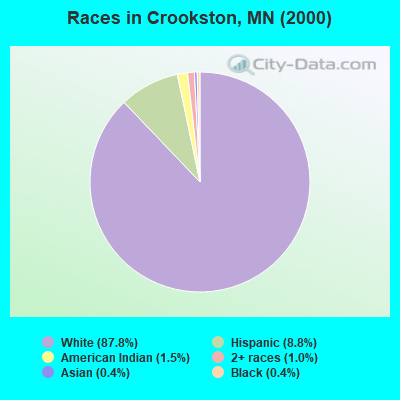
Race distribution in Crookston
2000 2022
4,337,143 88.2% White alone 168,813 3.4% Black alone 143,382 2.9% Hispanic 141,083 2.9% Asian alone 70,304 1.4% Two or more races 52,009 1.1% American Indian alone 5,031 0.1% Other race alone 1,714 0.03% Native Hawaiian and Other
4,356,347 76.2% White alone 395,179 6.9% Black alone 333,830 5.8% Hispanic 294,800 5.2% Asian alone 259,649 4.5% Two or more races 42,125 0.7% American Indian alone 32,976 0.6% Other race alone 2,278 0.04% Native Hawaiian and Other
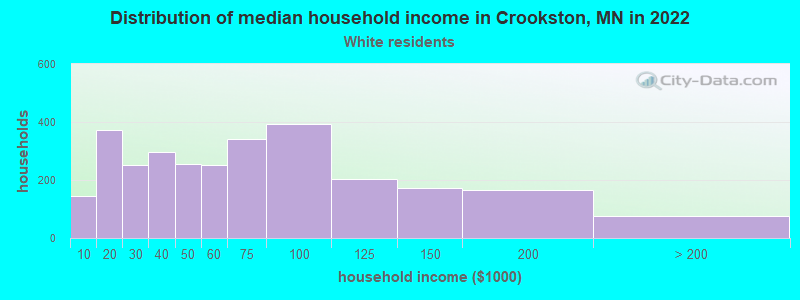
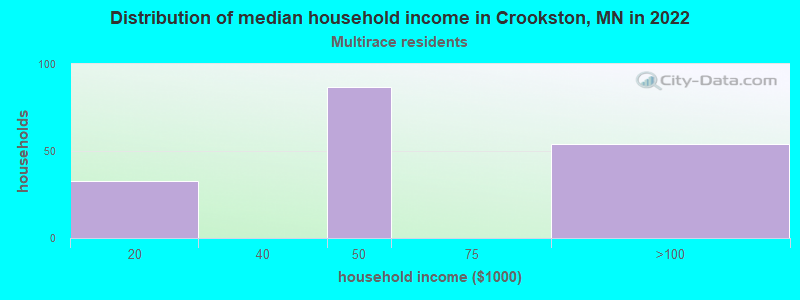
Income and house value in Crookston Median household income in 2022 $53,245 White non-Hispanic householders$36,441 Some other race householders$45,439 Two or more races householders$34,371 Hispanic or Latino race householdersMedian 2022 house value $183,169 White Non-Hispanic householders $923,724 Asian householders$54,834 Some other race householders$247,921 Two or more races householders$106,460 Hispanic or Latino householders
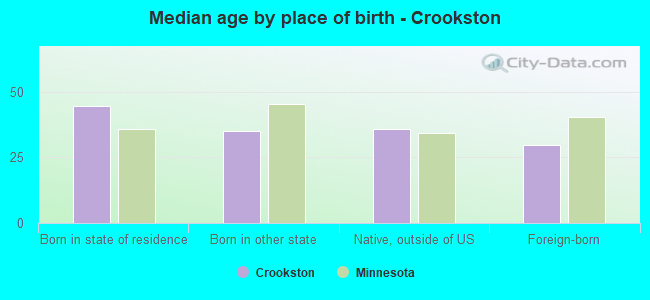
Median age by race in Crookston
44.1 Median age for White residents41.5 46.4 66.9 Median age for Black or African American residents67.3 -673,784,103.7 34.4 Median age for American Indian / Alaska Native residents26.5 34.8 26.3 Median age for Asian residents23.6 26.2 -744,336,568.8 Median age for Native Hawaiian / Pacific Islander residents-856,799,036.4 -534,959,349.1 32.6 Median age for Other race residents32.4 31.6 18.7 Median age for Two or more races residents20.3 10.3 44.8 Median age for White alone residents43.0 48.4 30.6 Median age for Hispanic or Latino residents30.4 28.9
Owner/renter occupied households by race in Crookston
House owners and renters - White residents 1,784 61.8% Owner occupied1,102 38.2% Renter occupiedHouse owners and renters - Black or African American residents 95 100.0% Renter occupiedHouse owners and renters - American Indian / Alaska Native residents 3 40.4% Owner occupied5 59.6% Renter occupiedHouse owners and renters - Asian residents 75 100.0% Renter occupiedHouse owners and renters - Other race residents 28 15.0% Owner occupied156 85.0% Renter occupiedHouse owners and renters - Two or more races residents 69 39.4% Owner occupied107 60.6% Renter occupiedHouse owners and renters - White alone residents 1,703 63.0% Owner occupied1,000 37.0% Renter occupiedHouse owners and renters - Hispanic or Latino residents 138 31.2% Owner occupied303 68.8% Renter occupied
Language usage in Crookston
English speakers - Total 92.4% of residents of Crookston speak English at home.
4.6% of residents speak Spanish at home 269 82.5% Speak English very well57 17.5% Speak English less than very well2.6% of residents speak other language at home 8 4.4% Speak English very well175 95.6% Speak English less than very well
English speakers - Born in the United States 89.4% of residents of Crookston speak English at home.
10.0% of residents speak Spanish at home 217 92.7% Speak English very well17 7.3% Speak English less than very well
English speakers - Native, born elsewhere 94.1% of residents of Crookston speak English at home.
English speakers - Foreign-born 49.8% of residents of Crookston speak English at home.
8.6% of residents speak Spanish at home 24 100.0% Speak English less than very well41.9% of residents speak other language at home 5 4.3% Speak English very well112 95.7% Speak English less than very well
White (Caucasian) - Speak only English Native:
98.6% (5,804)Foreign-born:
100.0% (36)
White (Caucasian) - Speak another language Native:
1.5% (91)Foreign-born:
9.3% (3)
Black or African American - Speak only English Native:
97.2% (100)Foreign-born:
92.3% (24)
American Indian / Alaska Native - Speak only English Native:
100.0% (52)Foreign-born:
62.1% (4)
Asian - Speak only English Native:
82.8% (15)Foreign-born:
30.3% (48)
Asian - Speak another language Native:
22.2% (4)Foreign-born:
69.1% (109)
Other race - Speak only English Native:
35.8% (64)Foreign-born:
46.4% (22)
Other race - Speak another language Native:
62.2% (110)Foreign-born:
59.0% (28)
White alone - Speak only English Native:
98.8% (5,532)Foreign-born:
94.8% (43)
White alone - Speak another language Native:
1.2% (68)Foreign-born:
10.2% (5)
Hispanic or Latino - Speak only English Native:
59.0% (430)Foreign-born:
50.0% (19)
Hispanic or Latino - Speak another language Native:
41.1% (300)Foreign-born:
58.6% (23)
Foreign-born residents in Crookston 279 residents are foreign born (2.1% Asia , 0.5% Latin America , 0.5% Oceania ).
This city:
3.7%Minnesota:
8.5%
Marital status for residents in Crookston Marital status - White (Caucasian) population 15 years and over
Males 37.0% Never married47.5% Now married0.6% Separated2.2% Widowed12.8% DivorcedFemales 28.2% Never married44.8% Now married1.5% Separated14.8% Widowed10.7% DivorcedWomen who gave birth in the past 12 months Now married:
100.0% (23)Unmarried:
0.0% (0)
Women who did not give birth in the past 12 months Now married:
42.7% (589)Unmarried:
57.3% (790)
Marital status - Black or African American population 15 years and over
Males 22.1% Never married0.0% Now married21.2% Separated0.0% Widowed56.6% DivorcedFemales 100.0% Never married0.0% Now married0.0% Separated0.0% Widowed0.0% DivorcedWomen who did not give birth in the past 12 months Now married:
0.0% (0)Unmarried:
100.0% (13)
Marital status - American Indian / Alaska Native population 15 years and over
Males 100.0% Never married0.0% Now married0.0% Separated0.0% Widowed0.0% DivorcedFemales 81.5% Never married0.0% Now married0.0% Separated0.0% Widowed18.5% DivorcedWomen who did not give birth in the past 12 months Now married:
0.0% (0)Unmarried:
100.0% (20)
Marital status - Asian population 15 years and over
Males 35.4% Never married64.6% Now married0.0% Separated0.0% Widowed0.0% DivorcedFemales 2.8% Never married97.2% Now married0.0% Separated0.0% Widowed0.0% DivorcedWomen who did not give birth in the past 12 months Now married:
97.2% (72)Unmarried:
2.8% (2)
Marital status - Other race population 15 years and over
Males 72.4% Never married0.0% Now married0.0% Separated0.0% Widowed27.6% DivorcedFemales 31.0% Never married35.7% Now married0.0% Separated33.3% Widowed0.0% DivorcedWomen who gave birth in the past 12 months Now married:
100.0% (20)Unmarried:
0.0% (0)
Women who did not give birth in the past 12 months Now married:
0.0% (0)Unmarried:
100.0% (17)
Marital status - Two or more races population 15 years and over
Males 70.3% Never married23.0% Now married0.0% Separated6.7% Widowed0.0% DivorcedFemales 54.9% Never married15.8% Now married0.0% Separated0.0% Widowed29.3% DivorcedWomen who gave birth in the past 12 months Now married:
0.0% (0)Unmarried:
100.0% (60)
Women who did not give birth in the past 12 months Now married:
43.8% (27)Unmarried:
56.2% (35)
Marital status - White alone, not Hispanic / Latino population 15 years and over
Males 35.5% Never married49.2% Now married0.0% Separated2.3% Widowed13.0% DivorcedFemales 29.4% Never married43.0% Now married1.6% Separated14.7% Widowed11.3% DivorcedWomen who gave birth in the past 12 months Now married:
100.0% (24)Unmarried:
0.0% (0)
Women who did not give birth in the past 12 months Now married:
38.0% (485)Unmarried:
62.0% (792)
Marital status - Hispanic or Latino population 15 years and over
Males 73.9% Never married17.9% Now married4.1% Separated0.0% Widowed4.1% DivorcedFemales 26.2% Never married50.0% Now married0.0% Separated15.4% Widowed8.5% DivorcedWomen who gave birth in the past 12 months Now married:
24.6% (16)Unmarried:
75.4% (49)
Women who did not give birth in the past 12 months Now married:
83.9% (123)Unmarried:
16.1% (23)
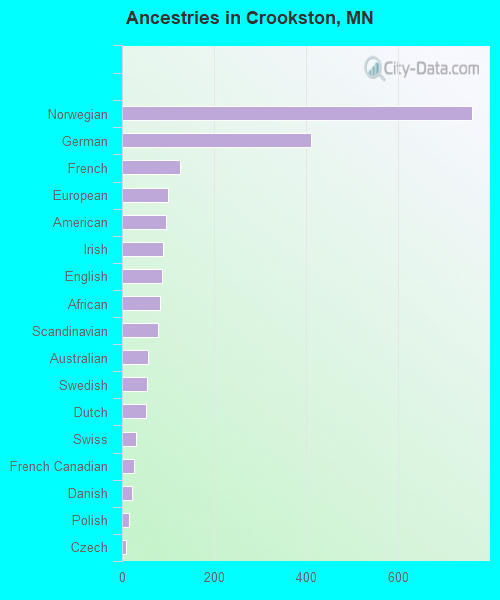
Ancestries in Crookston
760 27.2% Norwegian412 14.7% German126 4.5% French99 3.5% European96 3.4% American89 3.2% Irish87 3.1% English82 2.9% African79 2.8% Scandinavian56 2.0% Australian54 1.9% Swedish53 1.9% Dutch31 1.1% Swiss27 1.0% French Canadian21 0.8% Danish15 0.5% Polish8 0.3% Czech6 0.2% Italian
Children Nativity (place of birth) in Crookston
Children under 6 years - Living with two parents Both parents native 344 100.0% NativeBoth parents foreign-born 65 100.0% NativeChildren under 6 years - Living with one parent Native parent 107 100.0% NativeChildren 6 to 17 years - Living with two parents Both parents native 313 94.1% Native20 5.9% Foreign-bornChildren 6 to 17 years - Living with one parent Native parent 503 100.0% Native
Grandparents responsible for own grandchildren in Crookston
Grandparents (30 to 59 years) White / Caucasian 18 100.0% Not responsible for grandchildrenWhite alone, not Hispanic / Latino 19 100.0% Not responsible for grandchildrenGrandparents (60 years and over) White / Caucasian 26 32.2% Responsible for grandchildren56 67.8% Not responsible for grandchildrenWhite alone, not Hispanic / Latino 27 32.4% Responsible for grandchildren57 67.6% Not responsible for grandchildren