Races in Crestwood, Illinois (IL) Detailed Stats
Data:
Races - White alone (%)
Races - White alone (% change since 2000)
Races - Black alone (%)
Races - Black alone (% change since 2000)
Races - American Indian alone (%)
Races - American Indian alone (% change since 2000)
Races - Asian alone (%)
Races - Asian alone (% change since 2000)
Races - Hispanic (%)
Races - Hispanic (% change since 2000)
Races - Native Hawaiian and Other Pacific Islander alone (%)
Races - Native Hawaiian and Other Pacific Islander alone (% change since 2000)
Races - Two or more races(%)
Races - Two or more races(% change since 2000)
Races - Other race alone (%)
Races - Other race alone (% change since 2000)
Racial diversity
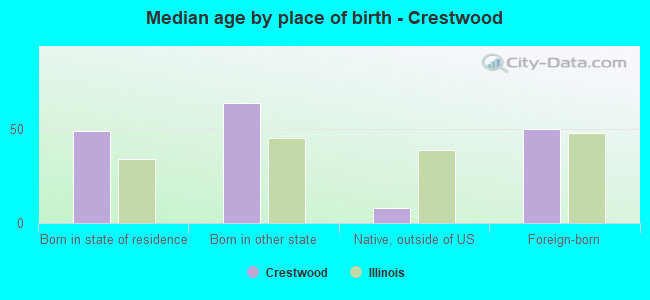
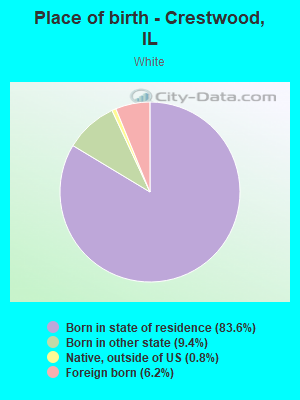
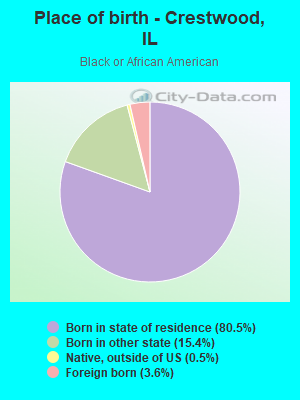
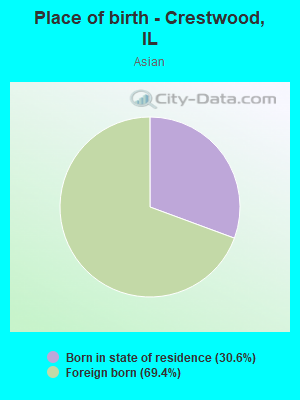
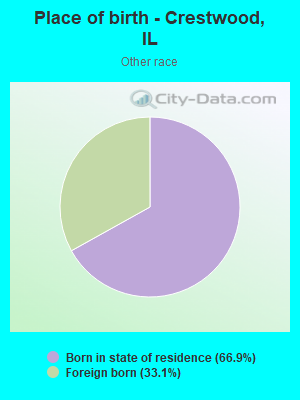
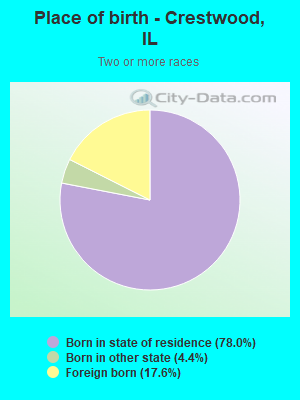
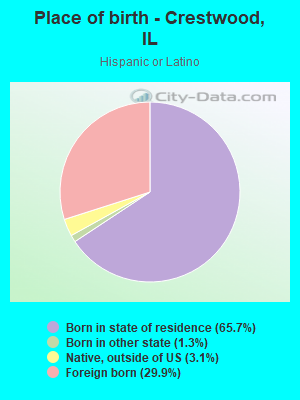
Place of birth - Born in state of residence (%)
Place of birth - Born in state of residence (%) - White
Place of birth - Born in state of residence (%) - Black or African American
Place of birth - Born in state of residence (%) - Asian
Place of birth - Born in state of residence (%) - Hispanic or Latino
Place of birth - Born in state of residence (%) - American Indian and Alaska Native
Place of birth - Born in state of residence (%) - Multirace
Place of birth - Born in state of residence (%) - Other Race
Place of birth - Born in other state (%)
Place of birth - Born in other state (%) - White
Place of birth - Born in other state (%) - Black or African American
Place of birth - Born in other state (%) - Asian
Place of birth - Born in other state (%) - Hispanic or Latino
Place of birth - Born in other state (%) - American Indian and Alaska Native
Place of birth - Born in other state (%) - Multirace
Place of birth - Born in other state (%) - Other Race
Place of birth - Native, outside of US (%)
Place of birth - Native, outside of US (%) - White
Place of birth - Native, outside of US (%) - Black or African American
Place of birth - Native, outside of US (%) - Asian
Place of birth - Native, outside of US (%) - Hispanic or Latino
Place of birth - Native, outside of US (%) - American Indian and Alaska Native
Place of birth - Native, outside of US (%) - Multirace
Place of birth - Native, outside of US (%) - Other Race
Place of birth - Foreign born (%)
Place of birth - Foreign born (%) - White
Place of birth - Foreign born (%) - Black or African American
Place of birth - Foreign born (%) - Asian
Place of birth - Foreign born (%) - Hispanic or Latino
Place of birth - Foreign born (%) - American Indian and Alaska Native
Place of birth - Foreign born (%) - Multirace
Place of birth - Foreign born (%) - Other Race
Residents speaking English at home (%)
Residents speaking English at home - Born in the United States (%)
Residents speaking English at home - Native, born elsewhere (%)
Residents speaking English at home - Foreign born (%)
Residents speaking Spanish at home (%)
Residents speaking Spanish at home - Born in the United States (%)
Residents speaking Spanish at home - Native, born elsewhere (%)
Residents speaking Spanish at home - Foreign born (%)
Residents speaking other language at home (%)
Residents speaking other language at home - Born in the United States (%)
Residents speaking other language at home - Native, born elsewhere (%)
Residents speaking other language at home - Foreign born (%)
Marital status - Never married (%)
Marital status - Now married (%)
Marital status - Separated (%)
Marital status - Widowed (%)
Marital status - Divorced (%)
Ancestries Reported - Arab (%)
Ancestries Reported - Czech (%)
Ancestries Reported - Danish (%)
Ancestries Reported - Dutch (%)
Ancestries Reported - English (%)
Ancestries Reported - French (%)
Ancestries Reported - French Canadian (%)
Ancestries Reported - German (%)
Ancestries Reported - Greek (%)
Ancestries Reported - Hungarian (%)
Ancestries Reported - Irish (%)
Ancestries Reported - Italian (%)
Ancestries Reported - Lithuanian (%)
Ancestries Reported - Norwegian (%)
Ancestries Reported - Polish (%)
Ancestries Reported - Portuguese (%)
Ancestries Reported - Russian (%)
Ancestries Reported - Scotch-Irish (%)
Ancestries Reported - Scottish (%)
Ancestries Reported - Slovak (%)
Ancestries Reported - Subsaharan African (%)
Ancestries Reported - Swedish (%)
Ancestries Reported - Swiss (%)
Ancestries Reported - Ukrainian (%)
Ancestries Reported - United States (%)
Ancestries Reported - Welsh (%)
Ancestries Reported - West Indian (%)
Ancestries Reported - Other (%)
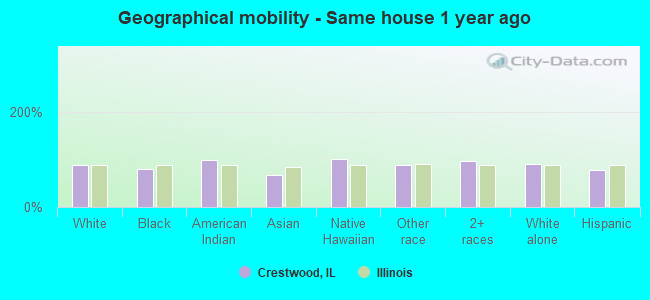
Geographical mobility - Same house 1 year ago (%)
Geographical mobility - Same house 1 year ago (%) - White
Geographical mobility - Same house 1 year ago (%) - Black or African American
Geographical mobility - Same house 1 year ago (%) - Asian
Geographical mobility - Same house 1 year ago (%) - Hispanic or Latino
Geographical mobility - Same house 1 year ago (%) - American Indian and Alaska Native
Geographical mobility - Same house 1 year ago (%) - Multirace
Geographical mobility - Same house 1 year ago (%) - Other Race
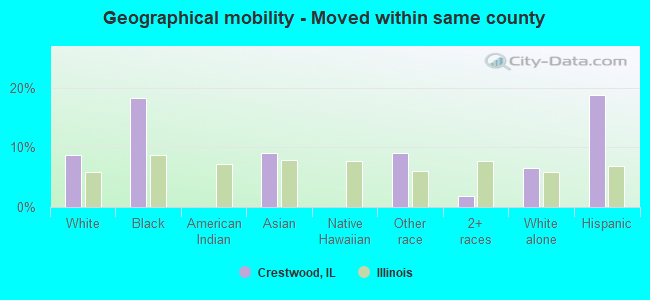
Geographical mobility - Moved within same county (%)
Geographical mobility - Moved within same county (%) - White
Geographical mobility - Moved within same county (%) - Black or African American
Geographical mobility - Moved within same county (%) - Asian
Geographical mobility - Moved within same county (%) - Hispanic or Latino
Geographical mobility - Moved within same county (%) - American Indian and Alaska Native
Geographical mobility - Moved within same county (%) - Multirace
Geographical mobility - Moved within same county (%) - Other Race
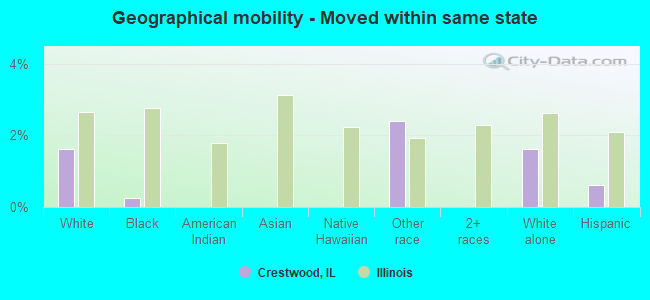
Geographical mobility - Moved from different county within same state (%)
Geographical mobility - Moved from different county within same state (%) - White
Geographical mobility - Moved from different county within same state (%) - Black or African American
Geographical mobility - Moved from different county within same state (%) - Asian
Geographical mobility - Moved from different county within same state (%) - Hispanic or Latino
Geographical mobility - Moved from different county within same state (%) - American Indian and Alaska Native
Geographical mobility - Moved from different county within same state (%) - Multirace
Geographical mobility - Moved from different county within same state (%) - Other Race
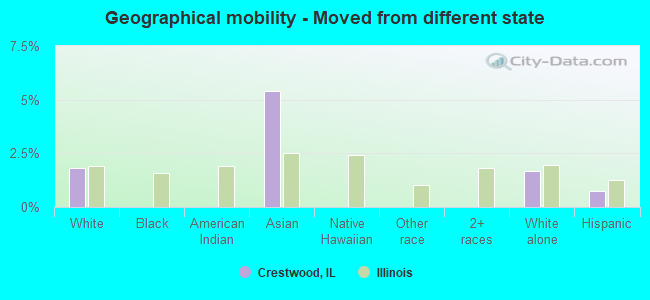
Geographical mobility - Moved from different state (%)
Geographical mobility - Moved from different state (%) - White
Geographical mobility - Moved from different state (%) - Black or African American
Geographical mobility - Moved from different state (%) - Asian
Geographical mobility - Moved from different state (%) - Hispanic or Latino
Geographical mobility - Moved from different state (%) - American Indian and Alaska Native
Geographical mobility - Moved from different state (%) - Multirace
Geographical mobility - Moved from different state (%) - Other Race
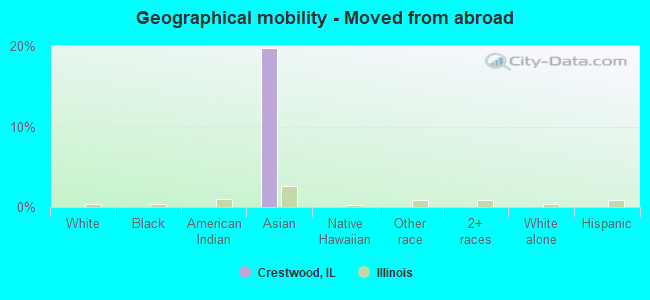
Geographical mobility - Moved from abroad (%)
Geographical mobility - Moved from abroad (%) - White
Geographical mobility - Moved from abroad (%) - Black or African American
Geographical mobility - Moved from abroad (%) - Asian
Geographical mobility - Moved from abroad (%) - Hispanic or Latino
Geographical mobility - Moved from abroad (%) - American Indian and Alaska Native
Geographical mobility - Moved from abroad (%) - Multirace
Geographical mobility - Moved from abroad (%) - Other Race
Place of birth for the foreign-born population - Ireland (%)
Place of birth for the foreign-born population - Denmark (%)
Place of birth for the foreign-born population - Norway (%)
Place of birth for the foreign-born population - Sweden (%)
Place of birth for the foreign-born population - United Kingdom (%)
Place of birth for the foreign-born population - England (%)
Place of birth for the foreign-born population - Scotland (%)
Place of birth for the foreign-born population - Other Northern Europe (%)
Place of birth for the foreign-born population - Austria (%)
Place of birth for the foreign-born population - Belgium (%)
Place of birth for the foreign-born population - France (%)
Place of birth for the foreign-born population - Germany (%)
Place of birth for the foreign-born population - Netherlands (%)
Place of birth for the foreign-born population - Switzerland (%)
Place of birth for the foreign-born population - Other Western Europe (%)
Place of birth for the foreign-born population - Greece (%)
Place of birth for the foreign-born population - Italy (%)
Place of birth for the foreign-born population - Portugal (%)
Place of birth for the foreign-born population - Spain (%)
Place of birth for the foreign-born population - Other Southern Europe (%)
Place of birth for the foreign-born population - Albania (%)
Place of birth for the foreign-born population - Belarus (%)
Place of birth for the foreign-born population - Bosnia and Herzegovina (%)
Place of birth for the foreign-born population - Bulgaria (%)
Place of birth for the foreign-born population - Croatia (%)
Place of birth for the foreign-born population - Czechoslovakia (%)
Place of birth for the foreign-born population - Hungary (%)
Place of birth for the foreign-born population - Latvia (%)
Place of birth for the foreign-born population - Lithuania (%)
Place of birth for the foreign-born population - North Macedonia (Macedonia) (%)
Place of birth for the foreign-born population - Moldova (%)
Place of birth for the foreign-born population - Poland (%)
Place of birth for the foreign-born population - Romania (%)
Place of birth for the foreign-born population - Russia (%)
Place of birth for the foreign-born population - Serbia (%)
Place of birth for the foreign-born population - Ukraine (%)
Place of birth for the foreign-born population - Other Eastern Europe (%)
Place of birth for the foreign-born population - China (%)
Place of birth for the foreign-born population - Hong Kong (%)
Place of birth for the foreign-born population - Taiwan (%)
Place of birth for the foreign-born population - Japan (%)
Place of birth for the foreign-born population - Korea (%)
Place of birth for the foreign-born population - Other Eastern Asia (%)
Place of birth for the foreign-born population - Afghanistan (%)
Place of birth for the foreign-born population - Bangladesh (%)
Place of birth for the foreign-born population - India (%)
Place of birth for the foreign-born population - Iran (%)
Place of birth for the foreign-born population - Kazakhstan (%)
Place of birth for the foreign-born population - Nepal (%)
Place of birth for the foreign-born population - Pakistan (%)
Place of birth for the foreign-born population - Sri Lanka (%)
Place of birth for the foreign-born population - Uzbekistan (%)
Place of birth for the foreign-born population - Other South Central Asia (%)
Place of birth for the foreign-born population - Burma (%)
Place of birth for the foreign-born population - Cambodia (%)
Place of birth for the foreign-born population - Indonesia (%)
Place of birth for the foreign-born population - Laos (%)
Place of birth for the foreign-born population - Malaysia (%)
Place of birth for the foreign-born population - Philippines (%)
Place of birth for the foreign-born population - Singapore (%)
Place of birth for the foreign-born population - Thailand (%)
Place of birth for the foreign-born population - Vietnam (%)
Place of birth for the foreign-born population - Other South Eastern Asia (%)
Place of birth for the foreign-born population - Armenia (%)
Place of birth for the foreign-born population - Iraq (%)
Place of birth for the foreign-born population - Israel (%)
Place of birth for the foreign-born population - Jordan (%)
Place of birth for the foreign-born population - Kuwait (%)
Place of birth for the foreign-born population - Lebanon (%)
Place of birth for the foreign-born population - Saudi Arabia (%)
Place of birth for the foreign-born population - Syria (%)
Place of birth for the foreign-born population - Turkey (%)
Place of birth for the foreign-born population - Yemen (%)
Place of birth for the foreign-born population - Other Western Asia (%)
Place of birth for the foreign-born population - Eritrea (%)
Place of birth for the foreign-born population - Ethiopia (%)
Place of birth for the foreign-born population - Kenya (%)
Place of birth for the foreign-born population - Somalia (%)
Place of birth for the foreign-born population - Uganda (%)
Place of birth for the foreign-born population - Zimbabwe (%)
Place of birth for the foreign-born population - Other Eastern Africa (%)
Place of birth for the foreign-born population - Cameroon (%)
Place of birth for the foreign-born population - Congo (%)
Place of birth for the foreign-born population - Democratic Republic of Congo (Zaire) (%)
Place of birth for the foreign-born population - Other Middle Africa (%)
Place of birth for the foreign-born population - Egypt (%)
Place of birth for the foreign-born population - Morocco (%)
Place of birth for the foreign-born population - Sudan (%)
Place of birth for the foreign-born population - Other Northern Africa (%)
Place of birth for the foreign-born population - South Africa (%)
Place of birth for the foreign-born population - Other Southern Africa (%)
Place of birth for the foreign-born population - Cabo Verde (%)
Place of birth for the foreign-born population - Ghana (%)
Place of birth for the foreign-born population - Liberia (%)
Place of birth for the foreign-born population - Nigeria (%)
Place of birth for the foreign-born population - Senegal (%)
Place of birth for the foreign-born population - Sierra Leone (%)
Place of birth for the foreign-born population - Other Western Africa (%)
Place of birth for the foreign-born population - Australia (%)
Place of birth for the foreign-born population - New Zealand (%)
Place of birth for the foreign-born population - Fiji (%)
Place of birth for the foreign-born population - Micronesia (%)
Place of birth for the foreign-born population - Bahamas (%)
Place of birth for the foreign-born population - Barbados (%)
Place of birth for the foreign-born population - Cuba (%)
Place of birth for the foreign-born population - Dominica (%)
Place of birth for the foreign-born population - Dominican Republic (%)
Place of birth for the foreign-born population - Grenada (%)
Place of birth for the foreign-born population - Haiti (%)
Place of birth for the foreign-born population - Jamaica (%)
Place of birth for the foreign-born population - St. Vincent and the Grenadines (%)
Place of birth for the foreign-born population - Trinidad and Tobago (%)
Place of birth for the foreign-born population - West Indies (%)
Place of birth for the foreign-born population - Other Caribbean (%)
Place of birth for the foreign-born population - Belize (%)
Place of birth for the foreign-born population - Costa Rica (%)
Place of birth for the foreign-born population - El Salvador (%)
Place of birth for the foreign-born population - Guatemala (%)
Place of birth for the foreign-born population - Honduras (%)
Place of birth for the foreign-born population - Mexico (%)
Place of birth for the foreign-born population - Nicaragua (%)
Place of birth for the foreign-born population - Panama (%)
Place of birth for the foreign-born population - Other Central America (%)
Place of birth for the foreign-born population - Argentina (%)
Place of birth for the foreign-born population - Bolivia (%)
Place of birth for the foreign-born population - Brazil (%)
Place of birth for the foreign-born population - Chile (%)
Place of birth for the foreign-born population - Colombia (%)
Place of birth for the foreign-born population - Ecuador (%)
Place of birth for the foreign-born population - Guyana (%)
Place of birth for the foreign-born population - Peru (%)
Place of birth for the foreign-born population - Uruguay (%)
Place of birth for the foreign-born population - Venezuela (%)
Place of birth for the foreign-born population - Other South America (%)
Place of birth for the foreign-born population - Canada (%)
Place of birth for the foreign-born population - Other Northern America (%)
Place of birth for the foreign-born population - Other (%)
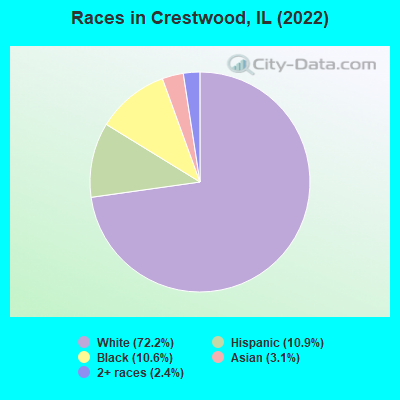
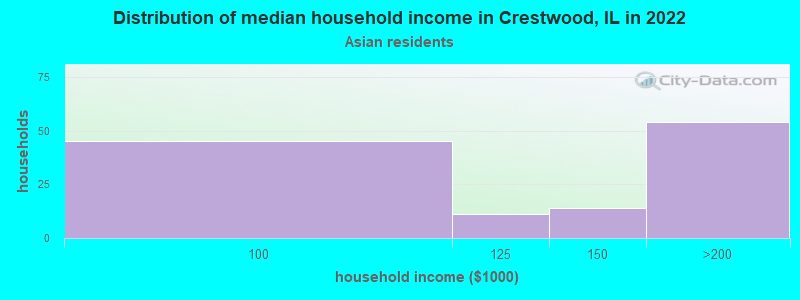
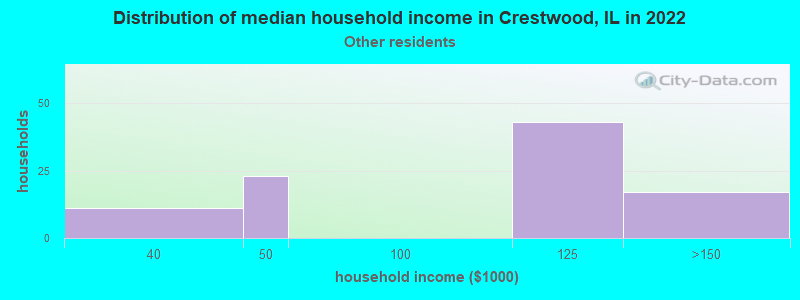
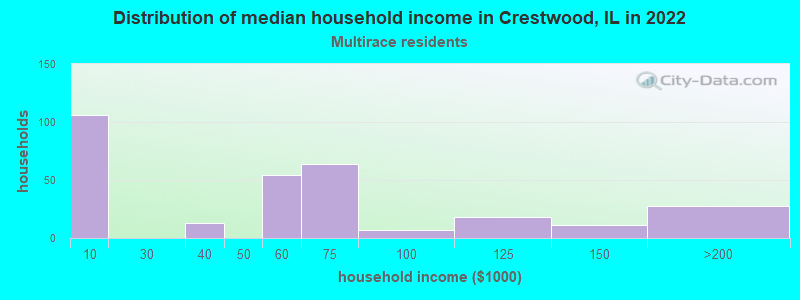
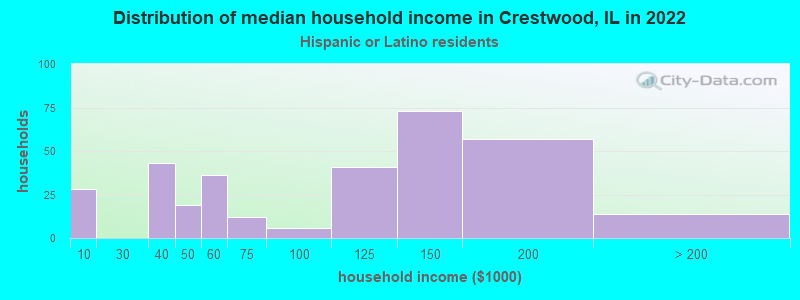
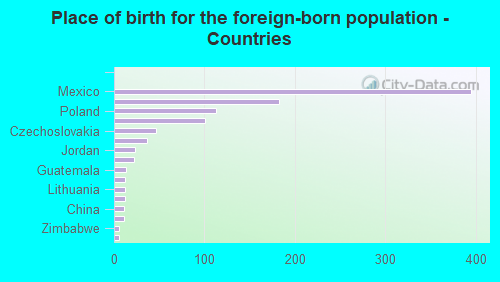
According to 2022 data, the most numerous races in Crestwood, IL are White alone (7,583 residents), Hispanic (1,145 residents), and Black alone (1,108 residents). 82.9% of Crestwood residents speak English at home. 10.2% of Crestwood, IL residents are foreign-born (3.8% born in Latin America, 3.0% born in Europe, 2.7% born in Asia), which is 37.0% less than the foreign-born rate of 14.0% across the entire state of Illinois.
Race distribution in Crestwood
2000 2022
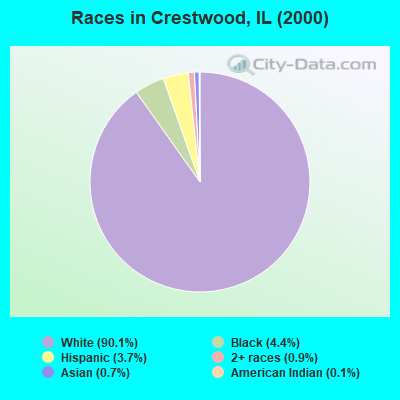
8,424,140 67.8% White alone 1,856,152 14.9% Black alone 1,530,262 12.3% Hispanic 419,916 3.4% Asian alone 153,996 1.2% Two or more races 13,479 0.1% Other race alone 18,232 0.1% American Indian alone 3,116 0.03% Native Hawaiian and Other
7,356,301 58.5% White alone 2,299,726 18.3% Hispanic 1,660,423 13.2% Black alone 747,296 5.9% Asian alone 458,599 3.6% Two or more races 45,386 0.4% Other race alone 10,405 0.08% American Indian alone 3,896 0.03% Native Hawaiian and Other
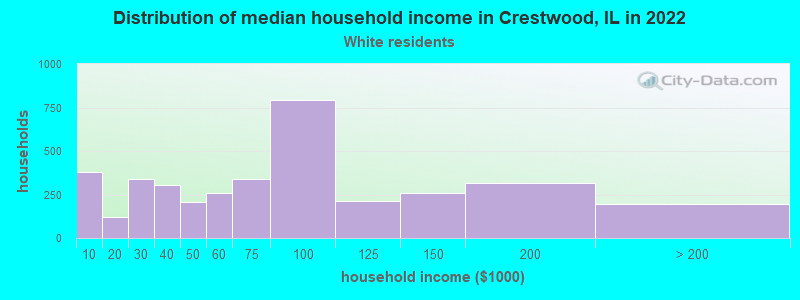
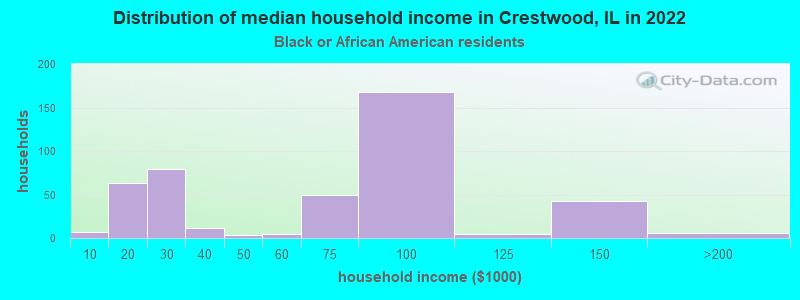
Income and house value in Crestwood Median household income in 2022 $67,446 White non-Hispanic householders$71,219 Black householders$133,352 Asian householders$105,751 Some other race householders$53,761 Two or more races householders$113,449 Hispanic or Latino race householdersMedian 2022 house value $232,472 White Non-Hispanic householders$101,007 Black or African American householders$291,367 Some other race householders$242,884 Hispanic or Latino householders
Median age by race in Crestwood
54.4 Median age for White residents48.9 59.5 43.5 Median age for Black or African American residents46.0 33.6 -680,473,372.1 Median age for American Indian / Alaska Native residents-736,736,736.0 -641,399,416.3 56.8 Median age for Asian residents38.7 62.3 -687,999,999.3 Median age for Native Hawaiian / Pacific Islander residents-918,721,460.3 -610,229,276.3 42.1 Median age for Other race residents18.4 48.8 51.9 Median age for Two or more races residents59.6 38.8 54.5 Median age for White alone residents51.1 58.3 34.7 Median age for Hispanic or Latino residents24.5 38.0
Owner/renter occupied households by race in Crestwood
House owners and renters - White residents 2,964 79.5% Owner occupied763 20.5% Renter occupiedHouse owners and renters - Black or African American residents 245 54.6% Owner occupied204 45.4% Renter occupiedHouse owners and renters - American Indian / Alaska Native residents 17 100.0% Owner occupiedHouse owners and renters - Asian residents 60 48.6% Owner occupied64 51.4% Renter occupiedHouse owners and renters - Native Hawaiian / Pacific Islander residents 21 100.0% Owner occupiedHouse owners and renters - Other race residents 72 80.7% Owner occupied17 19.3% Renter occupiedHouse owners and renters - Two or more races residents 149 51.4% Owner occupied141 48.6% Renter occupiedHouse owners and renters - White alone residents 3,078 80.3% Owner occupied753 19.7% Renter occupiedHouse owners and renters - Hispanic or Latino residents 219 68.1% Owner occupied103 31.9% Renter occupied
Language usage in Crestwood
English speakers - Total 82.9% of residents of Crestwood speak English at home.
7.9% of residents speak Spanish at home 610 76.0% Speak English very well193 24.0% Speak English less than very well8.6% of residents speak other language at home 582 66.8% Speak English very well289 33.2% Speak English less than very well
English speakers - Born in the United States 88.6% of residents of Crestwood speak English at home.
2.3% of residents speak Spanish at home 12 57.1% Speak English very well9 42.9% Speak English less than very well9.9% of residents speak other language at home 89 100.0% Speak English very well
English speakers - Native, born elsewhere 48.9% of residents of Crestwood speak English at home.
54.3% of residents speak other language at home 2 4.0% Speak English very well48 96.0% Speak English less than very well
English speakers - Foreign-born 12.7% of residents of Crestwood speak English at home.
36.3% of residents speak Spanish at home 232 59.5% Speak English very well158 40.5% Speak English less than very well50.5% of residents speak other language at home 332 61.3% Speak English very well210 38.7% Speak English less than very well
White (Caucasian) - Speak only English Native:
97.7% (6,471)Foreign-born:
22.1% (99)
White (Caucasian) - Speak another language Native:
4.9% (323)Foreign-born:
78.5% (352)
Black or African American - Speak another language Native:
3.9% (42)Foreign-born:
91.2% (36)
Asian - Speak another language Native:
26.4% (27)Foreign-born:
100.0% (225)
Other race - Speak another language Native:
43.0% (121)Foreign-born:
100.0% (139)
Two or more races - Speak another language Native:
22.0% (107)Foreign-born:
100.0% (108)
White alone - Speak only English Native:
94.5% (6,390)Foreign-born:
23.7% (109)
White alone - Speak another language Native:
5.3% (356)Foreign-born:
75.4% (348)
Hispanic or Latino - Speak only English Native:
59.8% (476)Foreign-born:
6.3% (22)
Hispanic or Latino - Speak another language Native:
41.9% (333)Foreign-born:
93.5% (319)
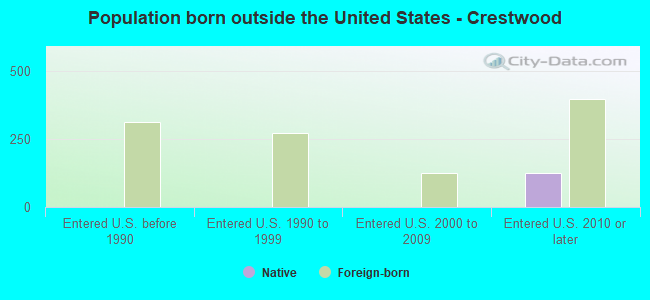
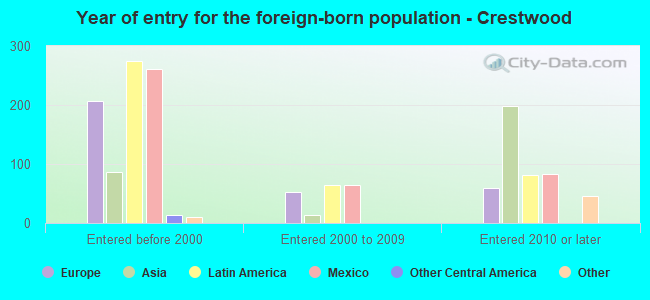
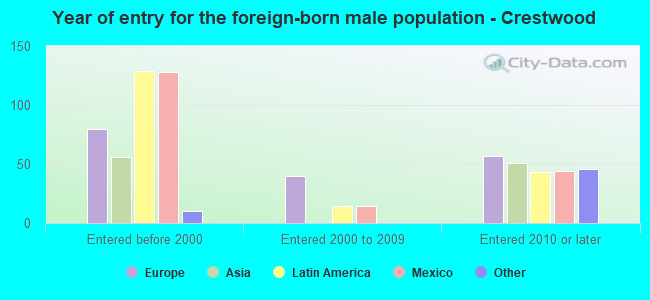
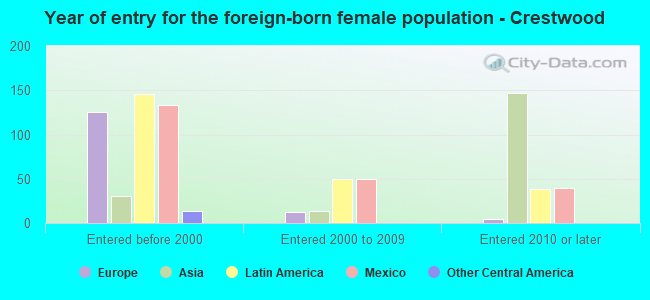
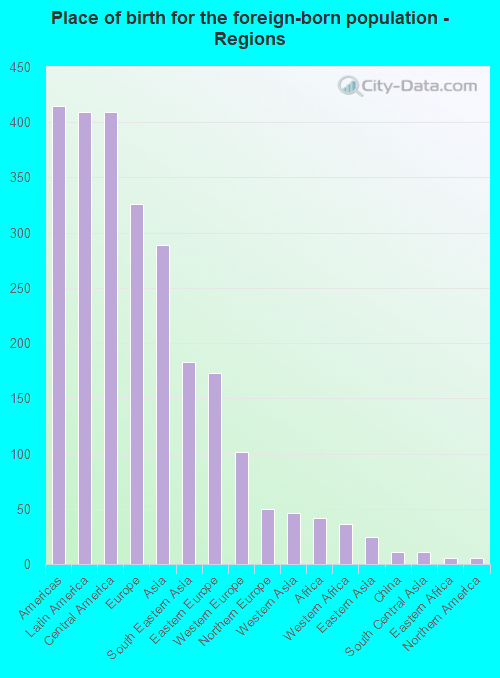
Foreign-born residents in Crestwood 1,073 residents are foreign born (3.8% Latin America , 3.0% Europe , 2.7% Asia ).
This city:
10.2%Illinois:
14.1%
Marital status for residents in Crestwood Marital status - White (Caucasian) population 15 years and over
Males 36.5% Never married41.9% Now married1.0% Separated4.7% Widowed16.0% DivorcedFemales 28.1% Never married37.2% Now married0.4% Separated17.7% Widowed16.6% DivorcedWomen who gave birth in the past 12 months Now married:
64.5% (42)Unmarried:
35.5% (23)
Women who did not give birth in the past 12 months Now married:
37.9% (440)Unmarried:
62.1% (722)
Marital status - Black or African American population 15 years and over
Males 54.4% Never married36.4% Now married0.6% Separated0.0% Widowed8.6% DivorcedFemales 53.1% Never married25.8% Now married0.4% Separated9.1% Widowed11.6% DivorcedWomen who did not give birth in the past 12 months Now married:
7.6% (21)Unmarried:
92.4% (253)
Marital status - Asian population 15 years and over
Males 55.2% Never married44.8% Now married0.0% Separated0.0% Widowed0.0% DivorcedFemales 15.4% Never married53.8% Now married20.5% Separated10.3% Widowed0.0% DivorcedWomen who did not give birth in the past 12 months Now married:
70.0% (28)Unmarried:
30.0% (12)
Marital status - Other race population 15 years and over
Males 78.2% Never married21.8% Now married0.0% Separated0.0% Widowed0.0% DivorcedFemales 42.6% Never married44.8% Now married3.6% Separated9.0% Widowed0.0% DivorcedWomen who did not give birth in the past 12 months Now married:
40.3% (72)Unmarried:
59.7% (107)
Marital status - Two or more races population 15 years and over
Males 32.4% Never married36.8% Now married0.0% Separated0.0% Widowed30.9% DivorcedFemales 74.9% Never married12.6% Now married0.0% Separated8.7% Widowed3.8% DivorcedWomen who did not give birth in the past 12 months Now married:
9.7% (17)Unmarried:
90.3% (155)
Marital status - White alone, not Hispanic / Latino population 15 years and over
Males 36.3% Never married42.1% Now married1.0% Separated5.0% Widowed15.6% DivorcedFemales 28.3% Never married36.0% Now married0.4% Separated18.0% Widowed17.3% DivorcedWomen who gave birth in the past 12 months Now married:
64.2% (41)Unmarried:
35.8% (23)
Women who did not give birth in the past 12 months Now married:
35.4% (426)Unmarried:
64.6% (778)
Marital status - Hispanic or Latino population 15 years and over
Males 54.6% Never married34.6% Now married0.0% Separated0.0% Widowed10.8% DivorcedFemales 45.9% Never married41.4% Now married1.5% Separated11.2% Widowed0.0% DivorcedWomen who gave birth in the past 12 months Now married:
66.7% (6)Unmarried:
33.3% (3)
Women who did not give birth in the past 12 months Now married:
37.5% (139)Unmarried:
62.5% (232)
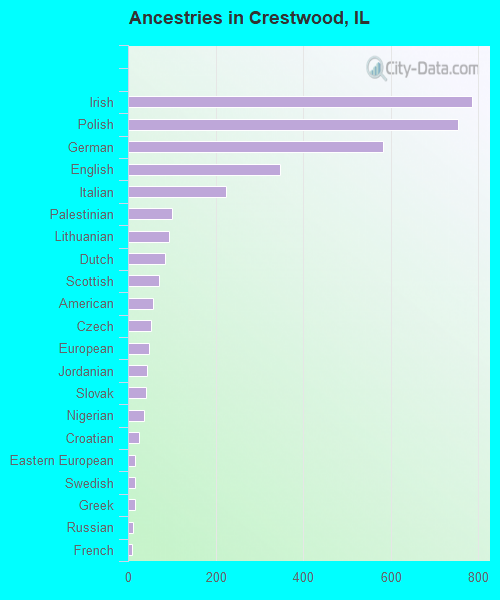
Ancestries in Crestwood
785 15.3% Irish753 14.7% Polish583 11.4% German348 6.8% English224 4.4% Italian101 2.0% Palestinian94 1.8% Lithuanian85 1.7% Dutch71 1.4% Scottish58 1.1% American53 1.0% Czech49 1.0% European44 0.9% Jordanian41 0.8% Slovak36 0.7% Nigerian26 0.5% Croatian16 0.3% Eastern European16 0.3% Swedish15 0.3% Greek12 0.2% Russian8 0.2% French6 0.1% Scotch-Irish5 0.10% African
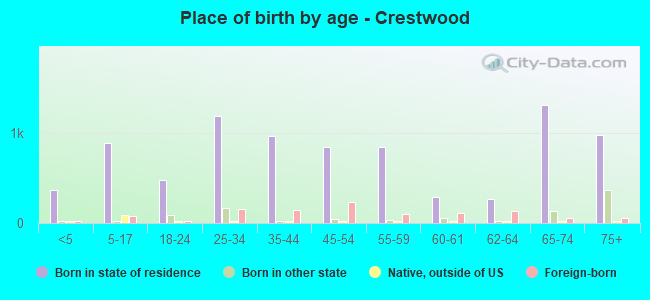
Children Nativity (place of birth) in Crestwood
Children under 6 years - Living with two parents Both parents native 104 100.0% NativeBoth parents foreign-born 4 24.9% Native13 75.1% Foreign-bornOne native, one foreign-born parent 73 100.0% NativeChildren under 6 years - Living with one parent Native parent 243 100.0% NativeChildren 6 to 17 years - Living with two parents Both parents native 212 100.0% NativeBoth parents foreign-born 57 81.1% Native13 18.9% Foreign-bornOne native, one foreign-born parent 180 100.0% NativeChildren 6 to 17 years - Living with one parent Native parent 457 93.8% Native30 6.2% Foreign-bornForeign-born parent 30 100.0% Native
Grandparents responsible for own grandchildren in Crestwood
Grandparents (30 to 59 years) White / Caucasian 3 26.3% Responsible for grandchildren9 73.7% Not responsible for grandchildrenTwo or more races 9 100.0% Not responsible for grandchildrenWhite alone, not Hispanic / Latino 2 21.7% Responsible for grandchildren8 78.3% Not responsible for grandchildrenHispanic or Latino 3 100.0% Responsible for grandchildrenGrandparents (60 years and over) White / Caucasian 11 8.6% Responsible for grandchildren112 91.4% Not responsible for grandchildrenWhite alone, not Hispanic / Latino 124 100.0% Not responsible for grandchildrenHispanic or Latino 18 54.2% Responsible for grandchildren15 45.8% Not responsible for grandchildren