Races in Crawfordsville, Indiana (IN) Detailed Stats
Data:
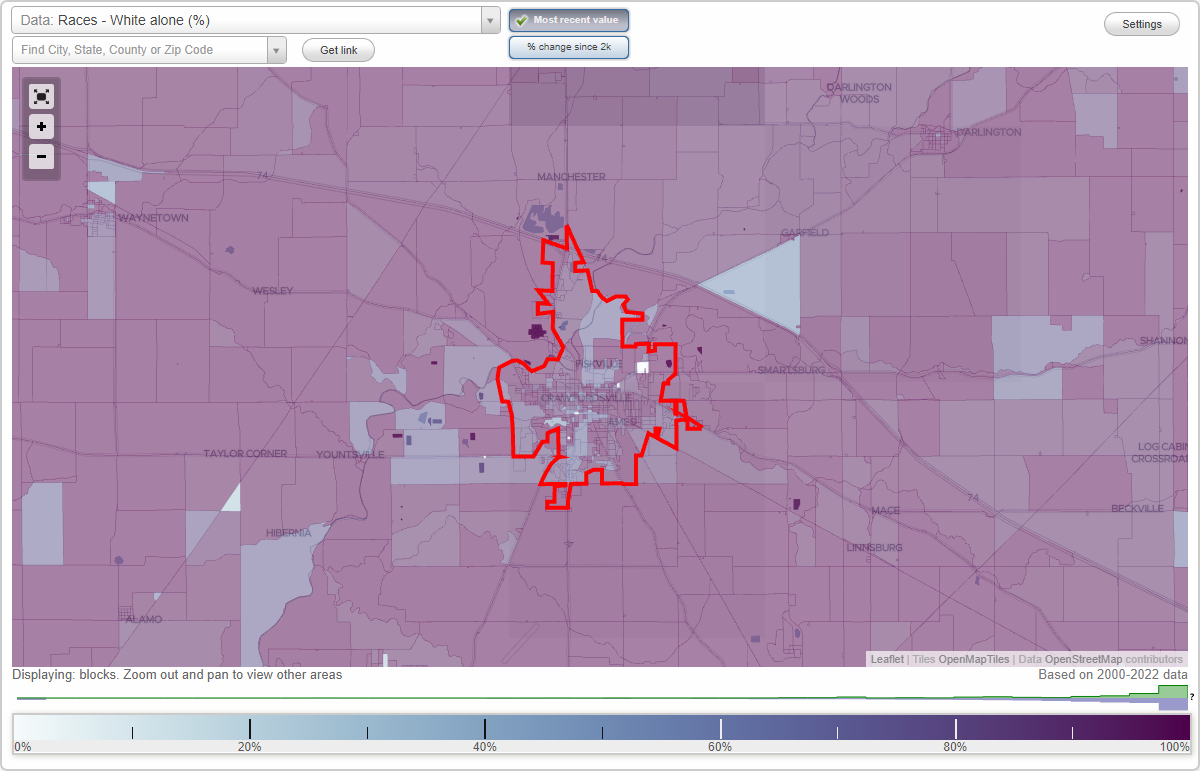
Races - White alone (%)
Races - White alone (% change since 2000)
Races - Black alone (%)
Races - Black alone (% change since 2000)
Races - American Indian alone (%)
Races - American Indian alone (% change since 2000)
Races - Asian alone (%)
Races - Asian alone (% change since 2000)
Races - Hispanic (%)
Races - Hispanic (% change since 2000)
Races - Native Hawaiian and Other Pacific Islander alone (%)
Races - Native Hawaiian and Other Pacific Islander alone (% change since 2000)
Races - Two or more races(%)
Races - Two or more races(% change since 2000)
Races - Other race alone (%)
Races - Other race alone (% change since 2000)
Racial diversity
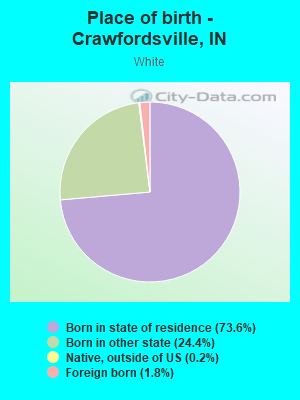
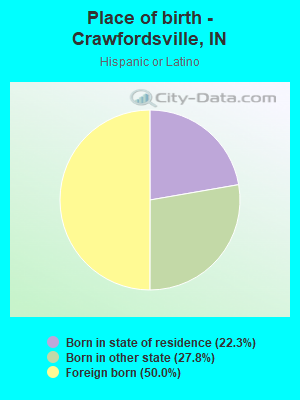
Place of birth - Born in state of residence (%)
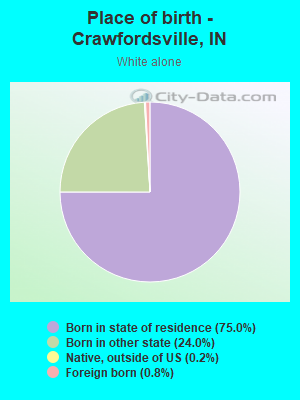
Place of birth - Born in state of residence (%) - White
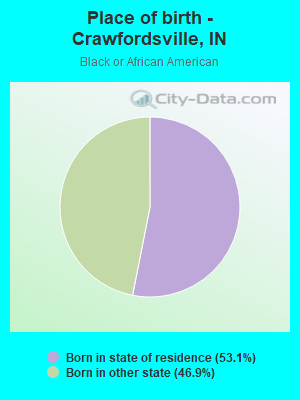
Place of birth - Born in state of residence (%) - Black or African American
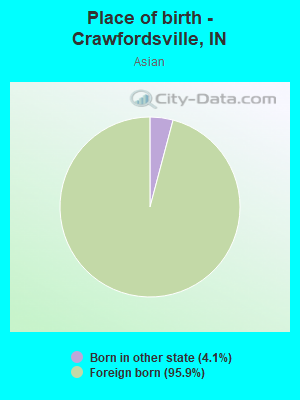
Place of birth - Born in state of residence (%) - Asian
Place of birth - Born in state of residence (%) - Hispanic or Latino
Place of birth - Born in state of residence (%) - American Indian and Alaska Native
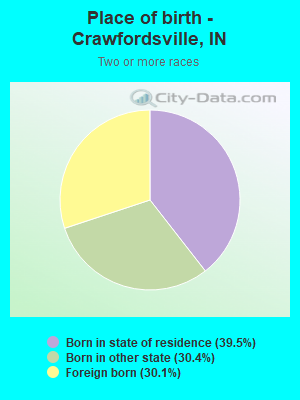
Place of birth - Born in state of residence (%) - Multirace
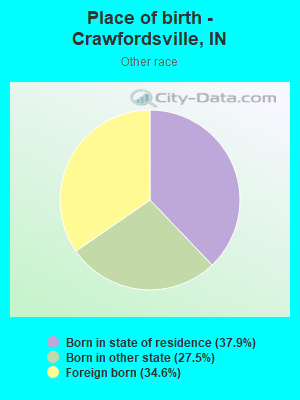
Place of birth - Born in state of residence (%) - Other Race
Place of birth - Born in other state (%)
Place of birth - Born in other state (%) - White
Place of birth - Born in other state (%) - Black or African American
Place of birth - Born in other state (%) - Asian
Place of birth - Born in other state (%) - Hispanic or Latino
Place of birth - Born in other state (%) - American Indian and Alaska Native
Place of birth - Born in other state (%) - Multirace
Place of birth - Born in other state (%) - Other Race
Place of birth - Native, outside of US (%)
Place of birth - Native, outside of US (%) - White
Place of birth - Native, outside of US (%) - Black or African American
Place of birth - Native, outside of US (%) - Asian
Place of birth - Native, outside of US (%) - Hispanic or Latino
Place of birth - Native, outside of US (%) - American Indian and Alaska Native
Place of birth - Native, outside of US (%) - Multirace
Place of birth - Native, outside of US (%) - Other Race
Place of birth - Foreign born (%)
Place of birth - Foreign born (%) - White
Place of birth - Foreign born (%) - Black or African American
Place of birth - Foreign born (%) - Asian
Place of birth - Foreign born (%) - Hispanic or Latino
Place of birth - Foreign born (%) - American Indian and Alaska Native
Place of birth - Foreign born (%) - Multirace
Place of birth - Foreign born (%) - Other Race
Residents speaking English at home (%)
Residents speaking English at home - Born in the United States (%)
Residents speaking English at home - Native, born elsewhere (%)
Residents speaking English at home - Foreign born (%)
Residents speaking Spanish at home (%)
Residents speaking Spanish at home - Born in the United States (%)
Residents speaking Spanish at home - Native, born elsewhere (%)
Residents speaking Spanish at home - Foreign born (%)
Residents speaking other language at home (%)
Residents speaking other language at home - Born in the United States (%)
Residents speaking other language at home - Native, born elsewhere (%)
Residents speaking other language at home - Foreign born (%)
Marital status - Never married (%)
Marital status - Now married (%)
Marital status - Separated (%)
Marital status - Widowed (%)
Marital status - Divorced (%)
Ancestries Reported - Arab (%)
Ancestries Reported - Czech (%)
Ancestries Reported - Danish (%)
Ancestries Reported - Dutch (%)
Ancestries Reported - English (%)
Ancestries Reported - French (%)
Ancestries Reported - French Canadian (%)
Ancestries Reported - German (%)
Ancestries Reported - Greek (%)
Ancestries Reported - Hungarian (%)
Ancestries Reported - Irish (%)
Ancestries Reported - Italian (%)
Ancestries Reported - Lithuanian (%)
Ancestries Reported - Norwegian (%)
Ancestries Reported - Polish (%)
Ancestries Reported - Portuguese (%)
Ancestries Reported - Russian (%)
Ancestries Reported - Scotch-Irish (%)
Ancestries Reported - Scottish (%)
Ancestries Reported - Slovak (%)
Ancestries Reported - Subsaharan African (%)
Ancestries Reported - Swedish (%)
Ancestries Reported - Swiss (%)
Ancestries Reported - Ukrainian (%)
Ancestries Reported - United States (%)
Ancestries Reported - Welsh (%)
Ancestries Reported - West Indian (%)
Ancestries Reported - Other (%)
Geographical mobility - Same house 1 year ago (%)
Geographical mobility - Same house 1 year ago (%) - White
Geographical mobility - Same house 1 year ago (%) - Black or African American
Geographical mobility - Same house 1 year ago (%) - Asian
Geographical mobility - Same house 1 year ago (%) - Hispanic or Latino
Geographical mobility - Same house 1 year ago (%) - American Indian and Alaska Native
Geographical mobility - Same house 1 year ago (%) - Multirace
Geographical mobility - Same house 1 year ago (%) - Other Race
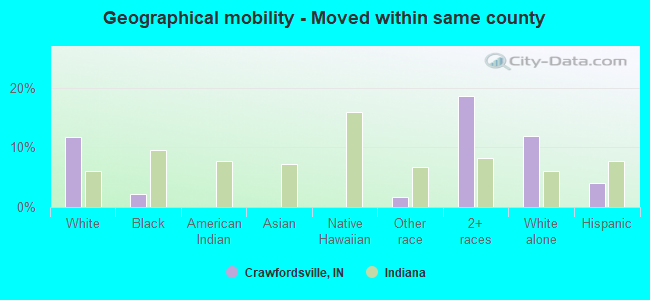
Geographical mobility - Moved within same county (%)
Geographical mobility - Moved within same county (%) - White
Geographical mobility - Moved within same county (%) - Black or African American
Geographical mobility - Moved within same county (%) - Asian
Geographical mobility - Moved within same county (%) - Hispanic or Latino
Geographical mobility - Moved within same county (%) - American Indian and Alaska Native
Geographical mobility - Moved within same county (%) - Multirace
Geographical mobility - Moved within same county (%) - Other Race
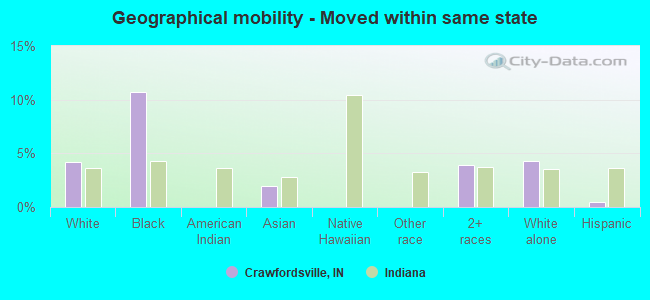
Geographical mobility - Moved from different county within same state (%)
Geographical mobility - Moved from different county within same state (%) - White
Geographical mobility - Moved from different county within same state (%) - Black or African American
Geographical mobility - Moved from different county within same state (%) - Asian
Geographical mobility - Moved from different county within same state (%) - Hispanic or Latino
Geographical mobility - Moved from different county within same state (%) - American Indian and Alaska Native
Geographical mobility - Moved from different county within same state (%) - Multirace
Geographical mobility - Moved from different county within same state (%) - Other Race
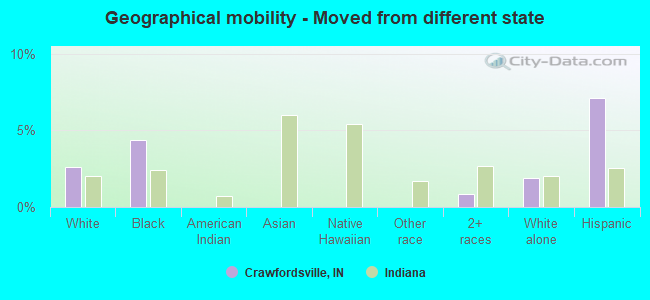
Geographical mobility - Moved from different state (%)
Geographical mobility - Moved from different state (%) - White
Geographical mobility - Moved from different state (%) - Black or African American
Geographical mobility - Moved from different state (%) - Asian
Geographical mobility - Moved from different state (%) - Hispanic or Latino
Geographical mobility - Moved from different state (%) - American Indian and Alaska Native
Geographical mobility - Moved from different state (%) - Multirace
Geographical mobility - Moved from different state (%) - Other Race
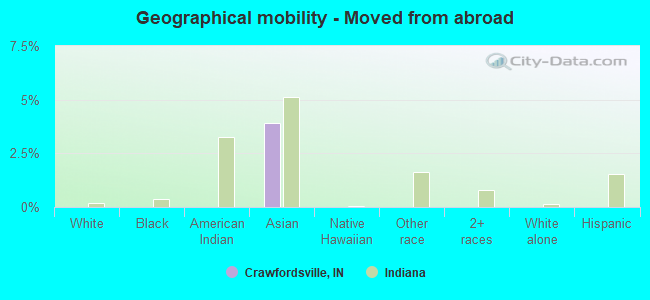
Geographical mobility - Moved from abroad (%)
Geographical mobility - Moved from abroad (%) - White
Geographical mobility - Moved from abroad (%) - Black or African American
Geographical mobility - Moved from abroad (%) - Asian
Geographical mobility - Moved from abroad (%) - Hispanic or Latino
Geographical mobility - Moved from abroad (%) - American Indian and Alaska Native
Geographical mobility - Moved from abroad (%) - Multirace
Geographical mobility - Moved from abroad (%) - Other Race
Place of birth for the foreign-born population - Ireland (%)
Place of birth for the foreign-born population - Denmark (%)
Place of birth for the foreign-born population - Norway (%)
Place of birth for the foreign-born population - Sweden (%)
Place of birth for the foreign-born population - United Kingdom (%)
Place of birth for the foreign-born population - England (%)
Place of birth for the foreign-born population - Scotland (%)
Place of birth for the foreign-born population - Other Northern Europe (%)
Place of birth for the foreign-born population - Austria (%)
Place of birth for the foreign-born population - Belgium (%)
Place of birth for the foreign-born population - France (%)
Place of birth for the foreign-born population - Germany (%)
Place of birth for the foreign-born population - Netherlands (%)
Place of birth for the foreign-born population - Switzerland (%)
Place of birth for the foreign-born population - Other Western Europe (%)
Place of birth for the foreign-born population - Greece (%)
Place of birth for the foreign-born population - Italy (%)
Place of birth for the foreign-born population - Portugal (%)
Place of birth for the foreign-born population - Spain (%)
Place of birth for the foreign-born population - Other Southern Europe (%)
Place of birth for the foreign-born population - Albania (%)
Place of birth for the foreign-born population - Belarus (%)
Place of birth for the foreign-born population - Bosnia and Herzegovina (%)
Place of birth for the foreign-born population - Bulgaria (%)
Place of birth for the foreign-born population - Croatia (%)
Place of birth for the foreign-born population - Czechoslovakia (%)
Place of birth for the foreign-born population - Hungary (%)
Place of birth for the foreign-born population - Latvia (%)
Place of birth for the foreign-born population - Lithuania (%)
Place of birth for the foreign-born population - North Macedonia (Macedonia) (%)
Place of birth for the foreign-born population - Moldova (%)
Place of birth for the foreign-born population - Poland (%)
Place of birth for the foreign-born population - Romania (%)
Place of birth for the foreign-born population - Russia (%)
Place of birth for the foreign-born population - Serbia (%)
Place of birth for the foreign-born population - Ukraine (%)
Place of birth for the foreign-born population - Other Eastern Europe (%)
Place of birth for the foreign-born population - China (%)
Place of birth for the foreign-born population - Hong Kong (%)
Place of birth for the foreign-born population - Taiwan (%)
Place of birth for the foreign-born population - Japan (%)
Place of birth for the foreign-born population - Korea (%)
Place of birth for the foreign-born population - Other Eastern Asia (%)
Place of birth for the foreign-born population - Afghanistan (%)
Place of birth for the foreign-born population - Bangladesh (%)
Place of birth for the foreign-born population - India (%)
Place of birth for the foreign-born population - Iran (%)
Place of birth for the foreign-born population - Kazakhstan (%)
Place of birth for the foreign-born population - Nepal (%)
Place of birth for the foreign-born population - Pakistan (%)
Place of birth for the foreign-born population - Sri Lanka (%)
Place of birth for the foreign-born population - Uzbekistan (%)
Place of birth for the foreign-born population - Other South Central Asia (%)
Place of birth for the foreign-born population - Burma (%)
Place of birth for the foreign-born population - Cambodia (%)
Place of birth for the foreign-born population - Indonesia (%)
Place of birth for the foreign-born population - Laos (%)
Place of birth for the foreign-born population - Malaysia (%)
Place of birth for the foreign-born population - Philippines (%)
Place of birth for the foreign-born population - Singapore (%)
Place of birth for the foreign-born population - Thailand (%)
Place of birth for the foreign-born population - Vietnam (%)
Place of birth for the foreign-born population - Other South Eastern Asia (%)
Place of birth for the foreign-born population - Armenia (%)
Place of birth for the foreign-born population - Iraq (%)
Place of birth for the foreign-born population - Israel (%)
Place of birth for the foreign-born population - Jordan (%)
Place of birth for the foreign-born population - Kuwait (%)
Place of birth for the foreign-born population - Lebanon (%)
Place of birth for the foreign-born population - Saudi Arabia (%)
Place of birth for the foreign-born population - Syria (%)
Place of birth for the foreign-born population - Turkey (%)
Place of birth for the foreign-born population - Yemen (%)
Place of birth for the foreign-born population - Other Western Asia (%)
Place of birth for the foreign-born population - Eritrea (%)
Place of birth for the foreign-born population - Ethiopia (%)
Place of birth for the foreign-born population - Kenya (%)
Place of birth for the foreign-born population - Somalia (%)
Place of birth for the foreign-born population - Uganda (%)
Place of birth for the foreign-born population - Zimbabwe (%)
Place of birth for the foreign-born population - Other Eastern Africa (%)
Place of birth for the foreign-born population - Cameroon (%)
Place of birth for the foreign-born population - Congo (%)
Place of birth for the foreign-born population - Democratic Republic of Congo (Zaire) (%)
Place of birth for the foreign-born population - Other Middle Africa (%)
Place of birth for the foreign-born population - Egypt (%)
Place of birth for the foreign-born population - Morocco (%)
Place of birth for the foreign-born population - Sudan (%)
Place of birth for the foreign-born population - Other Northern Africa (%)
Place of birth for the foreign-born population - South Africa (%)
Place of birth for the foreign-born population - Other Southern Africa (%)
Place of birth for the foreign-born population - Cabo Verde (%)
Place of birth for the foreign-born population - Ghana (%)
Place of birth for the foreign-born population - Liberia (%)
Place of birth for the foreign-born population - Nigeria (%)
Place of birth for the foreign-born population - Senegal (%)
Place of birth for the foreign-born population - Sierra Leone (%)
Place of birth for the foreign-born population - Other Western Africa (%)
Place of birth for the foreign-born population - Australia (%)
Place of birth for the foreign-born population - New Zealand (%)
Place of birth for the foreign-born population - Fiji (%)
Place of birth for the foreign-born population - Micronesia (%)
Place of birth for the foreign-born population - Bahamas (%)
Place of birth for the foreign-born population - Barbados (%)
Place of birth for the foreign-born population - Cuba (%)
Place of birth for the foreign-born population - Dominica (%)
Place of birth for the foreign-born population - Dominican Republic (%)
Place of birth for the foreign-born population - Grenada (%)
Place of birth for the foreign-born population - Haiti (%)
Place of birth for the foreign-born population - Jamaica (%)
Place of birth for the foreign-born population - St. Vincent and the Grenadines (%)
Place of birth for the foreign-born population - Trinidad and Tobago (%)
Place of birth for the foreign-born population - West Indies (%)
Place of birth for the foreign-born population - Other Caribbean (%)
Place of birth for the foreign-born population - Belize (%)
Place of birth for the foreign-born population - Costa Rica (%)
Place of birth for the foreign-born population - El Salvador (%)
Place of birth for the foreign-born population - Guatemala (%)
Place of birth for the foreign-born population - Honduras (%)
Place of birth for the foreign-born population - Mexico (%)
Place of birth for the foreign-born population - Nicaragua (%)
Place of birth for the foreign-born population - Panama (%)
Place of birth for the foreign-born population - Other Central America (%)
Place of birth for the foreign-born population - Argentina (%)
Place of birth for the foreign-born population - Bolivia (%)
Place of birth for the foreign-born population - Brazil (%)
Place of birth for the foreign-born population - Chile (%)
Place of birth for the foreign-born population - Colombia (%)
Place of birth for the foreign-born population - Ecuador (%)
Place of birth for the foreign-born population - Guyana (%)
Place of birth for the foreign-born population - Peru (%)
Place of birth for the foreign-born population - Uruguay (%)
Place of birth for the foreign-born population - Venezuela (%)
Place of birth for the foreign-born population - Other South America (%)
Place of birth for the foreign-born population - Canada (%)
Place of birth for the foreign-born population - Other Northern America (%)
Place of birth for the foreign-born population - Other (%)
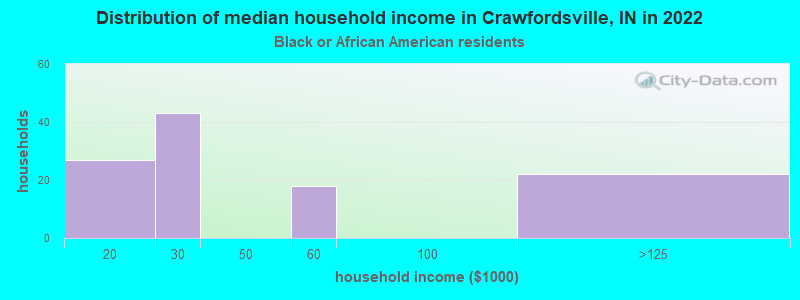
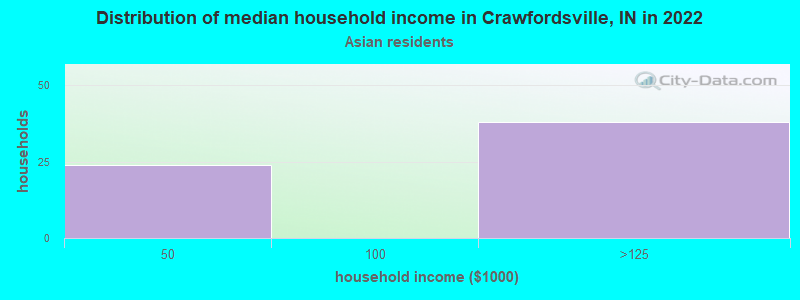
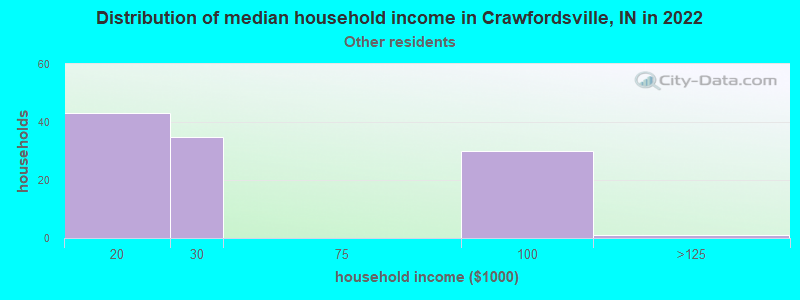
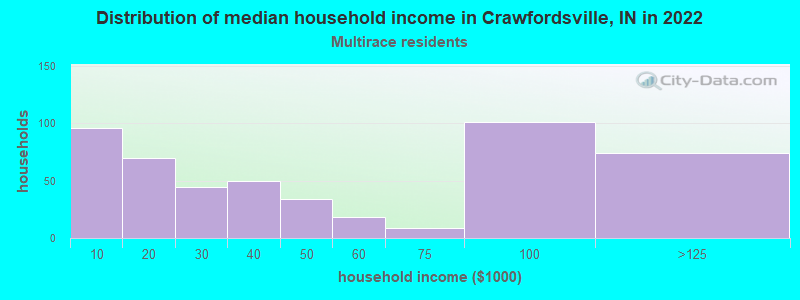
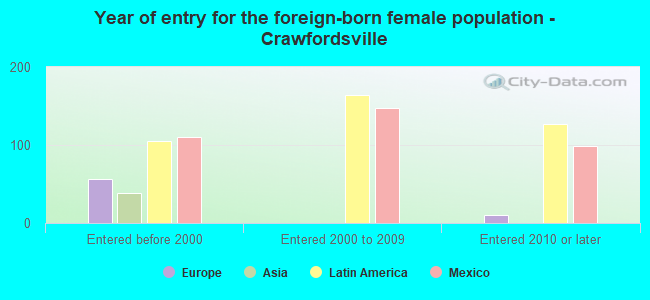
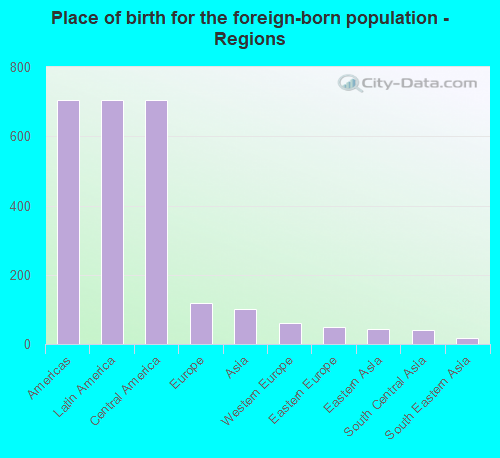
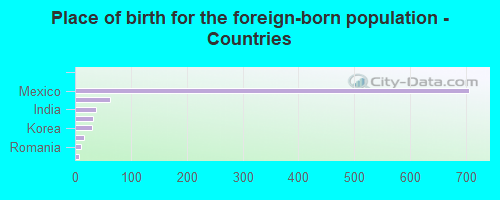
According to 2022 data, the most numerous races in Crawfordsville, IN are White alone (13,942 residents), Black alone (210 residents), and Hispanic (1,410 residents). 90.9% of Crawfordsville residents speak English at home. 5.6% of Crawfordsville, IN residents are foreign-born (3.9% born in Latin America, 0.7% born in Europe), which is 6.8% less than the foreign-born rate of 6.0% across the entire state of Indiana.
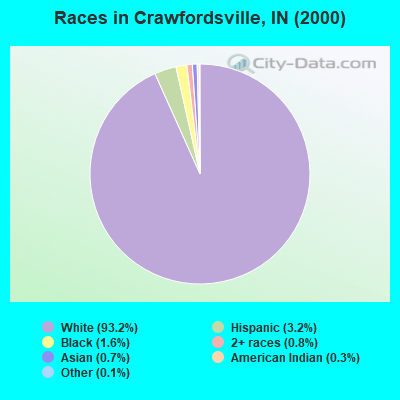
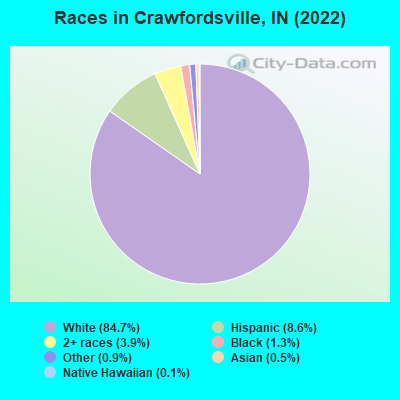
Race distribution in Crawfordsville
2000 2022
5,219,373 85.8% White alone 505,462 8.3% Black alone 214,536 3.5% Hispanic 61,115 1.0% Two or more races 58,424 1.0% Asian alone 13,654 0.2% American Indian alone 6,348 0.1% Other race alone 1,573 0.03% Native Hawaiian and Other
5,192,455 76.0% White alone 628,054 9.2% Black alone 534,528 7.8% Hispanic 263,242 3.9% Two or more races 172,880 2.5% Asian alone 33,467 0.5% Other race alone 5,866 0.09% American Indian alone 2,545 0.04% Native Hawaiian and Other
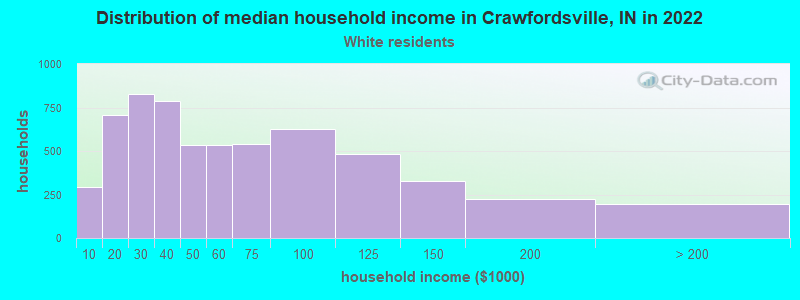
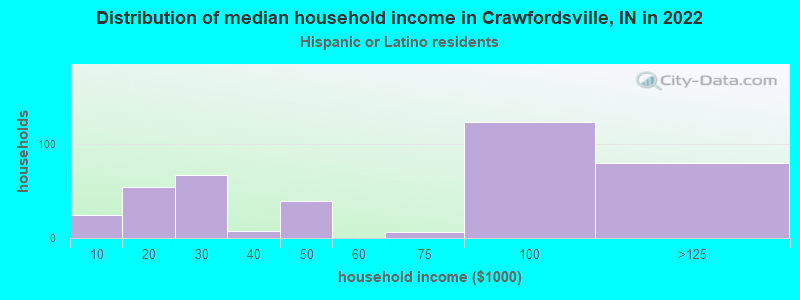
Income and house value in Crawfordsville Median household income in 2022 $48,141 White non-Hispanic householders$36,723 Two or more races householdersMedian 2022 house value $150,987 White Non-Hispanic householders$109,414 Black or African American householders $259,834 Asian householders$212,592 Some other race householders$192,372 Two or more races householders$212,592 Hispanic or Latino householders
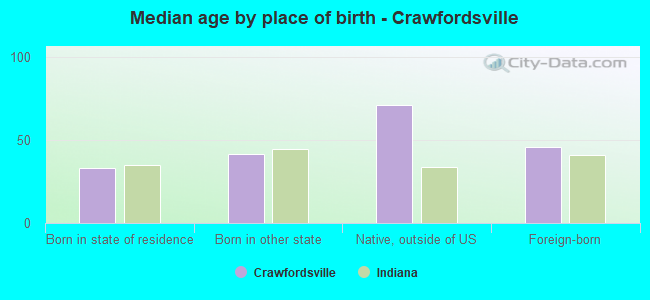
Median age by race in Crawfordsville
38.9 Median age for White residents37.6 40.3 49.5 Median age for Black or African American residents49.1 32.7 -558,797,523.8 Median age for American Indian / Alaska Native residents-654,255,318.5 -491,600,353.2 34.6 Median age for Asian residents68.8 -670,756,645.5 -664,335,663.7 Median age for Native Hawaiian / Pacific Islander residents-644,025,156.6 -664,437,011.6 13.3 Median age for Other race residents8.5 22.3 23.3 Median age for Two or more races residents28.6 21.1 39.1 Median age for White alone residents37.9 39.8 27.6 Median age for Hispanic or Latino residents20.5 33.4
Owner/renter occupied households by race in Crawfordsville
House owners and renters - White residents 3,857 63.4% Owner occupied2,222 36.6% Renter occupiedHouse owners and renters - Black or African American residents 17 15.1% Owner occupied94 84.9% Renter occupiedHouse owners and renters - American Indian / Alaska Native residents 3 100.0% Renter occupiedHouse owners and renters - Asian residents 36 57.8% Owner occupied26 42.2% Renter occupiedHouse owners and renters - Other race residents 12 12.0% Owner occupied89 88.0% Renter occupiedHouse owners and renters - Two or more races residents 217 45.2% Owner occupied262 54.8% Renter occupiedHouse owners and renters - White alone residents 3,850 63.8% Owner occupied2,188 36.2% Renter occupiedHouse owners and renters - Hispanic or Latino residents 138 35.7% Owner occupied248 64.3% Renter occupied
Language usage in Crawfordsville
English speakers - Total 90.9% of residents of Crawfordsville speak English at home.
7.9% of residents speak Spanish at home 623 51.4% Speak English very well589 48.6% Speak English less than very well1.0% of residents speak other language at home 141 89.2% Speak English very well17 10.8% Speak English less than very well
English speakers - Born in the United States 92.4% of residents of Crawfordsville speak English at home.
7.2% of residents speak Spanish at home 265 90.1% Speak English very well29 9.9% Speak English less than very well0.3% of residents speak other language at home 3 21.4% Speak English very well11 78.6% Speak English less than very well
All residents speak only English at home
English speakers - Foreign-born 8.8% of residents of Crawfordsville speak English at home.
77.9% of residents speak Spanish at home 171 23.9% Speak English very well543 76.1% Speak English less than very well13.6% of residents speak other language at home 121 96.8% Speak English very well4 3.2% Speak English less than very well
White (Caucasian) - Speak only English Native:
99.0% (12,982)Foreign-born:
14.9% (38)
White (Caucasian) - Speak another language Native:
1.1% (145)Foreign-born:
81.0% (206)
Asian - Speak only English Native:
94.8% (3)Foreign-born:
41.1% (34)
Other race - Speak another language Native:
70.9% (213)Foreign-born:
97.7% (181)
Two or more races - Speak another language Native:
27.7% (235)Foreign-born:
99.0% (404)
White alone - Speak only English Native:
99.6% (12,978)Foreign-born:
38.7% (42)
White alone - Speak another language Native:
0.3% (45)Foreign-born:
61.5% (67)
Hispanic or Latino - Speak another language Native:
80.2% (495)Foreign-born:
99.5% (704)
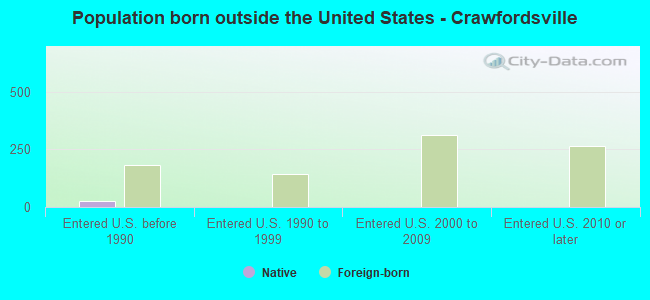
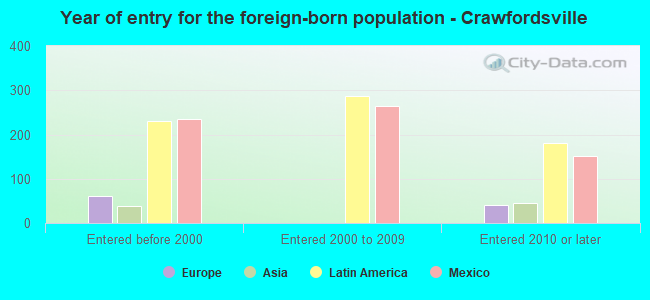
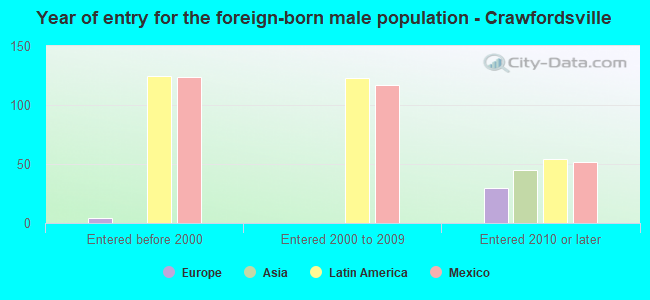
Foreign-born residents in Crawfordsville 924 residents are foreign born (3.9% Latin America , 0.7% Europe ).
This city:
5.6%Indiana:
5.6%
Marital status for residents in Crawfordsville Marital status - White (Caucasian) population 15 years and over
Males 40.4% Never married40.1% Now married1.6% Separated5.6% Widowed12.3% DivorcedFemales 24.8% Never married39.4% Now married1.3% Separated16.2% Widowed18.3% DivorcedWomen who gave birth in the past 12 months Now married:
31.1% (93)Unmarried:
68.9% (206)
Women who did not give birth in the past 12 months Now married:
43.6% (1,140)Unmarried:
56.4% (1,474)
Marital status - Black or African American population 15 years and over
Males 59.3% Never married38.0% Now married0.0% Separated2.8% Widowed0.0% DivorcedFemales 29.7% Never married23.4% Now married0.0% Separated12.5% Widowed34.4% DivorcedWomen who did not give birth in the past 12 months Now married:
0.0% (0)Unmarried:
100.0% (19)
Marital status - Asian population 15 years and over
Males 45.3% Never married54.7% Now married0.0% Separated0.0% Widowed0.0% DivorcedFemales 0.0% Never married100.0% Now married0.0% Separated0.0% Widowed0.0% DivorcedWomen who did not give birth in the past 12 months Now married:
100.0% (35)Unmarried:
0.0% (0)
Marital status - Other race population 15 years and over
Males 47.7% Never married51.4% Now married0.0% Separated0.9% Widowed0.0% DivorcedFemales 47.0% Never married40.0% Now married5.2% Separated7.8% Widowed0.0% DivorcedWomen who gave birth in the past 12 months Now married:
100.0% (7)Unmarried:
0.0% (0)
Women who did not give birth in the past 12 months Now married:
38.6% (41)Unmarried:
61.4% (66)
Marital status - Two or more races population 15 years and over
Males 58.2% Never married22.2% Now married1.2% Separated6.1% Widowed12.4% DivorcedFemales 52.9% Never married37.4% Now married0.0% Separated9.7% Widowed0.0% DivorcedWomen who gave birth in the past 12 months Now married:
100.0% (16)Unmarried:
0.0% (0)
Women who did not give birth in the past 12 months Now married:
33.7% (83)Unmarried:
66.3% (164)
Marital status - White alone, not Hispanic / Latino population 15 years and over
Males 40.2% Never married40.4% Now married1.6% Separated5.8% Widowed12.0% DivorcedFemales 23.6% Never married40.2% Now married1.3% Separated16.8% Widowed18.1% DivorcedWomen who gave birth in the past 12 months Now married:
31.1% (94)Unmarried:
68.9% (209)
Women who did not give birth in the past 12 months Now married:
44.3% (1,125)Unmarried:
55.7% (1,415)
Marital status - Hispanic or Latino population 15 years and over
Males 53.6% Never married34.0% Now married0.0% Separated0.2% Widowed12.2% DivorcedFemales 54.5% Never married32.3% Now married1.3% Separated2.0% Widowed9.9% DivorcedWomen who gave birth in the past 12 months Now married:
100.0% (19)Unmarried:
0.0% (0)
Women who did not give birth in the past 12 months Now married:
36.4% (129)Unmarried:
63.6% (225)
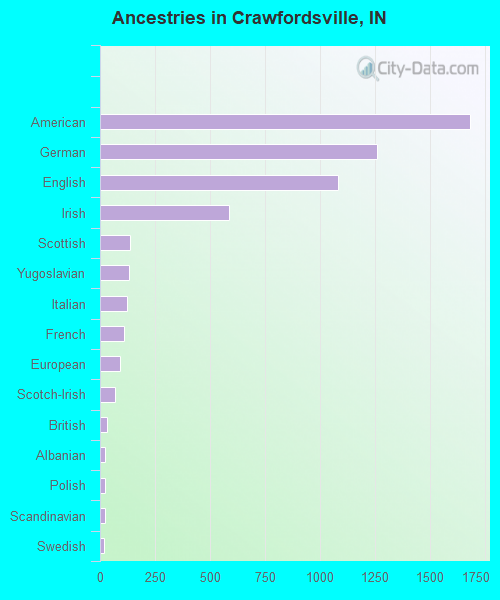
Ancestries in Crawfordsville
1,686 21.6% American1,261 16.2% German1,084 13.9% English588 7.5% Irish138 1.8% Scottish130 1.7% Yugoslavian125 1.6% Italian109 1.4% French91 1.2% European69 0.9% Scotch-Irish31 0.4% British25 0.3% Albanian24 0.3% Polish22 0.3% Scandinavian17 0.2% Swedish11 0.1% Armenian11 0.1% Swiss10 0.1% Danish10 0.1% Romanian6 0.08% Croatian6 0.08% African5 0.06% Russian4 0.05% Hungarian2 0.03% Turkish
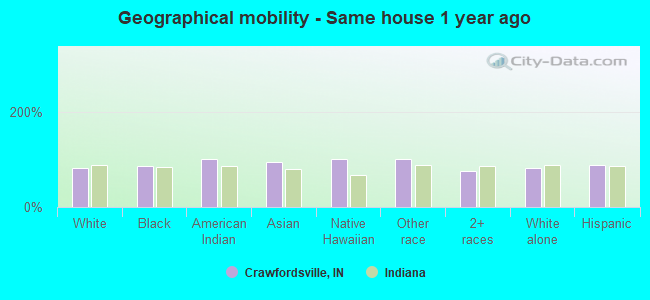
Geographical mobility in Crawfordsville Same house 1 year ago 11,373 80.7% White (Caucasian)207 84.8% Black or African American4 100.0% American Indian / Alaska Native84 93.8% Asian18 100.0% Native Hawaiian / Pacific Islander554 100.0% Other race982 76.0% Two or more races11,190 80.9% White alone, not Hispanic / Latino1,217 88.2% Hispanic or LatinoMoved within same county 1,661 11.8% White / Caucasian5 2.1% Black or African American9 1.7% Other race241 18.7% Two or more races1,658 12.0% White alone, not Hispanic / Latino55 4.0% Hispanic or LatinoMoved within same state 585 4.1% White / Caucasian26 10.7% Black or African American2 2.0% Asian51 3.9% Two or more races594 4.3% White alone, not Hispanic / Latino7 0.5% Hispanic or LatinoMoved from different state 363 2.6% White / Caucasian11 4.4% Black or African American11 0.9% Two or more races263 1.9% White alone, not Hispanic / Latino98 7.1% Hispanic or LatinoMoved from abroad 1 0.0% White4 3.9% Asian1 0.0% White alone, not Hispanic / Latino
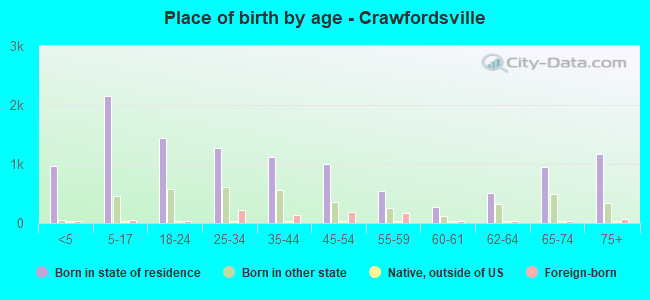
Children Nativity (place of birth) in Crawfordsville
Children under 6 years - Living with two parents Both parents native 486 100.0% NativeBoth parents foreign-born 41 100.0% NativeOne native, one foreign-born parent 78 100.0% NativeChildren under 6 years - Living with one parent Native parent 396 100.0% NativeForeign-born parent 44 100.0% NativeChildren 6 to 17 years - Living with two parents Both parents native 1,030 100.0% NativeBoth parents foreign-born 128 73.2% Native47 26.8% Foreign-bornOne native, one foreign-born parent 54 100.0% NativeChildren 6 to 17 years - Living with one parent Native parent 734 100.0% NativeForeign-born parent 137 52.0% Native126 48.0% Foreign-born
Grandparents responsible for own grandchildren in Crawfordsville
Grandparents (30 to 59 years) White / Caucasian 54 51.4% Responsible for grandchildren51 48.6% Not responsible for grandchildrenTwo or more races 1 1.9% Responsible for grandchildren65 98.1% Not responsible for grandchildrenWhite alone, not Hispanic / Latino 56 50.7% Responsible for grandchildren54 49.3% Not responsible for grandchildrenHispanic or Latino 44 100.0% Not responsible for grandchildrenGrandparents (60 years and over) White / Caucasian 165 83.3% Responsible for grandchildren33 16.7% Not responsible for grandchildrenTwo or more races 10 100.0% Not responsible for grandchildrenWhite alone, not Hispanic / Latino 167 83.2% Responsible for grandchildren34 16.8% Not responsible for grandchildren