Races in Cottonwood Heights, Utah (UT) Detailed Stats
Data:
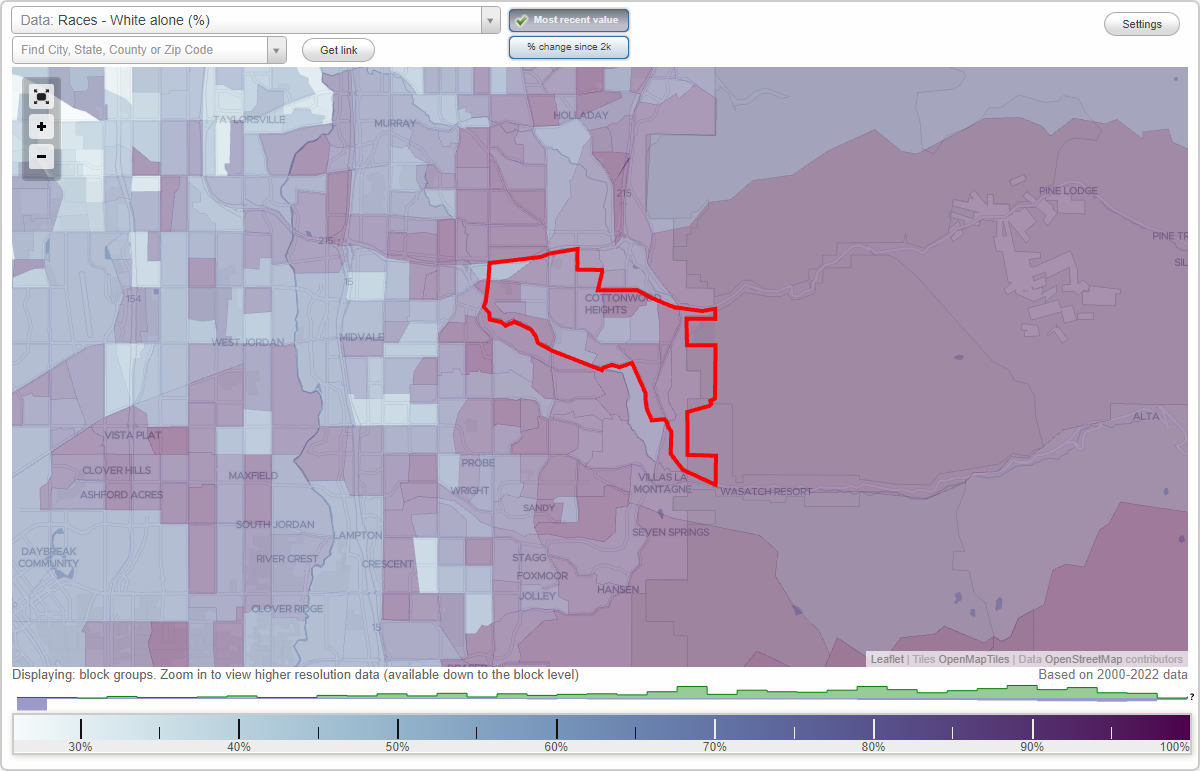
Races - White alone (%)
Races - White alone (% change since 2000)
Races - Black alone (%)
Races - Black alone (% change since 2000)
Races - American Indian alone (%)
Races - American Indian alone (% change since 2000)
Races - Asian alone (%)
Races - Asian alone (% change since 2000)
Races - Hispanic (%)
Races - Hispanic (% change since 2000)
Races - Native Hawaiian and Other Pacific Islander alone (%)
Races - Native Hawaiian and Other Pacific Islander alone (% change since 2000)
Races - Two or more races(%)
Races - Two or more races(% change since 2000)
Races - Other race alone (%)
Races - Other race alone (% change since 2000)
Racial diversity
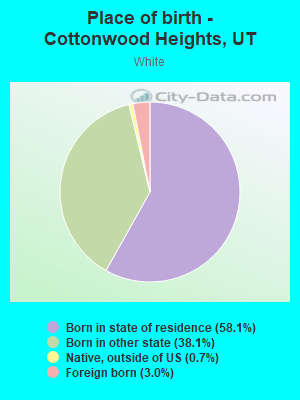
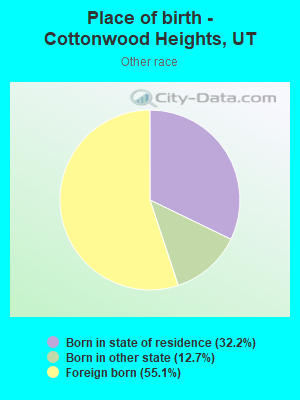
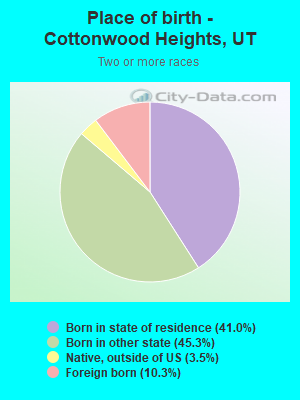
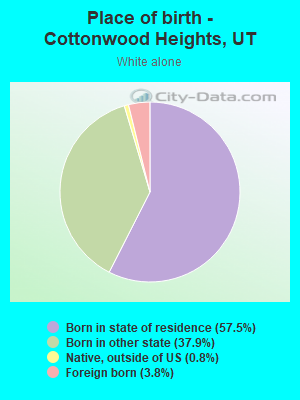
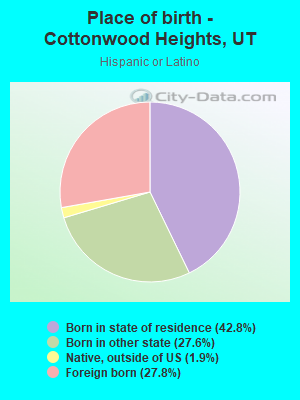
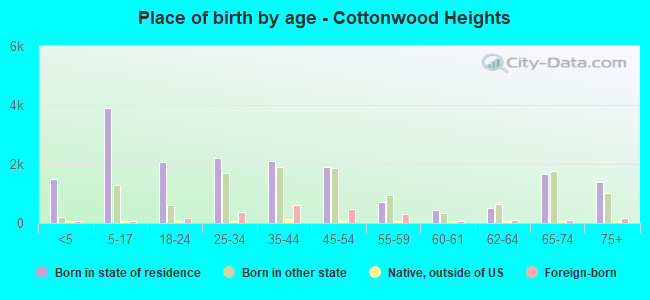
Place of birth - Born in state of residence (%)
Place of birth - Born in state of residence (%) - White
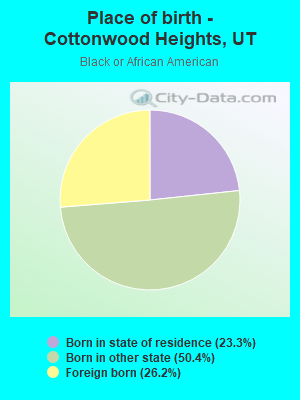
Place of birth - Born in state of residence (%) - Black or African American
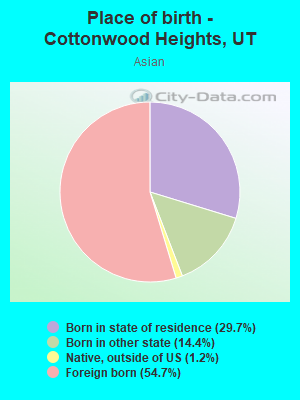
Place of birth - Born in state of residence (%) - Asian
Place of birth - Born in state of residence (%) - Hispanic or Latino
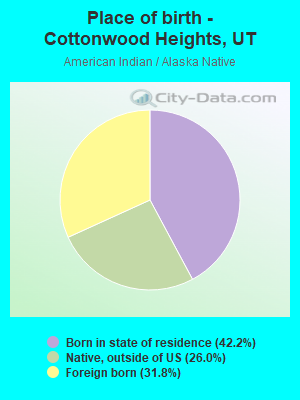
Place of birth - Born in state of residence (%) - American Indian and Alaska Native
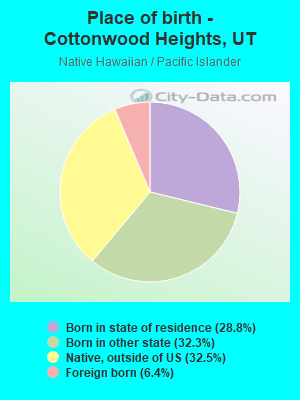
Place of birth - Born in state of residence (%) - Multirace
Place of birth - Born in state of residence (%) - Other Race
Place of birth - Born in other state (%)
Place of birth - Born in other state (%) - White
Place of birth - Born in other state (%) - Black or African American
Place of birth - Born in other state (%) - Asian
Place of birth - Born in other state (%) - Hispanic or Latino
Place of birth - Born in other state (%) - American Indian and Alaska Native
Place of birth - Born in other state (%) - Multirace
Place of birth - Born in other state (%) - Other Race
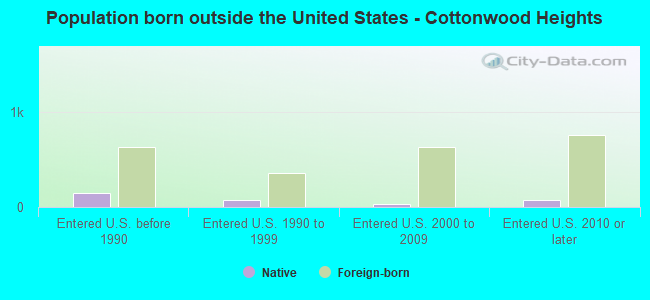
Place of birth - Native, outside of US (%)
Place of birth - Native, outside of US (%) - White
Place of birth - Native, outside of US (%) - Black or African American
Place of birth - Native, outside of US (%) - Asian
Place of birth - Native, outside of US (%) - Hispanic or Latino
Place of birth - Native, outside of US (%) - American Indian and Alaska Native
Place of birth - Native, outside of US (%) - Multirace
Place of birth - Native, outside of US (%) - Other Race
Place of birth - Foreign born (%)
Place of birth - Foreign born (%) - White
Place of birth - Foreign born (%) - Black or African American
Place of birth - Foreign born (%) - Asian
Place of birth - Foreign born (%) - Hispanic or Latino
Place of birth - Foreign born (%) - American Indian and Alaska Native
Place of birth - Foreign born (%) - Multirace
Place of birth - Foreign born (%) - Other Race
Residents speaking English at home (%)
Residents speaking English at home - Born in the United States (%)
Residents speaking English at home - Native, born elsewhere (%)
Residents speaking English at home - Foreign born (%)
Residents speaking Spanish at home (%)
Residents speaking Spanish at home - Born in the United States (%)
Residents speaking Spanish at home - Native, born elsewhere (%)
Residents speaking Spanish at home - Foreign born (%)
Residents speaking other language at home (%)
Residents speaking other language at home - Born in the United States (%)
Residents speaking other language at home - Native, born elsewhere (%)
Residents speaking other language at home - Foreign born (%)
Marital status - Never married (%)
Marital status - Now married (%)
Marital status - Separated (%)
Marital status - Widowed (%)
Marital status - Divorced (%)
Ancestries Reported - Arab (%)
Ancestries Reported - Czech (%)
Ancestries Reported - Danish (%)
Ancestries Reported - Dutch (%)
Ancestries Reported - English (%)
Ancestries Reported - French (%)
Ancestries Reported - French Canadian (%)
Ancestries Reported - German (%)
Ancestries Reported - Greek (%)
Ancestries Reported - Hungarian (%)
Ancestries Reported - Irish (%)
Ancestries Reported - Italian (%)
Ancestries Reported - Lithuanian (%)
Ancestries Reported - Norwegian (%)
Ancestries Reported - Polish (%)
Ancestries Reported - Portuguese (%)
Ancestries Reported - Russian (%)
Ancestries Reported - Scotch-Irish (%)
Ancestries Reported - Scottish (%)
Ancestries Reported - Slovak (%)
Ancestries Reported - Subsaharan African (%)
Ancestries Reported - Swedish (%)
Ancestries Reported - Swiss (%)
Ancestries Reported - Ukrainian (%)
Ancestries Reported - United States (%)
Ancestries Reported - Welsh (%)
Ancestries Reported - West Indian (%)
Ancestries Reported - Other (%)
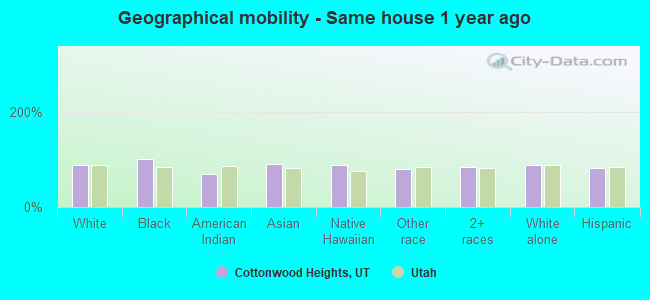
Geographical mobility - Same house 1 year ago (%)
Geographical mobility - Same house 1 year ago (%) - White
Geographical mobility - Same house 1 year ago (%) - Black or African American
Geographical mobility - Same house 1 year ago (%) - Asian
Geographical mobility - Same house 1 year ago (%) - Hispanic or Latino
Geographical mobility - Same house 1 year ago (%) - American Indian and Alaska Native
Geographical mobility - Same house 1 year ago (%) - Multirace
Geographical mobility - Same house 1 year ago (%) - Other Race
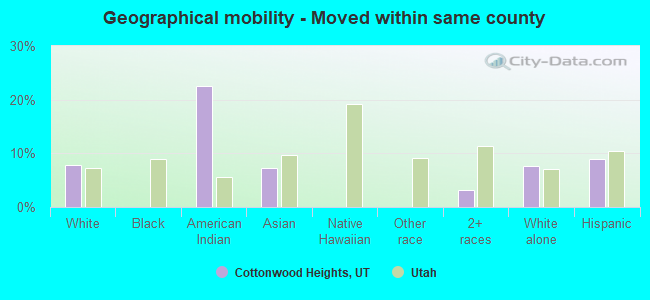
Geographical mobility - Moved within same county (%)
Geographical mobility - Moved within same county (%) - White
Geographical mobility - Moved within same county (%) - Black or African American
Geographical mobility - Moved within same county (%) - Asian
Geographical mobility - Moved within same county (%) - Hispanic or Latino
Geographical mobility - Moved within same county (%) - American Indian and Alaska Native
Geographical mobility - Moved within same county (%) - Multirace
Geographical mobility - Moved within same county (%) - Other Race
Geographical mobility - Moved from different county within same state (%)
Geographical mobility - Moved from different county within same state (%) - White
Geographical mobility - Moved from different county within same state (%) - Black or African American
Geographical mobility - Moved from different county within same state (%) - Asian
Geographical mobility - Moved from different county within same state (%) - Hispanic or Latino
Geographical mobility - Moved from different county within same state (%) - American Indian and Alaska Native
Geographical mobility - Moved from different county within same state (%) - Multirace
Geographical mobility - Moved from different county within same state (%) - Other Race
Geographical mobility - Moved from different state (%)
Geographical mobility - Moved from different state (%) - White
Geographical mobility - Moved from different state (%) - Black or African American
Geographical mobility - Moved from different state (%) - Asian
Geographical mobility - Moved from different state (%) - Hispanic or Latino
Geographical mobility - Moved from different state (%) - American Indian and Alaska Native
Geographical mobility - Moved from different state (%) - Multirace
Geographical mobility - Moved from different state (%) - Other Race
Geographical mobility - Moved from abroad (%)
Geographical mobility - Moved from abroad (%) - White
Geographical mobility - Moved from abroad (%) - Black or African American
Geographical mobility - Moved from abroad (%) - Asian
Geographical mobility - Moved from abroad (%) - Hispanic or Latino
Geographical mobility - Moved from abroad (%) - American Indian and Alaska Native
Geographical mobility - Moved from abroad (%) - Multirace
Geographical mobility - Moved from abroad (%) - Other Race
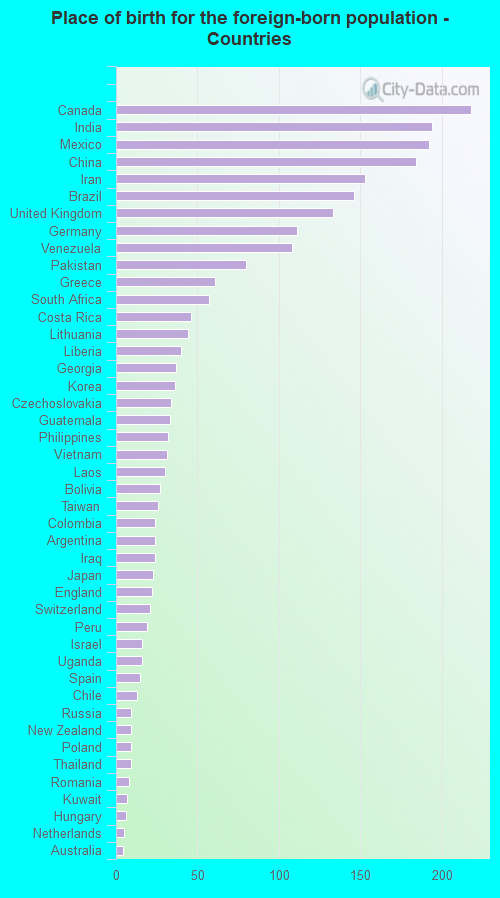
Place of birth for the foreign-born population - Ireland (%)
Place of birth for the foreign-born population - Denmark (%)
Place of birth for the foreign-born population - Norway (%)
Place of birth for the foreign-born population - Sweden (%)
Place of birth for the foreign-born population - United Kingdom (%)
Place of birth for the foreign-born population - England (%)
Place of birth for the foreign-born population - Scotland (%)
Place of birth for the foreign-born population - Other Northern Europe (%)
Place of birth for the foreign-born population - Austria (%)
Place of birth for the foreign-born population - Belgium (%)
Place of birth for the foreign-born population - France (%)
Place of birth for the foreign-born population - Germany (%)
Place of birth for the foreign-born population - Netherlands (%)
Place of birth for the foreign-born population - Switzerland (%)
Place of birth for the foreign-born population - Other Western Europe (%)
Place of birth for the foreign-born population - Greece (%)
Place of birth for the foreign-born population - Italy (%)
Place of birth for the foreign-born population - Portugal (%)
Place of birth for the foreign-born population - Spain (%)
Place of birth for the foreign-born population - Other Southern Europe (%)
Place of birth for the foreign-born population - Albania (%)
Place of birth for the foreign-born population - Belarus (%)
Place of birth for the foreign-born population - Bosnia and Herzegovina (%)
Place of birth for the foreign-born population - Bulgaria (%)
Place of birth for the foreign-born population - Croatia (%)
Place of birth for the foreign-born population - Czechoslovakia (%)
Place of birth for the foreign-born population - Hungary (%)
Place of birth for the foreign-born population - Latvia (%)
Place of birth for the foreign-born population - Lithuania (%)
Place of birth for the foreign-born population - North Macedonia (Macedonia) (%)
Place of birth for the foreign-born population - Moldova (%)
Place of birth for the foreign-born population - Poland (%)
Place of birth for the foreign-born population - Romania (%)
Place of birth for the foreign-born population - Russia (%)
Place of birth for the foreign-born population - Serbia (%)
Place of birth for the foreign-born population - Ukraine (%)
Place of birth for the foreign-born population - Other Eastern Europe (%)
Place of birth for the foreign-born population - China (%)
Place of birth for the foreign-born population - Hong Kong (%)
Place of birth for the foreign-born population - Taiwan (%)
Place of birth for the foreign-born population - Japan (%)
Place of birth for the foreign-born population - Korea (%)
Place of birth for the foreign-born population - Other Eastern Asia (%)
Place of birth for the foreign-born population - Afghanistan (%)
Place of birth for the foreign-born population - Bangladesh (%)
Place of birth for the foreign-born population - India (%)
Place of birth for the foreign-born population - Iran (%)
Place of birth for the foreign-born population - Kazakhstan (%)
Place of birth for the foreign-born population - Nepal (%)
Place of birth for the foreign-born population - Pakistan (%)
Place of birth for the foreign-born population - Sri Lanka (%)
Place of birth for the foreign-born population - Uzbekistan (%)
Place of birth for the foreign-born population - Other South Central Asia (%)
Place of birth for the foreign-born population - Burma (%)
Place of birth for the foreign-born population - Cambodia (%)
Place of birth for the foreign-born population - Indonesia (%)
Place of birth for the foreign-born population - Laos (%)
Place of birth for the foreign-born population - Malaysia (%)
Place of birth for the foreign-born population - Philippines (%)
Place of birth for the foreign-born population - Singapore (%)
Place of birth for the foreign-born population - Thailand (%)
Place of birth for the foreign-born population - Vietnam (%)
Place of birth for the foreign-born population - Other South Eastern Asia (%)
Place of birth for the foreign-born population - Armenia (%)
Place of birth for the foreign-born population - Iraq (%)
Place of birth for the foreign-born population - Israel (%)
Place of birth for the foreign-born population - Jordan (%)
Place of birth for the foreign-born population - Kuwait (%)
Place of birth for the foreign-born population - Lebanon (%)
Place of birth for the foreign-born population - Saudi Arabia (%)
Place of birth for the foreign-born population - Syria (%)
Place of birth for the foreign-born population - Turkey (%)
Place of birth for the foreign-born population - Yemen (%)
Place of birth for the foreign-born population - Other Western Asia (%)
Place of birth for the foreign-born population - Eritrea (%)
Place of birth for the foreign-born population - Ethiopia (%)
Place of birth for the foreign-born population - Kenya (%)
Place of birth for the foreign-born population - Somalia (%)
Place of birth for the foreign-born population - Uganda (%)
Place of birth for the foreign-born population - Zimbabwe (%)
Place of birth for the foreign-born population - Other Eastern Africa (%)
Place of birth for the foreign-born population - Cameroon (%)
Place of birth for the foreign-born population - Congo (%)
Place of birth for the foreign-born population - Democratic Republic of Congo (Zaire) (%)
Place of birth for the foreign-born population - Other Middle Africa (%)
Place of birth for the foreign-born population - Egypt (%)
Place of birth for the foreign-born population - Morocco (%)
Place of birth for the foreign-born population - Sudan (%)
Place of birth for the foreign-born population - Other Northern Africa (%)
Place of birth for the foreign-born population - South Africa (%)
Place of birth for the foreign-born population - Other Southern Africa (%)
Place of birth for the foreign-born population - Cabo Verde (%)
Place of birth for the foreign-born population - Ghana (%)
Place of birth for the foreign-born population - Liberia (%)
Place of birth for the foreign-born population - Nigeria (%)
Place of birth for the foreign-born population - Senegal (%)
Place of birth for the foreign-born population - Sierra Leone (%)
Place of birth for the foreign-born population - Other Western Africa (%)
Place of birth for the foreign-born population - Australia (%)
Place of birth for the foreign-born population - New Zealand (%)
Place of birth for the foreign-born population - Fiji (%)
Place of birth for the foreign-born population - Micronesia (%)
Place of birth for the foreign-born population - Bahamas (%)
Place of birth for the foreign-born population - Barbados (%)
Place of birth for the foreign-born population - Cuba (%)
Place of birth for the foreign-born population - Dominica (%)
Place of birth for the foreign-born population - Dominican Republic (%)
Place of birth for the foreign-born population - Grenada (%)
Place of birth for the foreign-born population - Haiti (%)
Place of birth for the foreign-born population - Jamaica (%)
Place of birth for the foreign-born population - St. Vincent and the Grenadines (%)
Place of birth for the foreign-born population - Trinidad and Tobago (%)
Place of birth for the foreign-born population - West Indies (%)
Place of birth for the foreign-born population - Other Caribbean (%)
Place of birth for the foreign-born population - Belize (%)
Place of birth for the foreign-born population - Costa Rica (%)
Place of birth for the foreign-born population - El Salvador (%)
Place of birth for the foreign-born population - Guatemala (%)
Place of birth for the foreign-born population - Honduras (%)
Place of birth for the foreign-born population - Mexico (%)
Place of birth for the foreign-born population - Nicaragua (%)
Place of birth for the foreign-born population - Panama (%)
Place of birth for the foreign-born population - Other Central America (%)
Place of birth for the foreign-born population - Argentina (%)
Place of birth for the foreign-born population - Bolivia (%)
Place of birth for the foreign-born population - Brazil (%)
Place of birth for the foreign-born population - Chile (%)
Place of birth for the foreign-born population - Colombia (%)
Place of birth for the foreign-born population - Ecuador (%)
Place of birth for the foreign-born population - Guyana (%)
Place of birth for the foreign-born population - Peru (%)
Place of birth for the foreign-born population - Uruguay (%)
Place of birth for the foreign-born population - Venezuela (%)
Place of birth for the foreign-born population - Other South America (%)
Place of birth for the foreign-born population - Canada (%)
Place of birth for the foreign-born population - Other Northern America (%)
Place of birth for the foreign-born population - Other (%)
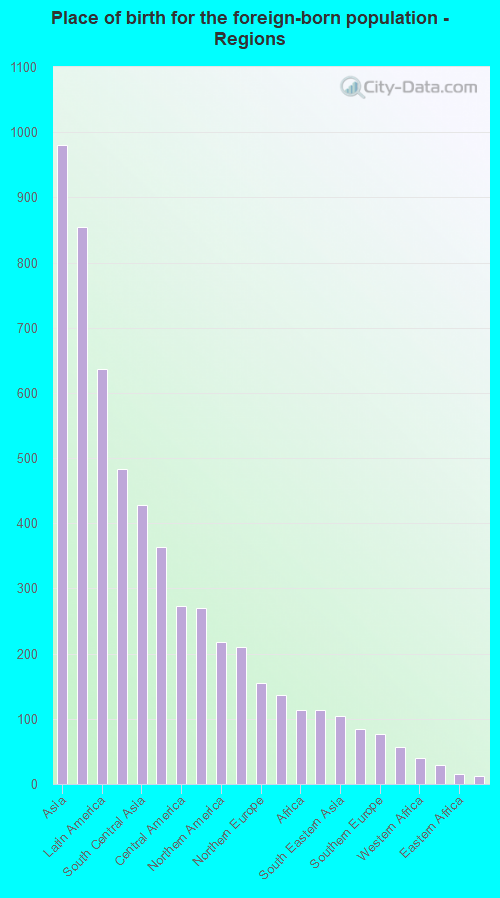
According to 2022 data, the most numerous races in Cottonwood Heights, UT are White alone (28,097 residents), Hispanic (1,827 residents), and Two or more races (1,423 residents). 89.5% of Cottonwood Heights residents speak English at home. 7.4% of Cottonwood Heights, UT residents are foreign-born (2.8% born in Asia, 1.8% born in Latin America, 1.4% born in Europe), which is 8.5% less than the foreign-born rate of 8.0% across the entire state of Utah.
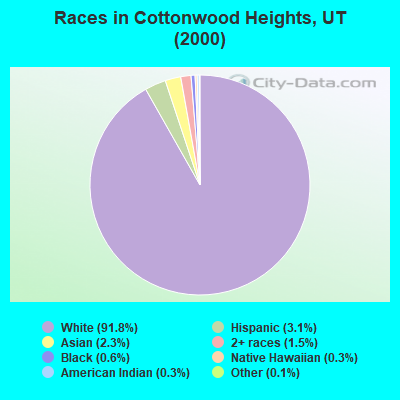
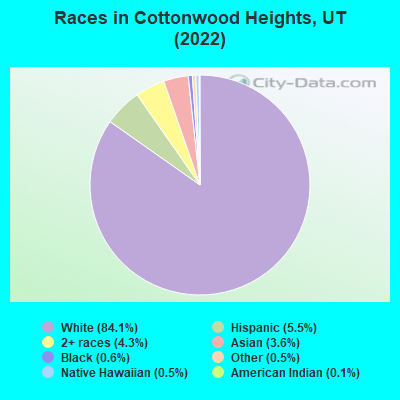
Race distribution in Cottonwood Heights
2000 2022
1,904,265 85.3% White alone 201,559 9.0% Hispanic 36,483 1.6% Asian alone 31,308 1.4% Two or more races 26,663 1.2% American Indian alone 14,806 0.7% Native Hawaiian and Other 16,137 0.7% Black alone 1,948 0.09% Other race alone
2,557,466 75.6% White alone 512,086 15.1% Hispanic 119,308 3.5% Two or more races 82,388 2.4% Asian alone 36,978 1.1% Native Hawaiian and Other 34,873 1.0% Black alone 22,803 0.7% American Indian alone 14,898 0.4% Other race alone
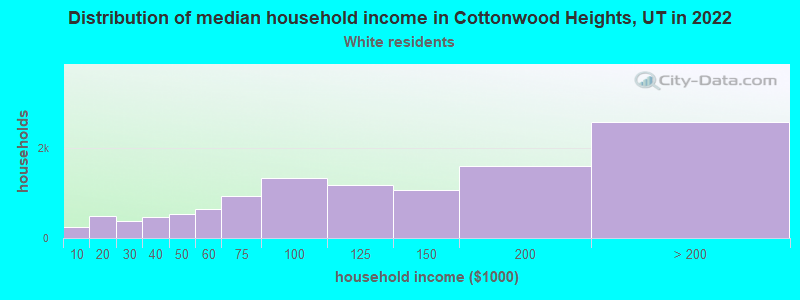
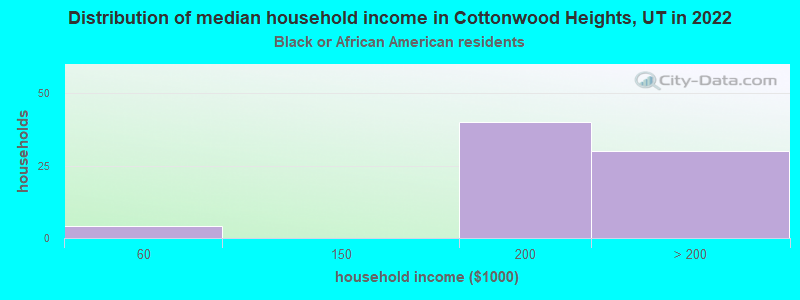
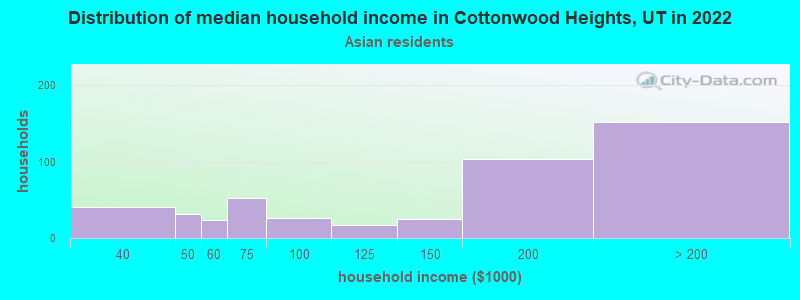
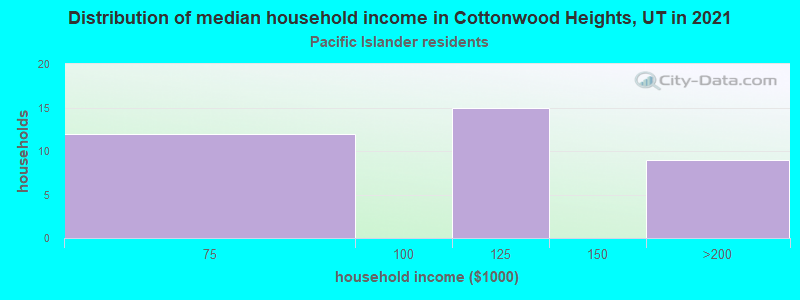
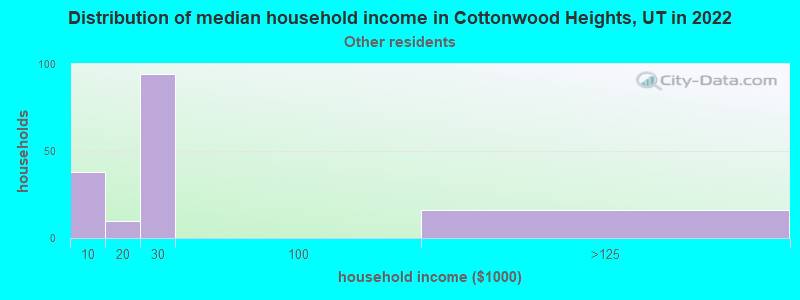
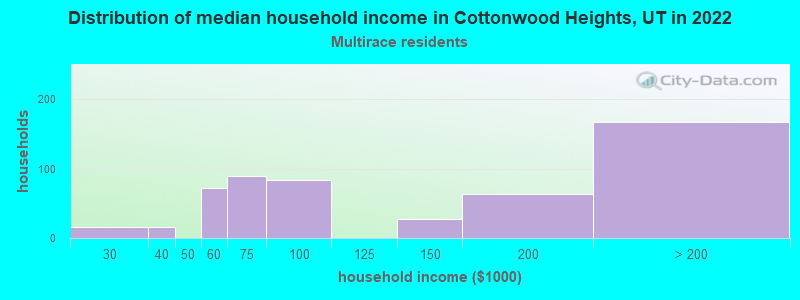
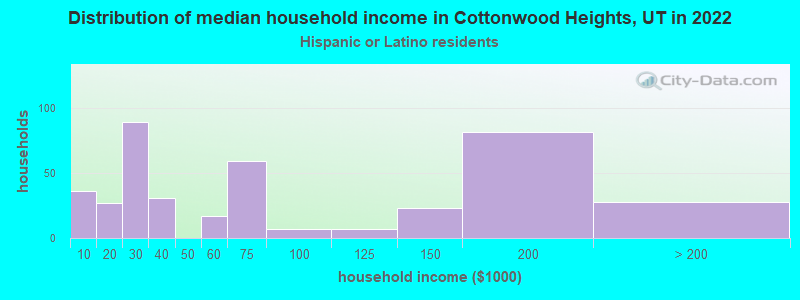
Income and house value in Cottonwood Heights Median household income in 2022 $112,660 White non-Hispanic householders$160,563 Asian householders$170,959 Native Hawaiian and other Pacific Islander householders$23,594 Some other race householders$93,926 Two or more races householders$60,940 Hispanic or Latino race householdersMedian 2022 house value $687,220 White Non-Hispanic householders$405,626 Black or African American householders$405,626 American Indian or Alaska Native householders $699,840 Asian householders$500,812 Some other race householders$532,541 Two or more races householders$603,210 Hispanic or Latino householders
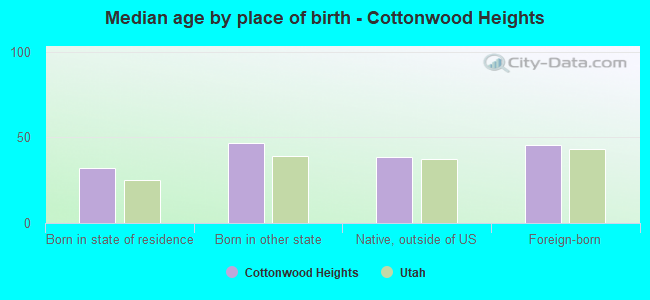
Median age by race in Cottonwood Heights
42.5 Median age for White residents43.1 42.0 34.1 Median age for Black or African American residents30.4 39.0 36.7 Median age for American Indian / Alaska Native residents-719,077,567.4 -660,587,638.7 40.3 Median age for Asian residents37.9 40.7 27.4 Median age for Native Hawaiian / Pacific Islander residents25.8 37.1 35.5 Median age for Other race residents38.2 31.8 22.4 Median age for Two or more races residents20.7 25.1 42.6 Median age for White alone residents43.0 42.3 24.0 Median age for Hispanic or Latino residents28.5 21.8
Owner/renter occupied households by race in Cottonwood Heights
House owners and renters - White residents 8,281 72.6% Owner occupied3,118 27.4% Renter occupiedHouse owners and renters - Black or African American residents 9 13.0% Owner occupied63 87.0% Renter occupiedHouse owners and renters - American Indian / Alaska Native residents 12 100.0% Renter occupiedHouse owners and renters - Asian residents 375 81.4% Owner occupied86 18.6% Renter occupiedHouse owners and renters - Native Hawaiian / Pacific Islander residents 88 100.0% Renter occupiedHouse owners and renters - Other race residents 26 23.9% Owner occupied84 76.1% Renter occupiedHouse owners and renters - Two or more races residents 334 70.4% Owner occupied140 29.6% Renter occupiedHouse owners and renters - White alone residents 8,299 72.5% Owner occupied3,149 27.5% Renter occupiedHouse owners and renters - Hispanic or Latino residents 181 46.6% Owner occupied207 53.4% Renter occupied
Language usage in Cottonwood Heights
English speakers - Total 89.5% of residents of Cottonwood Heights speak English at home.
2.7% of residents speak Spanish at home 604 71.6% Speak English very well239 28.4% Speak English less than very well7.5% of residents speak other language at home 2,039 85.3% Speak English very well350 14.7% Speak English less than very well
English speakers - Born in the United States 93.8% of residents of Cottonwood Heights speak English at home.
1.8% of residents speak Spanish at home 180 82.6% Speak English very well38 17.4% Speak English less than very well3.8% of residents speak other language at home 415 89.4% Speak English very well49 10.6% Speak English less than very well
English speakers - Native, born elsewhere 79.4% of residents of Cottonwood Heights speak English at home.
12.5% of residents speak Spanish at home 43 100.0% Speak English very well
English speakers - Foreign-born 36.3% of residents of Cottonwood Heights speak English at home.
15.2% of residents speak Spanish at home 168 46.0% Speak English very well197 54.0% Speak English less than very well48.3% of residents speak other language at home 933 80.3% Speak English very well229 19.7% Speak English less than very well
White (Caucasian) - Speak only English Native:
96.7% (25,153)Foreign-born:
60.5% (516)
White (Caucasian) - Speak another language Native:
3.5% (906)Foreign-born:
45.9% (391)
Black or African American - Speak another language Native:
7.5% (10)Foreign-born:
92.8% (44)
American Indian / Alaska Native - Speak only English Native:
81.3% (37)Foreign-born:
100.0% (20)
Asian - Speak only English Native:
64.5% (331)Foreign-born:
22.0% (143)
Asian - Speak another language Native:
32.3% (165)Foreign-born:
79.0% (512)
Native Hawaiian / Pacific Islander - Speak another language Native:
46.7% (101)Foreign-born:
100.0% (16)
Other race - Speak only English Native:
57.5% (81)Foreign-born:
25.6% (87)
Other race - Speak another language Native:
35.6% (50)Foreign-born:
81.9% (278)
Two or more races - Speak only English Native:
86.4% (1,590)Foreign-born:
24.3% (59)
Two or more races - Speak another language Native:
13.5% (249)Foreign-born:
64.0% (156)
White alone - Speak only English Native:
96.0% (24,817)Foreign-born:
49.2% (533)
White alone - Speak another language Native:
4.0% (1,042)Foreign-born:
49.4% (535)
Hispanic or Latino - Speak only English Native:
81.5% (945)Foreign-born:
22.6% (110)
Hispanic or Latino - Speak another language Native:
20.6% (238)Foreign-born:
80.8% (394)
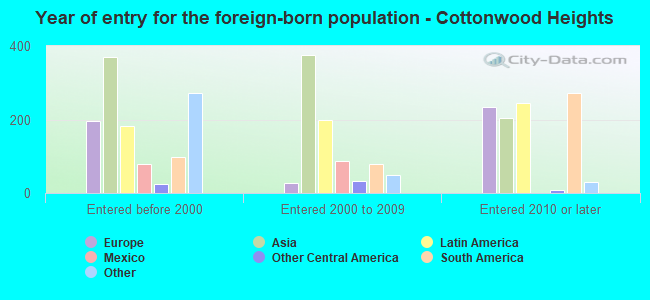
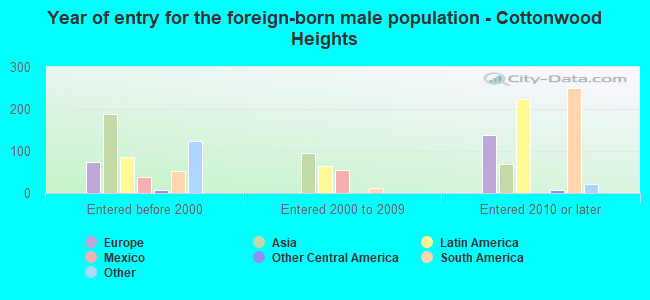
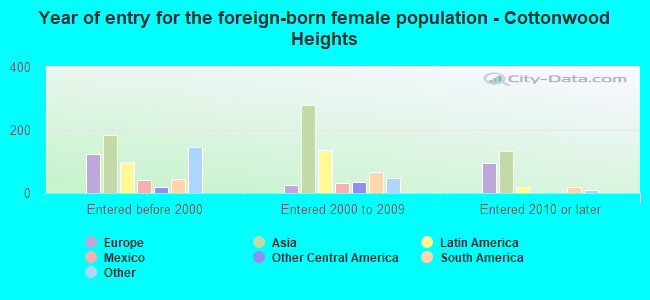
Foreign-born residents in Cottonwood Heights 2,464 residents are foreign born (2.8% Asia , 1.8% Latin America , 1.4% Europe ).
Marital status for residents in Cottonwood Heights Marital status - White (Caucasian) population 15 years and over
Males 30.1% Never married58.4% Now married0.6% Separated1.8% Widowed9.1% DivorcedFemales 21.8% Never married57.8% Now married1.0% Separated6.1% Widowed13.3% DivorcedWomen who gave birth in the past 12 months Now married:
99.1% (312)Unmarried:
0.9% (3)
Women who did not give birth in the past 12 months Now married:
50.2% (3,058)Unmarried:
49.8% (3,033)
Marital status - Black or African American population 15 years and over
Males 52.8% Never married19.1% Now married0.0% Separated0.0% Widowed28.1% DivorcedFemales 0.0% Never married15.9% Now married55.1% Separated0.0% Widowed29.0% DivorcedWomen who did not give birth in the past 12 months Now married:
77.6% (43)Unmarried:
22.4% (12)
Marital status - American Indian / Alaska Native population 15 years and over
Males 56.5% Never married0.0% Now married0.0% Separated0.0% Widowed43.5% DivorcedFemales 0.0% Never married53.3% Now married0.0% Separated0.0% Widowed46.7% DivorcedWomen who did not give birth in the past 12 months Now married:
100.0% (21)Unmarried:
0.0% (0)
Marital status - Asian population 15 years and over
Males 29.6% Never married59.6% Now married3.0% Separated3.7% Widowed4.2% DivorcedFemales 33.0% Never married40.5% Now married5.0% Separated7.6% Widowed13.9% DivorcedWomen who gave birth in the past 12 months Now married:
100.0% (6)Unmarried:
0.0% (0)
Women who did not give birth in the past 12 months Now married:
40.8% (162)Unmarried:
59.2% (236)
Marital status - Native Hawaiian / Pacific Islander population 15 years and over
Males 55.1% Never married21.7% Now married0.0% Separated0.0% Widowed23.2% DivorcedFemales 0.0% Never married29.8% Now married0.0% Separated0.0% Widowed70.2% DivorcedWomen who did not give birth in the past 12 months Now married:
29.8% (20)Unmarried:
70.2% (46)
Marital status - Other race population 15 years and over
Males 22.0% Never married70.3% Now married4.4% Separated0.0% Widowed3.3% DivorcedFemales 32.8% Never married67.2% Now married0.0% Separated0.0% Widowed0.0% DivorcedWomen who gave birth in the past 12 months Now married:
100.0% (77)Unmarried:
0.0% (0)
Women who did not give birth in the past 12 months Now married:
37.8% (49)Unmarried:
62.2% (81)
Marital status - Two or more races population 15 years and over
Males 59.2% Never married30.9% Now married0.0% Separated2.2% Widowed7.7% DivorcedFemales 38.0% Never married43.3% Now married7.2% Separated5.3% Widowed6.2% DivorcedWomen who gave birth in the past 12 months Now married:
100.0% (38)Unmarried:
0.0% (0)
Women who did not give birth in the past 12 months Now married:
36.7% (156)Unmarried:
63.3% (269)
Marital status - White alone, not Hispanic / Latino population 15 years and over
Males 30.1% Never married58.3% Now married0.6% Separated1.8% Widowed9.2% DivorcedFemales 20.9% Never married58.5% Now married1.0% Separated6.3% Widowed13.3% DivorcedWomen who gave birth in the past 12 months Now married:
99.1% (319)Unmarried:
0.9% (3)
Women who did not give birth in the past 12 months Now married:
51.3% (3,061)Unmarried:
48.7% (2,903)
Marital status - Hispanic or Latino population 15 years and over
Males 33.4% Never married58.3% Now married1.6% Separated0.0% Widowed6.7% DivorcedFemales 39.1% Never married44.7% Now married5.0% Separated2.3% Widowed8.9% DivorcedWomen who gave birth in the past 12 months Now married:
100.0% (31)Unmarried:
0.0% (0)
Women who did not give birth in the past 12 months Now married:
33.5% (161)Unmarried:
66.5% (320)
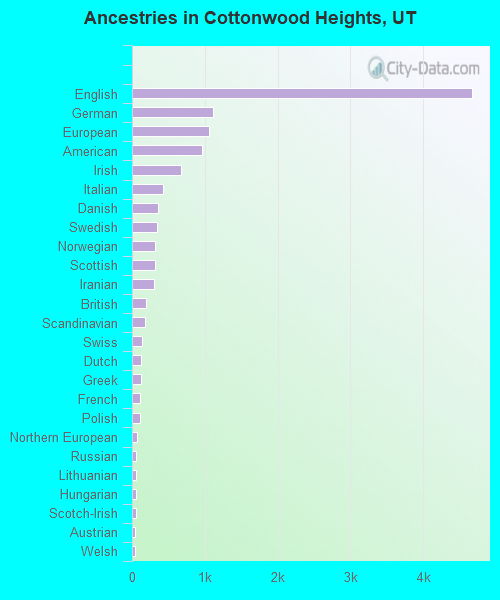
Ancestries in Cottonwood Heights
4,669 29.0% English1,117 6.9% German1,064 6.6% European968 6.0% American677 4.2% Irish428 2.7% Italian356 2.2% Danish347 2.2% Swedish322 2.0% Norwegian314 1.9% Scottish302 1.9% Iranian186 1.2% British175 1.1% Scandinavian141 0.9% Swiss122 0.8% Dutch118 0.7% Greek108 0.7% French106 0.7% Polish71 0.4% Northern European58 0.4% Russian56 0.3% Lithuanian51 0.3% Hungarian50 0.3% Scotch-Irish48 0.3% Austrian46 0.3% Welsh37 0.2% Brazilian36 0.2% Slovene36 0.2% Liberian32 0.2% Canadian27 0.2% South African25 0.2% Czech25 0.2% French Canadian21 0.1% Finnish19 0.1% Lebanese18 0.1% Basque16 0.10% Celtic16 0.10% Ugandan16 0.10% Romanian15 0.09% Armenian13 0.08% Eastern European10 0.06% African9 0.06% New Zealander9 0.06% Iraqi9 0.06% Croatian
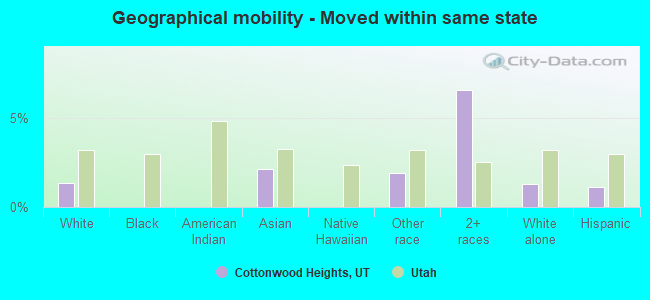
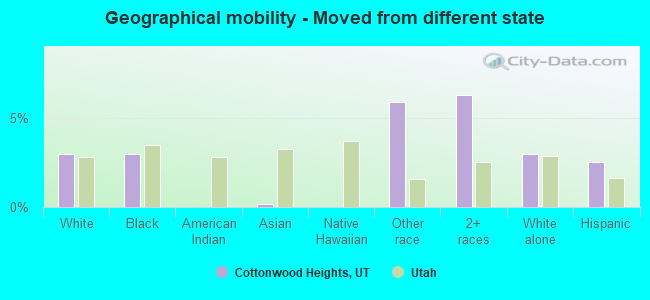
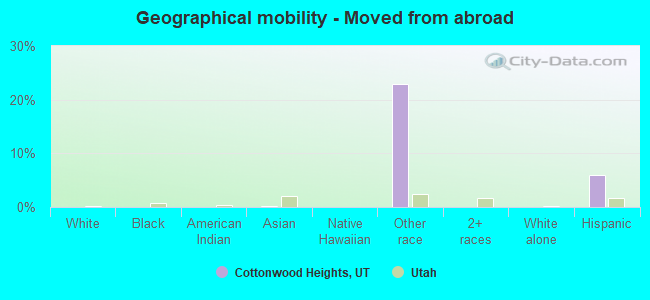
Geographical mobility in Cottonwood Heights Same house 1 year ago 24,324 87.8% White (Caucasian)202 100.0% Black or African American39 70.0% American Indian / Alaska Native1,089 91.3% Asian190 87.9% Native Hawaiian / Pacific Islander427 79.3% Other race1,952 83.6% Two or more races24,544 88.2% White alone, not Hispanic / Latino1,467 82.0% Hispanic or LatinoMoved within same county 2,192 7.9% White / Caucasian13 22.6% American Indian / Alaska Native88 7.4% Asian76 3.2% Two or more races2,118 7.6% White alone, not Hispanic / Latino160 8.9% Hispanic or LatinoMoved within same state 371 1.3% White / Caucasian25 2.1% Asian10 1.9% Other race152 6.5% Two or more races353 1.3% White alone, not Hispanic / Latino20 1.1% Hispanic or LatinoMoved from different state 819 3.0% White / Caucasian6 3.0% Black or African American2 0.2% Asian32 5.9% Other race147 6.3% Two or more races819 2.9% White alone, not Hispanic / Latino45 2.5% Hispanic or LatinoMoved from abroad 9 0.0% White2 0.2% Asian123 22.8% Other race9 0.0% White alone, not Hispanic / Latino108 6.0% Hispanic or Latino
Children Nativity (place of birth) in Cottonwood Heights
Children under 6 years - Living with two parents Both parents native 1,141 100.0% NativeBoth parents foreign-born 58 71.0% Native23 29.0% Foreign-bornOne native, one foreign-born parent 299 100.0% NativeChildren under 6 years - Living with one parent Native parent 425 100.0% NativeForeign-born parent 30 100.0% NativeChildren 6 to 17 years - Living with two parents Both parents native 3,105 100.0% NativeBoth parents foreign-born 152 75.2% Native50 24.8% Foreign-bornOne native, one foreign-born parent 370 100.0% NativeChildren 6 to 17 years - Living with one parent Native parent 891 100.0% NativeForeign-born parent 186 51.5% Native175 48.5% Foreign-born
Grandparents responsible for own grandchildren in Cottonwood Heights
Grandparents (30 to 59 years) White / Caucasian 7 18.0% Responsible for grandchildren32 82.0% Not responsible for grandchildrenBlack or African American 11 100.0% Not responsible for grandchildrenAsian 28 100.0% Responsible for grandchildrenNative Hawaiian / Pacific Islander 55 100.0% Not responsible for grandchildrenTwo or more races 23 100.0% Not responsible for grandchildrenWhite alone, not Hispanic / Latino 9 19.7% Responsible for grandchildren35 80.3% Not responsible for grandchildrenGrandparents (60 years and over) White / Caucasian 132 48.4% Responsible for grandchildren141 51.6% Not responsible for grandchildrenAsian 19 100.0% Not responsible for grandchildrenWhite alone, not Hispanic / Latino 133 47.5% Responsible for grandchildren147 52.5% Not responsible for grandchildren