Races in Cottage Grove, Minnesota (MN) Detailed Stats
Data:
Races - White alone (%)
Races - White alone (% change since 2000)
Races - Black alone (%)
Races - Black alone (% change since 2000)
Races - American Indian alone (%)
Races - American Indian alone (% change since 2000)
Races - Asian alone (%)
Races - Asian alone (% change since 2000)
Races - Hispanic (%)
Races - Hispanic (% change since 2000)
Races - Native Hawaiian and Other Pacific Islander alone (%)
Races - Native Hawaiian and Other Pacific Islander alone (% change since 2000)
Races - Two or more races(%)
Races - Two or more races(% change since 2000)
Races - Other race alone (%)
Races - Other race alone (% change since 2000)
Racial diversity
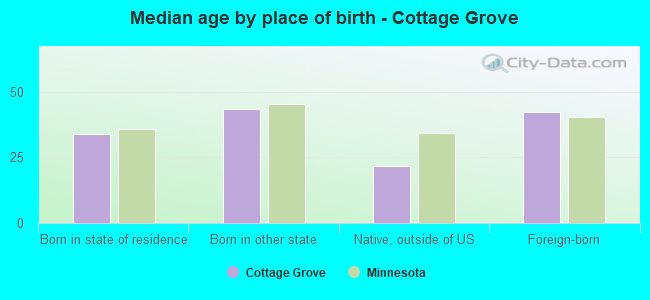
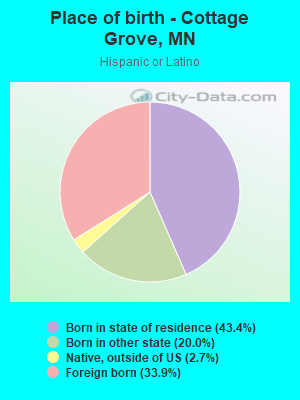
Place of birth - Born in state of residence (%)
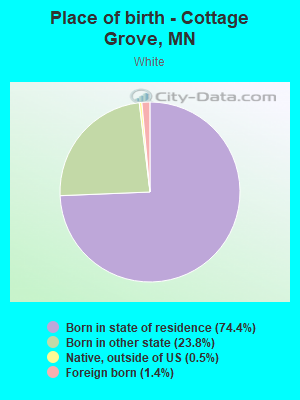
Place of birth - Born in state of residence (%) - White
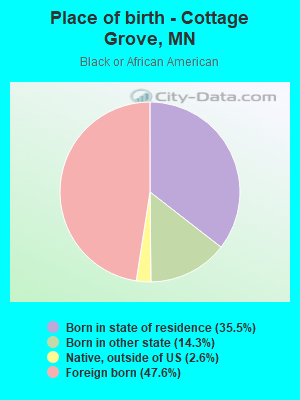
Place of birth - Born in state of residence (%) - Black or African American
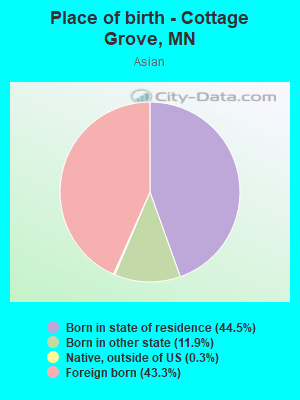
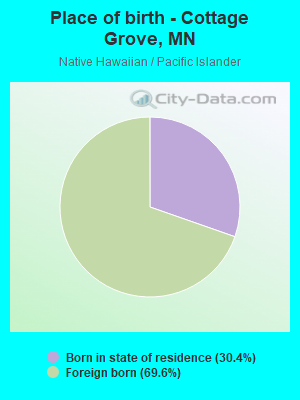
Place of birth - Born in state of residence (%) - Asian
Place of birth - Born in state of residence (%) - Hispanic or Latino
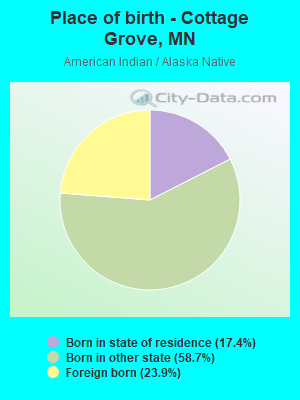
Place of birth - Born in state of residence (%) - American Indian and Alaska Native
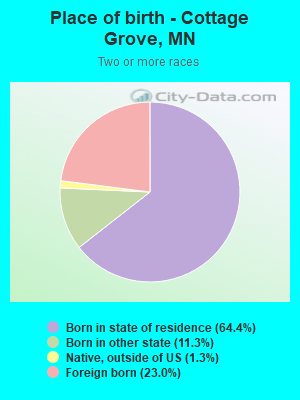
Place of birth - Born in state of residence (%) - Multirace
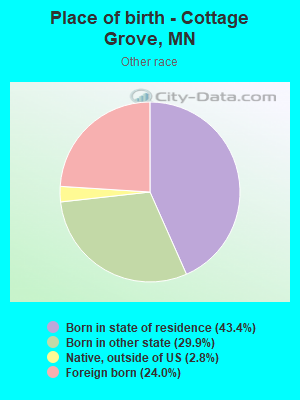
Place of birth - Born in state of residence (%) - Other Race
Place of birth - Born in other state (%)
Place of birth - Born in other state (%) - White
Place of birth - Born in other state (%) - Black or African American
Place of birth - Born in other state (%) - Asian
Place of birth - Born in other state (%) - Hispanic or Latino
Place of birth - Born in other state (%) - American Indian and Alaska Native
Place of birth - Born in other state (%) - Multirace
Place of birth - Born in other state (%) - Other Race
Place of birth - Native, outside of US (%)
Place of birth - Native, outside of US (%) - White
Place of birth - Native, outside of US (%) - Black or African American
Place of birth - Native, outside of US (%) - Asian
Place of birth - Native, outside of US (%) - Hispanic or Latino
Place of birth - Native, outside of US (%) - American Indian and Alaska Native
Place of birth - Native, outside of US (%) - Multirace
Place of birth - Native, outside of US (%) - Other Race
Place of birth - Foreign born (%)
Place of birth - Foreign born (%) - White
Place of birth - Foreign born (%) - Black or African American
Place of birth - Foreign born (%) - Asian
Place of birth - Foreign born (%) - Hispanic or Latino
Place of birth - Foreign born (%) - American Indian and Alaska Native
Place of birth - Foreign born (%) - Multirace
Place of birth - Foreign born (%) - Other Race
Residents speaking English at home (%)
Residents speaking English at home - Born in the United States (%)
Residents speaking English at home - Native, born elsewhere (%)
Residents speaking English at home - Foreign born (%)
Residents speaking Spanish at home (%)
Residents speaking Spanish at home - Born in the United States (%)
Residents speaking Spanish at home - Native, born elsewhere (%)
Residents speaking Spanish at home - Foreign born (%)
Residents speaking other language at home (%)
Residents speaking other language at home - Born in the United States (%)
Residents speaking other language at home - Native, born elsewhere (%)
Residents speaking other language at home - Foreign born (%)
Marital status - Never married (%)
Marital status - Now married (%)
Marital status - Separated (%)
Marital status - Widowed (%)
Marital status - Divorced (%)
Ancestries Reported - Arab (%)
Ancestries Reported - Czech (%)
Ancestries Reported - Danish (%)
Ancestries Reported - Dutch (%)
Ancestries Reported - English (%)
Ancestries Reported - French (%)
Ancestries Reported - French Canadian (%)
Ancestries Reported - German (%)
Ancestries Reported - Greek (%)
Ancestries Reported - Hungarian (%)
Ancestries Reported - Irish (%)
Ancestries Reported - Italian (%)
Ancestries Reported - Lithuanian (%)
Ancestries Reported - Norwegian (%)
Ancestries Reported - Polish (%)
Ancestries Reported - Portuguese (%)
Ancestries Reported - Russian (%)
Ancestries Reported - Scotch-Irish (%)
Ancestries Reported - Scottish (%)
Ancestries Reported - Slovak (%)
Ancestries Reported - Subsaharan African (%)
Ancestries Reported - Swedish (%)
Ancestries Reported - Swiss (%)
Ancestries Reported - Ukrainian (%)
Ancestries Reported - United States (%)
Ancestries Reported - Welsh (%)
Ancestries Reported - West Indian (%)
Ancestries Reported - Other (%)
Geographical mobility - Same house 1 year ago (%)
Geographical mobility - Same house 1 year ago (%) - White
Geographical mobility - Same house 1 year ago (%) - Black or African American
Geographical mobility - Same house 1 year ago (%) - Asian
Geographical mobility - Same house 1 year ago (%) - Hispanic or Latino
Geographical mobility - Same house 1 year ago (%) - American Indian and Alaska Native
Geographical mobility - Same house 1 year ago (%) - Multirace
Geographical mobility - Same house 1 year ago (%) - Other Race
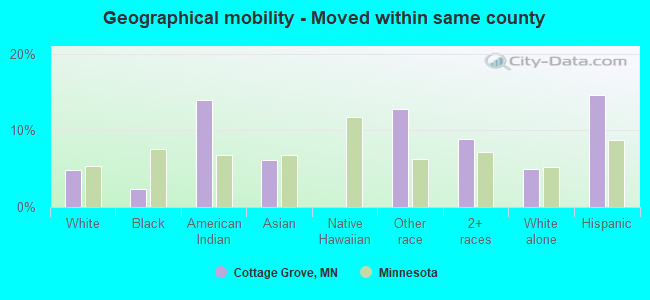
Geographical mobility - Moved within same county (%)
Geographical mobility - Moved within same county (%) - White
Geographical mobility - Moved within same county (%) - Black or African American
Geographical mobility - Moved within same county (%) - Asian
Geographical mobility - Moved within same county (%) - Hispanic or Latino
Geographical mobility - Moved within same county (%) - American Indian and Alaska Native
Geographical mobility - Moved within same county (%) - Multirace
Geographical mobility - Moved within same county (%) - Other Race
Geographical mobility - Moved from different county within same state (%)
Geographical mobility - Moved from different county within same state (%) - White
Geographical mobility - Moved from different county within same state (%) - Black or African American
Geographical mobility - Moved from different county within same state (%) - Asian
Geographical mobility - Moved from different county within same state (%) - Hispanic or Latino
Geographical mobility - Moved from different county within same state (%) - American Indian and Alaska Native
Geographical mobility - Moved from different county within same state (%) - Multirace
Geographical mobility - Moved from different county within same state (%) - Other Race
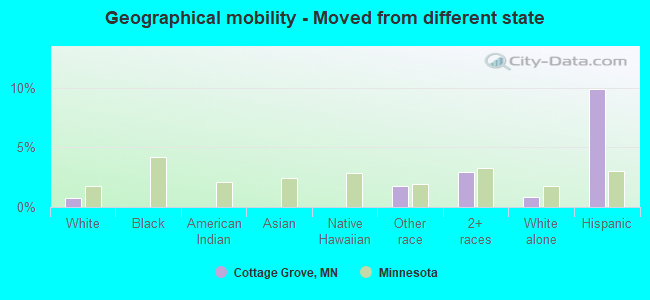
Geographical mobility - Moved from different state (%)
Geographical mobility - Moved from different state (%) - White
Geographical mobility - Moved from different state (%) - Black or African American
Geographical mobility - Moved from different state (%) - Asian
Geographical mobility - Moved from different state (%) - Hispanic or Latino
Geographical mobility - Moved from different state (%) - American Indian and Alaska Native
Geographical mobility - Moved from different state (%) - Multirace
Geographical mobility - Moved from different state (%) - Other Race
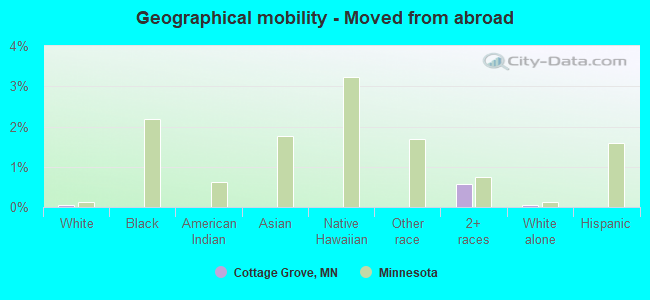
Geographical mobility - Moved from abroad (%)
Geographical mobility - Moved from abroad (%) - White
Geographical mobility - Moved from abroad (%) - Black or African American
Geographical mobility - Moved from abroad (%) - Asian
Geographical mobility - Moved from abroad (%) - Hispanic or Latino
Geographical mobility - Moved from abroad (%) - American Indian and Alaska Native
Geographical mobility - Moved from abroad (%) - Multirace
Geographical mobility - Moved from abroad (%) - Other Race
Place of birth for the foreign-born population - Ireland (%)
Place of birth for the foreign-born population - Denmark (%)
Place of birth for the foreign-born population - Norway (%)
Place of birth for the foreign-born population - Sweden (%)
Place of birth for the foreign-born population - United Kingdom (%)
Place of birth for the foreign-born population - England (%)
Place of birth for the foreign-born population - Scotland (%)
Place of birth for the foreign-born population - Other Northern Europe (%)
Place of birth for the foreign-born population - Austria (%)
Place of birth for the foreign-born population - Belgium (%)
Place of birth for the foreign-born population - France (%)
Place of birth for the foreign-born population - Germany (%)
Place of birth for the foreign-born population - Netherlands (%)
Place of birth for the foreign-born population - Switzerland (%)
Place of birth for the foreign-born population - Other Western Europe (%)
Place of birth for the foreign-born population - Greece (%)
Place of birth for the foreign-born population - Italy (%)
Place of birth for the foreign-born population - Portugal (%)
Place of birth for the foreign-born population - Spain (%)
Place of birth for the foreign-born population - Other Southern Europe (%)
Place of birth for the foreign-born population - Albania (%)
Place of birth for the foreign-born population - Belarus (%)
Place of birth for the foreign-born population - Bosnia and Herzegovina (%)
Place of birth for the foreign-born population - Bulgaria (%)
Place of birth for the foreign-born population - Croatia (%)
Place of birth for the foreign-born population - Czechoslovakia (%)
Place of birth for the foreign-born population - Hungary (%)
Place of birth for the foreign-born population - Latvia (%)
Place of birth for the foreign-born population - Lithuania (%)
Place of birth for the foreign-born population - North Macedonia (Macedonia) (%)
Place of birth for the foreign-born population - Moldova (%)
Place of birth for the foreign-born population - Poland (%)
Place of birth for the foreign-born population - Romania (%)
Place of birth for the foreign-born population - Russia (%)
Place of birth for the foreign-born population - Serbia (%)
Place of birth for the foreign-born population - Ukraine (%)
Place of birth for the foreign-born population - Other Eastern Europe (%)
Place of birth for the foreign-born population - China (%)
Place of birth for the foreign-born population - Hong Kong (%)
Place of birth for the foreign-born population - Taiwan (%)
Place of birth for the foreign-born population - Japan (%)
Place of birth for the foreign-born population - Korea (%)
Place of birth for the foreign-born population - Other Eastern Asia (%)
Place of birth for the foreign-born population - Afghanistan (%)
Place of birth for the foreign-born population - Bangladesh (%)
Place of birth for the foreign-born population - India (%)
Place of birth for the foreign-born population - Iran (%)
Place of birth for the foreign-born population - Kazakhstan (%)
Place of birth for the foreign-born population - Nepal (%)
Place of birth for the foreign-born population - Pakistan (%)
Place of birth for the foreign-born population - Sri Lanka (%)
Place of birth for the foreign-born population - Uzbekistan (%)
Place of birth for the foreign-born population - Other South Central Asia (%)
Place of birth for the foreign-born population - Burma (%)
Place of birth for the foreign-born population - Cambodia (%)
Place of birth for the foreign-born population - Indonesia (%)
Place of birth for the foreign-born population - Laos (%)
Place of birth for the foreign-born population - Malaysia (%)
Place of birth for the foreign-born population - Philippines (%)
Place of birth for the foreign-born population - Singapore (%)
Place of birth for the foreign-born population - Thailand (%)
Place of birth for the foreign-born population - Vietnam (%)
Place of birth for the foreign-born population - Other South Eastern Asia (%)
Place of birth for the foreign-born population - Armenia (%)
Place of birth for the foreign-born population - Iraq (%)
Place of birth for the foreign-born population - Israel (%)
Place of birth for the foreign-born population - Jordan (%)
Place of birth for the foreign-born population - Kuwait (%)
Place of birth for the foreign-born population - Lebanon (%)
Place of birth for the foreign-born population - Saudi Arabia (%)
Place of birth for the foreign-born population - Syria (%)
Place of birth for the foreign-born population - Turkey (%)
Place of birth for the foreign-born population - Yemen (%)
Place of birth for the foreign-born population - Other Western Asia (%)
Place of birth for the foreign-born population - Eritrea (%)
Place of birth for the foreign-born population - Ethiopia (%)
Place of birth for the foreign-born population - Kenya (%)
Place of birth for the foreign-born population - Somalia (%)
Place of birth for the foreign-born population - Uganda (%)
Place of birth for the foreign-born population - Zimbabwe (%)
Place of birth for the foreign-born population - Other Eastern Africa (%)
Place of birth for the foreign-born population - Cameroon (%)
Place of birth for the foreign-born population - Congo (%)
Place of birth for the foreign-born population - Democratic Republic of Congo (Zaire) (%)
Place of birth for the foreign-born population - Other Middle Africa (%)
Place of birth for the foreign-born population - Egypt (%)
Place of birth for the foreign-born population - Morocco (%)
Place of birth for the foreign-born population - Sudan (%)
Place of birth for the foreign-born population - Other Northern Africa (%)
Place of birth for the foreign-born population - South Africa (%)
Place of birth for the foreign-born population - Other Southern Africa (%)
Place of birth for the foreign-born population - Cabo Verde (%)
Place of birth for the foreign-born population - Ghana (%)
Place of birth for the foreign-born population - Liberia (%)
Place of birth for the foreign-born population - Nigeria (%)
Place of birth for the foreign-born population - Senegal (%)
Place of birth for the foreign-born population - Sierra Leone (%)
Place of birth for the foreign-born population - Other Western Africa (%)
Place of birth for the foreign-born population - Australia (%)
Place of birth for the foreign-born population - New Zealand (%)
Place of birth for the foreign-born population - Fiji (%)
Place of birth for the foreign-born population - Micronesia (%)
Place of birth for the foreign-born population - Bahamas (%)
Place of birth for the foreign-born population - Barbados (%)
Place of birth for the foreign-born population - Cuba (%)
Place of birth for the foreign-born population - Dominica (%)
Place of birth for the foreign-born population - Dominican Republic (%)
Place of birth for the foreign-born population - Grenada (%)
Place of birth for the foreign-born population - Haiti (%)
Place of birth for the foreign-born population - Jamaica (%)
Place of birth for the foreign-born population - St. Vincent and the Grenadines (%)
Place of birth for the foreign-born population - Trinidad and Tobago (%)
Place of birth for the foreign-born population - West Indies (%)
Place of birth for the foreign-born population - Other Caribbean (%)
Place of birth for the foreign-born population - Belize (%)
Place of birth for the foreign-born population - Costa Rica (%)
Place of birth for the foreign-born population - El Salvador (%)
Place of birth for the foreign-born population - Guatemala (%)
Place of birth for the foreign-born population - Honduras (%)
Place of birth for the foreign-born population - Mexico (%)
Place of birth for the foreign-born population - Nicaragua (%)
Place of birth for the foreign-born population - Panama (%)
Place of birth for the foreign-born population - Other Central America (%)
Place of birth for the foreign-born population - Argentina (%)
Place of birth for the foreign-born population - Bolivia (%)
Place of birth for the foreign-born population - Brazil (%)
Place of birth for the foreign-born population - Chile (%)
Place of birth for the foreign-born population - Colombia (%)
Place of birth for the foreign-born population - Ecuador (%)
Place of birth for the foreign-born population - Guyana (%)
Place of birth for the foreign-born population - Peru (%)
Place of birth for the foreign-born population - Uruguay (%)
Place of birth for the foreign-born population - Venezuela (%)
Place of birth for the foreign-born population - Other South America (%)
Place of birth for the foreign-born population - Canada (%)
Place of birth for the foreign-born population - Other Northern America (%)
Place of birth for the foreign-born population - Other (%)
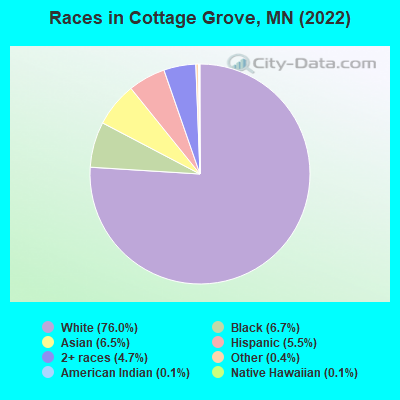
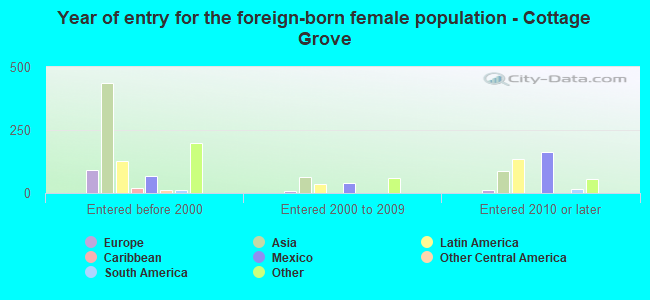
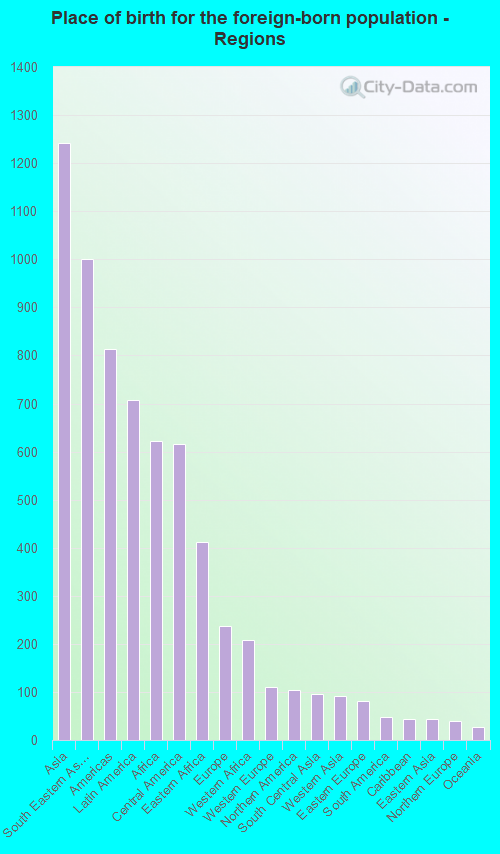
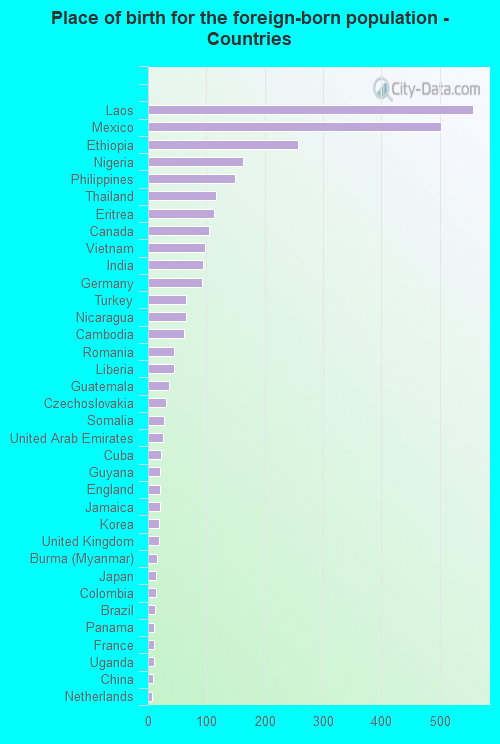
According to 2022 data, the most numerous races in Cottage Grove, MN are White alone (30,658 residents), Black alone (2,684 residents), and Hispanic (2,220 residents). 87.3% of Cottage Grove residents speak English at home. 7.3% of Cottage Grove, MN residents are foreign-born (3.1% born in Asia, 1.7% born in Latin America, 1.5% born in Africa), which is 9.6% less than the foreign-born rate of 8.0% across the entire state of Minnesota.
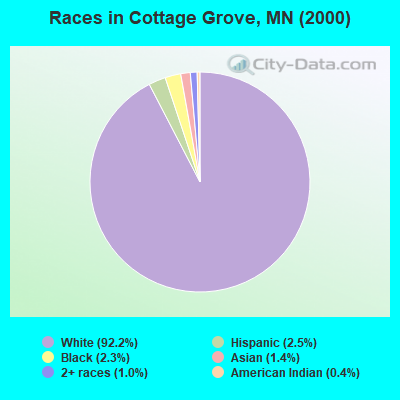
Race distribution in Cottage Grove
2000 2022
4,337,143 88.2% White alone 168,813 3.4% Black alone 143,382 2.9% Hispanic 141,083 2.9% Asian alone 70,304 1.4% Two or more races 52,009 1.1% American Indian alone 5,031 0.1% Other race alone 1,714 0.03% Native Hawaiian and Other
4,356,347 76.2% White alone 395,179 6.9% Black alone 333,830 5.8% Hispanic 294,800 5.2% Asian alone 259,649 4.5% Two or more races 42,125 0.7% American Indian alone 32,976 0.6% Other race alone 2,278 0.04% Native Hawaiian and Other
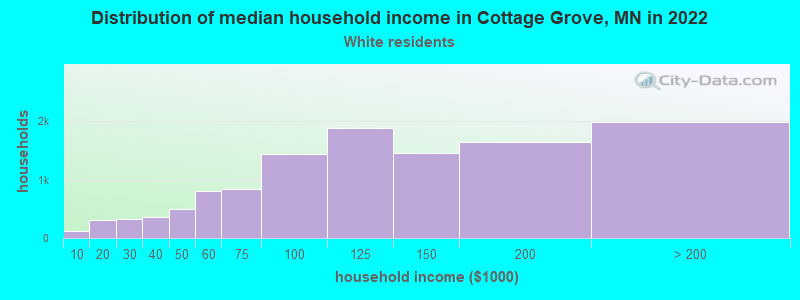
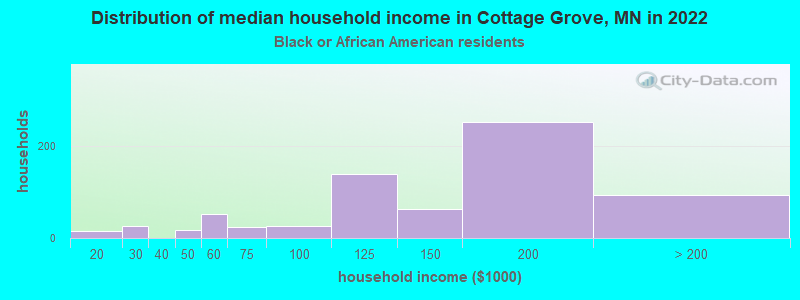
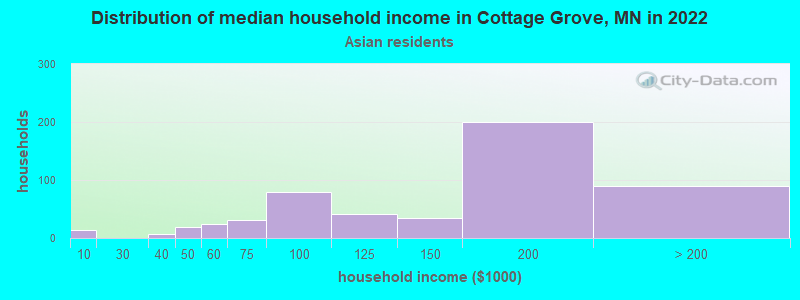
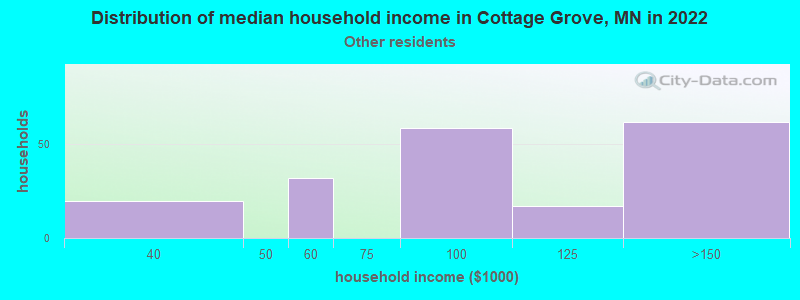
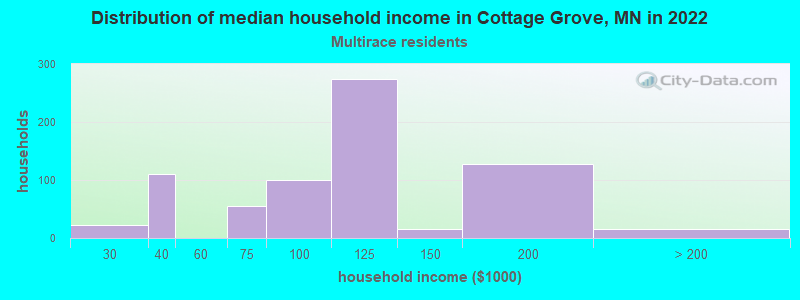
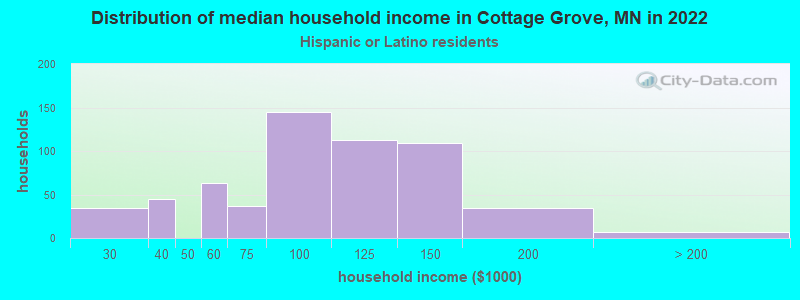
Income and house value in Cottage Grove Median household income in 2022 $110,698 White non-Hispanic householders$112,221 Black householders$189,068 Asian householders$100,252 Some other race householders$101,299 Two or more races householders$109,379 Hispanic or Latino race householdersMedian 2022 house value $362,134 White Non-Hispanic householders$387,417 Black or African American householders$230,185 American Indian or Alaska Native householders $380,570 Asian householders$362,134 Some other race householders$294,184 Two or more races householders$351,072 Hispanic or Latino householders
Median age by race in Cottage Grove
38.7 Median age for White residents39.7 38.1 38.3 Median age for Black or African American residents35.6 41.4 45.8 Median age for American Indian / Alaska Native residents48.1 -539,487,178.9 34.4 Median age for Asian residents32.0 37.1 50.2 Median age for Native Hawaiian / Pacific Islander residents-856,799,036.4 -534,959,349.1 31.8 Median age for Other race residents46.6 19.1 12.2 Median age for Two or more races residents9.8 16.3 38.7 Median age for White alone residents39.7 38.0 33.5 Median age for Hispanic or Latino residents32.0 32.2
Owner/renter occupied households by race in Cottage Grove
House owners and renters - White residents 10,512 89.5% Owner occupied1,231 10.5% Renter occupiedHouse owners and renters - Black or African American residents 496 91.1% Owner occupied49 8.9% Renter occupiedHouse owners and renters - American Indian / Alaska Native residents 11 100.0% Owner occupiedHouse owners and renters - Asian residents 634 97.5% Owner occupied16 2.5% Renter occupiedHouse owners and renters - Other race residents 109 62.9% Owner occupied64 37.1% Renter occupiedHouse owners and renters - Two or more races residents 329 47.9% Owner occupied359 52.1% Renter occupiedHouse owners and renters - White alone residents 10,505 89.8% Owner occupied1,197 10.2% Renter occupiedHouse owners and renters - Hispanic or Latino residents 194 39.8% Owner occupied293 60.2% Renter occupied
Language usage in Cottage Grove
English speakers - Total 87.3% of residents of Cottage Grove speak English at home.
4.0% of residents speak Spanish at home 380 25.1% Speak English very well1,134 74.9% Speak English less than very well9.2% of residents speak other language at home 2,559 73.7% Speak English very well915 26.3% Speak English less than very well
English speakers - Born in the United States 93.8% of residents of Cottage Grove speak English at home.
1.2% of residents speak Spanish at home 60 58.3% Speak English very well43 41.7% Speak English less than very well4.4% of residents speak other language at home 324 85.7% Speak English very well54 14.3% Speak English less than very well
English speakers - Native, born elsewhere 29.1% of residents of Cottage Grove speak English at home.
3.4% of residents speak Spanish at home 11 100.0% Speak English very well57.2% of residents speak other language at home 107 58.5% Speak English very well76 41.5% Speak English less than very well
English speakers - Foreign-born 19.8% of residents of Cottage Grove speak English at home.
21.8% of residents speak Spanish at home 174 23.2% Speak English very well576 76.8% Speak English less than very well63.5% of residents speak other language at home 1,596 73.0% Speak English very well590 27.0% Speak English less than very well
White (Caucasian) - Speak only English Native:
98.5% (28,268)Foreign-born:
75.0% (322)
White (Caucasian) - Speak another language Native:
1.6% (450)Foreign-born:
35.3% (152)
Black or African American - Speak only English Native:
83.3% (909)Foreign-born:
3.3% (39)
Black or African American - Speak another language Native:
5.3% (57)Foreign-born:
88.1% (1,062)
American Indian / Alaska Native - Speak only English Native:
100.0% (19)Foreign-born:
62.1% (4)
Asian - Speak only English Native:
41.8% (570)Foreign-born:
12.0% (139)
Asian - Speak another language Native:
57.9% (789)Foreign-born:
88.8% (1,027)
Native Hawaiian / Pacific Islander - Speak another language Native:
84.8% (22)Foreign-born:
91.2% (51)
Other race - Speak only English Native:
45.1% (243)Foreign-born:
10.7% (16)
Other race - Speak another language Native:
56.5% (304)Foreign-born:
87.7% (133)
Two or more races - Speak only English Native:
78.8% (1,840)Foreign-born:
10.7% (85)
Two or more races - Speak another language Native:
19.9% (464)Foreign-born:
92.8% (738)
White alone - Speak only English Native:
98.3% (28,042)Foreign-born:
71.8% (290)
White alone - Speak another language Native:
1.7% (481)Foreign-born:
34.1% (138)
Hispanic or Latino - Speak only English Native:
59.1% (790)Foreign-born:
9.5% (65)
Hispanic or Latino - Speak another language Native:
41.1% (550)Foreign-born:
90.5% (621)
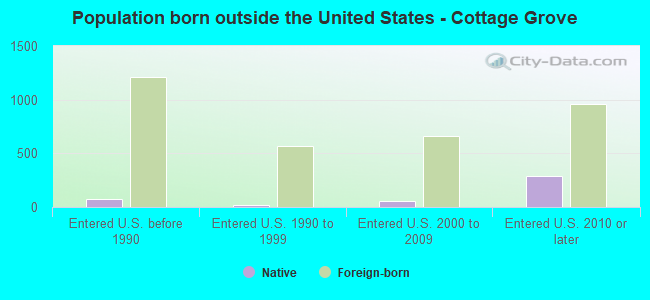
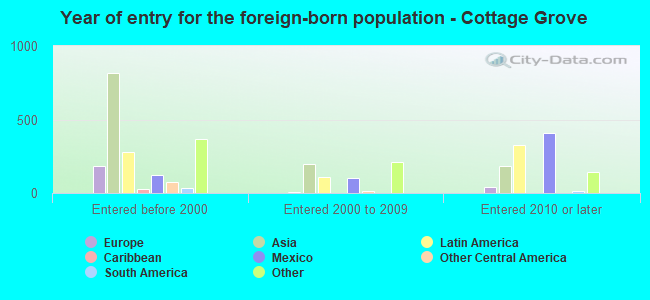
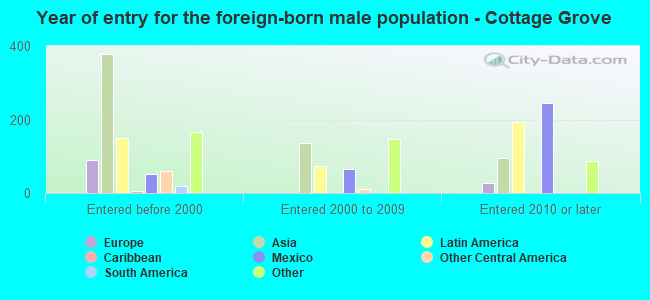
Foreign-born residents in Cottage Grove 2,944 residents are foreign born (3.1% Asia , 1.7% Latin America , 1.5% Africa ).
This city:
7.3%Minnesota:
8.5%
Marital status for residents in Cottage Grove Marital status - White (Caucasian) population 15 years and over
Males 25.9% Never married63.0% Now married0.4% Separated2.5% Widowed8.2% DivorcedFemales 28.6% Never married58.3% Now married0.1% Separated4.3% Widowed8.8% DivorcedWomen who gave birth in the past 12 months Now married:
93.6% (411)Unmarried:
6.4% (28)
Women who did not give birth in the past 12 months Now married:
46.4% (3,358)Unmarried:
53.6% (3,872)
Marital status - Black or African American population 15 years and over
Males 46.9% Never married50.5% Now married0.0% Separated0.0% Widowed2.6% DivorcedFemales 29.2% Never married45.3% Now married0.0% Separated14.0% Widowed11.5% DivorcedWomen who did not give birth in the past 12 months Now married:
43.7% (270)Unmarried:
56.3% (349)
Marital status - American Indian / Alaska Native population 15 years and over
Males 33.3% Never married66.7% Now married0.0% Separated0.0% Widowed0.0% DivorcedFemales 100.0% Never married0.0% Now married0.0% Separated0.0% Widowed0.0% DivorcedWomen who did not give birth in the past 12 months Now married:
0.0% (0)Unmarried:
100.0% (10)
Marital status - Asian population 15 years and over
Males 43.4% Never married53.5% Now married0.0% Separated0.0% Widowed3.1% DivorcedFemales 26.5% Never married59.9% Now married2.4% Separated7.5% Widowed3.7% DivorcedWomen who gave birth in the past 12 months Now married:
93.2% (125)Unmarried:
6.8% (9)
Women who did not give birth in the past 12 months Now married:
60.7% (413)Unmarried:
39.3% (267)
Marital status - Native Hawaiian / Pacific Islander population 15 years and over
Males 100.0% Never married0.0% Now married0.0% Separated0.0% Widowed0.0% DivorcedFemales 0.0% Never married100.0% Now married0.0% Separated0.0% Widowed0.0% DivorcedWomen who did not give birth in the past 12 months Now married:
100.0% (41)Unmarried:
0.0% (0)
Marital status - Other race population 15 years and over
Males 31.1% Never married52.8% Now married0.0% Separated0.0% Widowed16.1% DivorcedFemales 70.0% Never married20.0% Now married0.0% Separated0.0% Widowed10.0% DivorcedWomen who did not give birth in the past 12 months Now married:
20.0% (37)Unmarried:
80.0% (147)
Marital status - Two or more races population 15 years and over
Males 40.5% Never married59.5% Now married0.0% Separated0.0% Widowed0.0% DivorcedFemales 41.4% Never married38.6% Now married2.4% Separated14.1% Widowed3.5% DivorcedWomen who gave birth in the past 12 months Now married:
49.2% (47)Unmarried:
50.8% (49)
Women who did not give birth in the past 12 months Now married:
40.3% (250)Unmarried:
59.7% (370)
Marital status - White alone, not Hispanic / Latino population 15 years and over
Males 26.1% Never married63.6% Now married0.4% Separated2.5% Widowed7.4% DivorcedFemales 28.3% Never married58.4% Now married0.1% Separated4.3% Widowed8.9% DivorcedWomen who gave birth in the past 12 months Now married:
93.6% (417)Unmarried:
6.4% (29)
Women who did not give birth in the past 12 months Now married:
46.7% (3,365)Unmarried:
53.3% (3,837)
Marital status - Hispanic or Latino population 15 years and over
Males 31.4% Never married48.8% Now married0.0% Separated0.0% Widowed19.7% DivorcedFemales 37.2% Never married43.4% Now married4.3% Separated7.3% Widowed7.7% DivorcedWomen who gave birth in the past 12 months Now married:
100.0% (33)Unmarried:
0.0% (0)
Women who did not give birth in the past 12 months Now married:
36.6% (138)Unmarried:
63.4% (238)
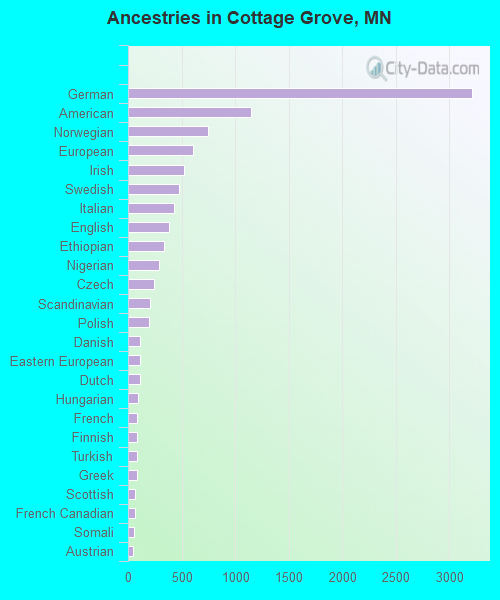
Ancestries in Cottage Grove
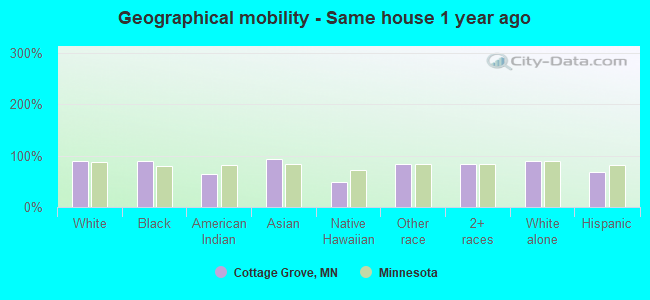
3,209 22.2% German1,149 7.9% American749 5.2% Norwegian603 4.2% European522 3.6% Irish479 3.3% Swedish427 3.0% Italian380 2.6% English334 2.3% Ethiopian285 2.0% Nigerian245 1.7% Czech201 1.4% Scandinavian199 1.4% Polish116 0.8% Danish111 0.8% Eastern European110 0.8% Dutch93 0.6% Hungarian86 0.6% French84 0.6% Finnish83 0.6% Turkish82 0.6% Greek70 0.5% Scottish61 0.4% French Canadian55 0.4% Somali45 0.3% Austrian43 0.3% Ukrainian39 0.3% Northern European34 0.2% Jamaican31 0.2% Serbian26 0.2% Romanian21 0.1% Swiss15 0.1% Luxembourger8 0.06% Russian8 0.06% Ugandan6 0.04% British6 0.04% Scotch-Irish5 0.03% Estonian
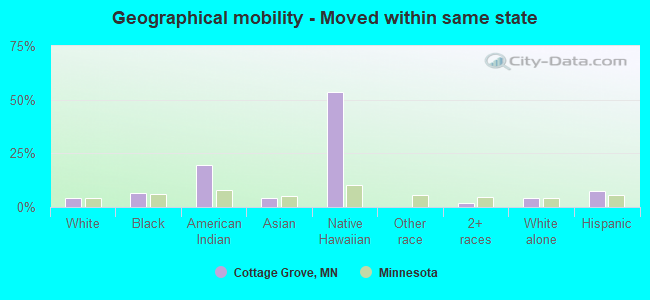
Geographical mobility in Cottage Grove Same house 1 year ago 27,417 90.2% White (Caucasian)2,277 89.9% Black or African American15 64.9% American Indian / Alaska Native2,417 93.9% Asian29 49.6% Native Hawaiian / Pacific Islander529 83.3% Other race2,920 84.7% Two or more races27,267 90.2% White alone, not Hispanic / Latino1,366 67.9% Hispanic or LatinoMoved within same county 1,455 4.8% White / Caucasian59 2.3% Black or African American3 14.0% American Indian / Alaska Native158 6.1% Asian82 12.8% Other race307 8.9% Two or more races1,481 4.9% White alone, not Hispanic / Latino293 14.6% Hispanic or LatinoMoved within same state 1,292 4.3% White / Caucasian171 6.7% Black or African American5 19.4% American Indian / Alaska Native110 4.3% Asian31 53.4% Native Hawaiian / Pacific Islander59 1.7% Two or more races1,242 4.1% White alone, not Hispanic / Latino153 7.6% Hispanic or LatinoMoved from different state 237 0.8% White / Caucasian11 1.8% Other race103 3.0% Two or more races243 0.8% White alone, not Hispanic / Latino199 9.9% Hispanic or LatinoMoved from abroad 13 0.0% White19 0.6% Two or more races13 0.0% White alone, not Hispanic / Latino
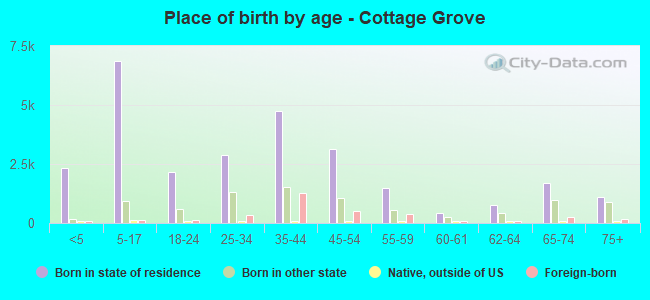
Children Nativity (place of birth) in Cottage Grove
Children under 6 years - Living with two parents Both parents native 1,826 99.0% Native19 1.0% Foreign-bornBoth parents foreign-born 494 91.3% Native47 8.7% Foreign-bornOne native, one foreign-born parent 115 100.0% NativeChildren under 6 years - Living with one parent Native parent 624 100.0% NativeForeign-born parent 40 100.0% NativeChildren 6 to 17 years - Living with two parents Both parents native 4,584 99.8% Native8 0.2% Foreign-bornBoth parents foreign-born 605 91.3% Native57 8.7% Foreign-bornOne native, one foreign-born parent 338 100.0% NativeChildren 6 to 17 years - Living with one parent Native parent 1,033 100.0% NativeForeign-born parent 426 57.5% Native315 42.5% Foreign-born
Grandparents responsible for own grandchildren in Cottage Grove
Grandparents (30 to 59 years) White / Caucasian 58 31.8% Responsible for grandchildren123 68.2% Not responsible for grandchildrenBlack or African American 24 100.0% Responsible for grandchildrenAsian 14 54.3% Responsible for grandchildren12 45.7% Not responsible for grandchildrenOther race 18 100.0% Not responsible for grandchildrenWhite alone, not Hispanic / Latino 58 31.3% Responsible for grandchildren126 68.7% Not responsible for grandchildrenHispanic or Latino 15 100.0% Not responsible for grandchildrenGrandparents (60 years and over) White / Caucasian 43 41.7% Responsible for grandchildren60 58.3% Not responsible for grandchildrenBlack or African American 7 100.0% Not responsible for grandchildrenAsian 124 100.0% Not responsible for grandchildrenWhite alone, not Hispanic / Latino 44 42.5% Responsible for grandchildren60 57.5% Not responsible for grandchildrenHispanic or Latino 26 100.0% Not responsible for grandchildren