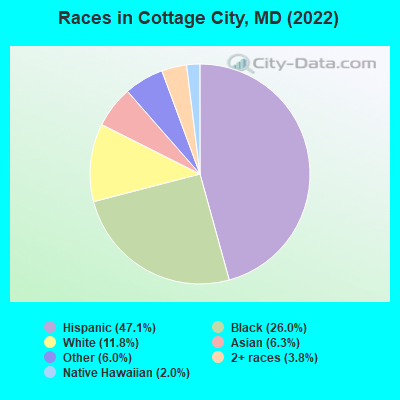
Races in Cottage City, Maryland (MD) Detailed Stats
Data:
Races - White alone (%)
Races - White alone (% change since 2000)
Races - Black alone (%)
Races - Black alone (% change since 2000)
Races - American Indian alone (%)
Races - American Indian alone (% change since 2000)
Races - Asian alone (%)
Races - Asian alone (% change since 2000)
Races - Hispanic (%)
Races - Hispanic (% change since 2000)
Races - Native Hawaiian and Other Pacific Islander alone (%)
Races - Native Hawaiian and Other Pacific Islander alone (% change since 2000)
Races - Two or more races(%)
Races - Two or more races(% change since 2000)
Races - Other race alone (%)
Races - Other race alone (% change since 2000)
Racial diversity
Place of birth - Born in state of residence (%)
Place of birth - Born in state of residence (%) - White
Place of birth - Born in state of residence (%) - Black or African American
Place of birth - Born in state of residence (%) - Asian
Place of birth - Born in state of residence (%) - Hispanic or Latino
Place of birth - Born in state of residence (%) - American Indian and Alaska Native
Place of birth - Born in state of residence (%) - Multirace
Place of birth - Born in state of residence (%) - Other Race
Place of birth - Born in other state (%)
Place of birth - Born in other state (%) - White
Place of birth - Born in other state (%) - Black or African American
Place of birth - Born in other state (%) - Asian
Place of birth - Born in other state (%) - Hispanic or Latino
Place of birth - Born in other state (%) - American Indian and Alaska Native
Place of birth - Born in other state (%) - Multirace
Place of birth - Born in other state (%) - Other Race
Place of birth - Native, outside of US (%)
Place of birth - Native, outside of US (%) - White
Place of birth - Native, outside of US (%) - Black or African American
Place of birth - Native, outside of US (%) - Asian
Place of birth - Native, outside of US (%) - Hispanic or Latino
Place of birth - Native, outside of US (%) - American Indian and Alaska Native
Place of birth - Native, outside of US (%) - Multirace
Place of birth - Native, outside of US (%) - Other Race
Place of birth - Foreign born (%)
Place of birth - Foreign born (%) - White
Place of birth - Foreign born (%) - Black or African American
Place of birth - Foreign born (%) - Asian
Place of birth - Foreign born (%) - Hispanic or Latino
Place of birth - Foreign born (%) - American Indian and Alaska Native
Place of birth - Foreign born (%) - Multirace
Place of birth - Foreign born (%) - Other Race
Residents speaking English at home (%)
Residents speaking English at home - Born in the United States (%)
Residents speaking English at home - Native, born elsewhere (%)
Residents speaking English at home - Foreign born (%)
Residents speaking Spanish at home (%)
Residents speaking Spanish at home - Born in the United States (%)
Residents speaking Spanish at home - Native, born elsewhere (%)
Residents speaking Spanish at home - Foreign born (%)
Residents speaking other language at home (%)
Residents speaking other language at home - Born in the United States (%)
Residents speaking other language at home - Native, born elsewhere (%)
Residents speaking other language at home - Foreign born (%)
Marital status - Never married (%)
Marital status - Now married (%)
Marital status - Separated (%)
Marital status - Widowed (%)
Marital status - Divorced (%)
Ancestries Reported - Arab (%)
Ancestries Reported - Czech (%)
Ancestries Reported - Danish (%)
Ancestries Reported - Dutch (%)
Ancestries Reported - English (%)
Ancestries Reported - French (%)
Ancestries Reported - French Canadian (%)
Ancestries Reported - German (%)
Ancestries Reported - Greek (%)
Ancestries Reported - Hungarian (%)
Ancestries Reported - Irish (%)
Ancestries Reported - Italian (%)
Ancestries Reported - Lithuanian (%)
Ancestries Reported - Norwegian (%)
Ancestries Reported - Polish (%)
Ancestries Reported - Portuguese (%)
Ancestries Reported - Russian (%)
Ancestries Reported - Scotch-Irish (%)
Ancestries Reported - Scottish (%)
Ancestries Reported - Slovak (%)
Ancestries Reported - Subsaharan African (%)
Ancestries Reported - Swedish (%)
Ancestries Reported - Swiss (%)
Ancestries Reported - Ukrainian (%)
Ancestries Reported - United States (%)
Ancestries Reported - Welsh (%)
Ancestries Reported - West Indian (%)
Ancestries Reported - Other (%)
Geographical mobility - Same house 1 year ago (%)
Geographical mobility - Same house 1 year ago (%) - White
Geographical mobility - Same house 1 year ago (%) - Black or African American
Geographical mobility - Same house 1 year ago (%) - Asian
Geographical mobility - Same house 1 year ago (%) - Hispanic or Latino
Geographical mobility - Same house 1 year ago (%) - American Indian and Alaska Native
Geographical mobility - Same house 1 year ago (%) - Multirace
Geographical mobility - Same house 1 year ago (%) - Other Race
Geographical mobility - Moved within same county (%)
Geographical mobility - Moved within same county (%) - White
Geographical mobility - Moved within same county (%) - Black or African American
Geographical mobility - Moved within same county (%) - Asian
Geographical mobility - Moved within same county (%) - Hispanic or Latino
Geographical mobility - Moved within same county (%) - American Indian and Alaska Native
Geographical mobility - Moved within same county (%) - Multirace
Geographical mobility - Moved within same county (%) - Other Race
Geographical mobility - Moved from different county within same state (%)
Geographical mobility - Moved from different county within same state (%) - White
Geographical mobility - Moved from different county within same state (%) - Black or African American
Geographical mobility - Moved from different county within same state (%) - Asian
Geographical mobility - Moved from different county within same state (%) - Hispanic or Latino
Geographical mobility - Moved from different county within same state (%) - American Indian and Alaska Native
Geographical mobility - Moved from different county within same state (%) - Multirace
Geographical mobility - Moved from different county within same state (%) - Other Race
Geographical mobility - Moved from different state (%)
Geographical mobility - Moved from different state (%) - White
Geographical mobility - Moved from different state (%) - Black or African American
Geographical mobility - Moved from different state (%) - Asian
Geographical mobility - Moved from different state (%) - Hispanic or Latino
Geographical mobility - Moved from different state (%) - American Indian and Alaska Native
Geographical mobility - Moved from different state (%) - Multirace
Geographical mobility - Moved from different state (%) - Other Race
Geographical mobility - Moved from abroad (%)
Geographical mobility - Moved from abroad (%) - White
Geographical mobility - Moved from abroad (%) - Black or African American
Geographical mobility - Moved from abroad (%) - Asian
Geographical mobility - Moved from abroad (%) - Hispanic or Latino
Geographical mobility - Moved from abroad (%) - American Indian and Alaska Native
Geographical mobility - Moved from abroad (%) - Multirace
Geographical mobility - Moved from abroad (%) - Other Race
Place of birth for the foreign-born population - Ireland (%)
Place of birth for the foreign-born population - Denmark (%)
Place of birth for the foreign-born population - Norway (%)
Place of birth for the foreign-born population - Sweden (%)
Place of birth for the foreign-born population - United Kingdom (%)
Place of birth for the foreign-born population - England (%)
Place of birth for the foreign-born population - Scotland (%)
Place of birth for the foreign-born population - Other Northern Europe (%)
Place of birth for the foreign-born population - Austria (%)
Place of birth for the foreign-born population - Belgium (%)
Place of birth for the foreign-born population - France (%)
Place of birth for the foreign-born population - Germany (%)
Place of birth for the foreign-born population - Netherlands (%)
Place of birth for the foreign-born population - Switzerland (%)
Place of birth for the foreign-born population - Other Western Europe (%)
Place of birth for the foreign-born population - Greece (%)
Place of birth for the foreign-born population - Italy (%)
Place of birth for the foreign-born population - Portugal (%)
Place of birth for the foreign-born population - Spain (%)
Place of birth for the foreign-born population - Other Southern Europe (%)
Place of birth for the foreign-born population - Albania (%)
Place of birth for the foreign-born population - Belarus (%)
Place of birth for the foreign-born population - Bosnia and Herzegovina (%)
Place of birth for the foreign-born population - Bulgaria (%)
Place of birth for the foreign-born population - Croatia (%)
Place of birth for the foreign-born population - Czechoslovakia (%)
Place of birth for the foreign-born population - Hungary (%)
Place of birth for the foreign-born population - Latvia (%)
Place of birth for the foreign-born population - Lithuania (%)
Place of birth for the foreign-born population - North Macedonia (Macedonia) (%)
Place of birth for the foreign-born population - Moldova (%)
Place of birth for the foreign-born population - Poland (%)
Place of birth for the foreign-born population - Romania (%)
Place of birth for the foreign-born population - Russia (%)
Place of birth for the foreign-born population - Serbia (%)
Place of birth for the foreign-born population - Ukraine (%)
Place of birth for the foreign-born population - Other Eastern Europe (%)
Place of birth for the foreign-born population - China (%)
Place of birth for the foreign-born population - Hong Kong (%)
Place of birth for the foreign-born population - Taiwan (%)
Place of birth for the foreign-born population - Japan (%)
Place of birth for the foreign-born population - Korea (%)
Place of birth for the foreign-born population - Other Eastern Asia (%)
Place of birth for the foreign-born population - Afghanistan (%)
Place of birth for the foreign-born population - Bangladesh (%)
Place of birth for the foreign-born population - India (%)
Place of birth for the foreign-born population - Iran (%)
Place of birth for the foreign-born population - Kazakhstan (%)
Place of birth for the foreign-born population - Nepal (%)
Place of birth for the foreign-born population - Pakistan (%)
Place of birth for the foreign-born population - Sri Lanka (%)
Place of birth for the foreign-born population - Uzbekistan (%)
Place of birth for the foreign-born population - Other South Central Asia (%)
Place of birth for the foreign-born population - Burma (%)
Place of birth for the foreign-born population - Cambodia (%)
Place of birth for the foreign-born population - Indonesia (%)
Place of birth for the foreign-born population - Laos (%)
Place of birth for the foreign-born population - Malaysia (%)
Place of birth for the foreign-born population - Philippines (%)
Place of birth for the foreign-born population - Singapore (%)
Place of birth for the foreign-born population - Thailand (%)
Place of birth for the foreign-born population - Vietnam (%)
Place of birth for the foreign-born population - Other South Eastern Asia (%)
Place of birth for the foreign-born population - Armenia (%)
Place of birth for the foreign-born population - Iraq (%)
Place of birth for the foreign-born population - Israel (%)
Place of birth for the foreign-born population - Jordan (%)
Place of birth for the foreign-born population - Kuwait (%)
Place of birth for the foreign-born population - Lebanon (%)
Place of birth for the foreign-born population - Saudi Arabia (%)
Place of birth for the foreign-born population - Syria (%)
Place of birth for the foreign-born population - Turkey (%)
Place of birth for the foreign-born population - Yemen (%)
Place of birth for the foreign-born population - Other Western Asia (%)
Place of birth for the foreign-born population - Eritrea (%)
Place of birth for the foreign-born population - Ethiopia (%)
Place of birth for the foreign-born population - Kenya (%)
Place of birth for the foreign-born population - Somalia (%)
Place of birth for the foreign-born population - Uganda (%)
Place of birth for the foreign-born population - Zimbabwe (%)
Place of birth for the foreign-born population - Other Eastern Africa (%)
Place of birth for the foreign-born population - Cameroon (%)
Place of birth for the foreign-born population - Congo (%)
Place of birth for the foreign-born population - Democratic Republic of Congo (Zaire) (%)
Place of birth for the foreign-born population - Other Middle Africa (%)
Place of birth for the foreign-born population - Egypt (%)
Place of birth for the foreign-born population - Morocco (%)
Place of birth for the foreign-born population - Sudan (%)
Place of birth for the foreign-born population - Other Northern Africa (%)
Place of birth for the foreign-born population - South Africa (%)
Place of birth for the foreign-born population - Other Southern Africa (%)
Place of birth for the foreign-born population - Cabo Verde (%)
Place of birth for the foreign-born population - Ghana (%)
Place of birth for the foreign-born population - Liberia (%)
Place of birth for the foreign-born population - Nigeria (%)
Place of birth for the foreign-born population - Senegal (%)
Place of birth for the foreign-born population - Sierra Leone (%)
Place of birth for the foreign-born population - Other Western Africa (%)
Place of birth for the foreign-born population - Australia (%)
Place of birth for the foreign-born population - New Zealand (%)
Place of birth for the foreign-born population - Fiji (%)
Place of birth for the foreign-born population - Micronesia (%)
Place of birth for the foreign-born population - Bahamas (%)
Place of birth for the foreign-born population - Barbados (%)
Place of birth for the foreign-born population - Cuba (%)
Place of birth for the foreign-born population - Dominica (%)
Place of birth for the foreign-born population - Dominican Republic (%)
Place of birth for the foreign-born population - Grenada (%)
Place of birth for the foreign-born population - Haiti (%)
Place of birth for the foreign-born population - Jamaica (%)
Place of birth for the foreign-born population - St. Vincent and the Grenadines (%)
Place of birth for the foreign-born population - Trinidad and Tobago (%)
Place of birth for the foreign-born population - West Indies (%)
Place of birth for the foreign-born population - Other Caribbean (%)
Place of birth for the foreign-born population - Belize (%)
Place of birth for the foreign-born population - Costa Rica (%)
Place of birth for the foreign-born population - El Salvador (%)
Place of birth for the foreign-born population - Guatemala (%)
Place of birth for the foreign-born population - Honduras (%)
Place of birth for the foreign-born population - Mexico (%)
Place of birth for the foreign-born population - Nicaragua (%)
Place of birth for the foreign-born population - Panama (%)
Place of birth for the foreign-born population - Other Central America (%)
Place of birth for the foreign-born population - Argentina (%)
Place of birth for the foreign-born population - Bolivia (%)
Place of birth for the foreign-born population - Brazil (%)
Place of birth for the foreign-born population - Chile (%)
Place of birth for the foreign-born population - Colombia (%)
Place of birth for the foreign-born population - Ecuador (%)
Place of birth for the foreign-born population - Guyana (%)
Place of birth for the foreign-born population - Peru (%)
Place of birth for the foreign-born population - Uruguay (%)
Place of birth for the foreign-born population - Venezuela (%)
Place of birth for the foreign-born population - Other South America (%)
Place of birth for the foreign-born population - Canada (%)
Place of birth for the foreign-born population - Other Northern America (%)
Place of birth for the foreign-born population - Other (%)
According to 2022 data, the most numerous races in Cottage City, MD are White alone (130 residents), Black alone (287 residents), and Hispanic (519 residents). 38.5% of Cottage City residents speak English at home. 53.4% of Cottage City, MD residents are foreign-born (39.0% born in Latin America, 7.3% born in Asia), which is 70.0% greater than the foreign-born rate of 16.0% across the entire state of Maryland.
Race distribution in Cottage City
2000 2022
3,286,547 62.1% White alone 1,464,735 27.7% Black alone 227,916 4.3% Hispanic 209,738 4.0% Asian alone 82,946 1.6% Two or more races 13,312 0.3% American Indian alone 9,379 0.2% Other race alone 1,913 0.04% Native Hawaiian and Other
2,906,492 47.1% White alone 1,800,914 29.2% Black alone 705,842 11.4% Hispanic 401,818 6.5% Asian alone 291,317 4.7% Two or more races 46,930 0.8% Other race alone 8,930 0.1% American Indian alone 2,417 0.04% Native Hawaiian and Other
Income and house value in Cottage City Median household income in 2022 $97,704 White non-Hispanic householders$34,385 Black householders$82,823 Asian householders$71,754 Two or more races householders$84,697 Hispanic or Latino race householdersMedian 2022 house value $336,733 White Non-Hispanic householders$357,419 Black or African American householders$322,151 American Indian or Alaska Native householders $440,839 Asian householders$384,547 Some other race householders$381,495 Two or more races householders$368,270 Hispanic or Latino householders
Median age by race in Cottage City
43.7 Median age for White residents38.7 46.8 57.1 Median age for Black or African American residents58.8 56.3 -780,410,741.7 Median age for American Indian / Alaska Native residents-888,297,871.5 -689,905,591.2 56.3 Median age for Asian residents47.6 60.7 -571,600,480.8 Median age for Native Hawaiian / Pacific Islander residents-720,061,021.4 -760,942,760.2 46.5 Median age for Other race residents45.9 48.1 30.2 Median age for Two or more races residents24.4 31.4 46.5 Median age for White alone residents36.1 46.7 47.7 Median age for Hispanic or Latino residents48.6 47.2
Owner/renter occupied households by race in Cottage City
House owners and renters - White residents 78 88.9% Owner occupied10 11.1% Renter occupiedHouse owners and renters - Black or African American residents 105 54.9% Owner occupied86 45.1% Renter occupiedHouse owners and renters - Asian residents 28 90.2% Owner occupied3 9.8% Renter occupiedHouse owners and renters - Native Hawaiian / Pacific Islander residents 13 100.0% Owner occupiedHouse owners and renters - Other race residents 97 79.3% Owner occupied25 20.7% Renter occupiedHouse owners and renters - Two or more races residents 26 69.8% Owner occupied11 30.2% Renter occupiedHouse owners and renters - White alone residents 56 89.4% Owner occupied7 10.6% Renter occupiedHouse owners and renters - Hispanic or Latino residents 142 77.5% Owner occupied41 22.5% Renter occupied
Language usage in Cottage City
English speakers - Total 38.5% of residents of Cottage City speak English at home.
47.2% of residents speak Spanish at home 215 41.7% Speak English very well301 58.3% Speak English less than very well17.7% of residents speak other language at home 182 93.8% Speak English very well12 6.2% Speak English less than very well
English speakers - Born in the United States 77.6% of residents of Cottage City speak English at home.
18.7% of residents speak Spanish at home 70 100.0% Speak English very well5.3% of residents speak other language at home 20 100.0% Speak English very well
English speakers - Native, born elsewhere 26.7% of residents of Cottage City speak English at home.
66.7% of residents speak Spanish at home 10 100.0% Speak English less than very well6.7% of residents speak other language at home 1 100.0% Speak English very well
English speakers - Foreign-born 4.7% of residents of Cottage City speak English at home.
67.8% of residents speak Spanish at home 118 29.1% Speak English very well287 70.9% Speak English less than very well26.6% of residents speak other language at home 147 92.5% Speak English very well12 7.5% Speak English less than very well
White (Caucasian) - Speak only English Native:
94.0% (128)Foreign-born:
8.9% (4)
White (Caucasian) - Speak another language Native:
6.3% (9)Foreign-born:
85.2% (35)
Black or African American - Speak only English Native:
96.0% (209)Foreign-born:
23.5% (20)
Black or African American - Speak another language Native:
3.9% (9)Foreign-born:
78.3% (67)
Asian - Speak another language Native:
100.0% (4)Foreign-born:
97.1% (64)
Native Hawaiian / Pacific Islander - Speak another language Native:
95.6% (8)Foreign-born:
100.0% (11)
Other race - Speak only English Native:
33.3% (32)Foreign-born:
1.2% (4)
Other race - Speak another language Native:
69.2% (67)Foreign-born:
99.1% (300)
Two or more races - Speak another language Native:
65.1% (53)Foreign-born:
100.0% (70)
White alone - Speak only English Native:
96.0% (118)Foreign-born:
100.0% (4)
Hispanic or Latino - Speak only English Native:
21.6% (21)Foreign-born:
0.8% (3)
Hispanic or Latino - Speak another language Native:
78.3% (77)Foreign-born:
99.7% (414)
Foreign-born residents in Cottage City 589 residents are foreign born (39.0% Latin America , 7.3% Asia ).
This city:
53.4%Maryland:
15.7%
Marital status for residents in Cottage City Marital status - White (Caucasian) population 15 years and over
Males 50.0% Never married46.1% Now married0.0% Separated0.0% Widowed3.9% DivorcedFemales 23.2% Never married50.5% Now married0.0% Separated7.1% Widowed19.2% DivorcedWomen who did not give birth in the past 12 months Now married:
53.2% (28)Unmarried:
46.8% (25)
Marital status - Black or African American population 15 years and over
Males 45.4% Never married15.1% Now married0.0% Separated22.4% Widowed17.1% DivorcedFemales 37.3% Never married21.8% Now married4.2% Separated2.8% Widowed33.8% DivorcedWomen who did not give birth in the past 12 months Now married:
24.0% (11)Unmarried:
76.0% (36)
Marital status - Asian population 15 years and over
Males 21.1% Never married78.9% Now married0.0% Separated0.0% Widowed0.0% DivorcedFemales 2.2% Never married66.7% Now married0.0% Separated11.1% Widowed20.0% DivorcedWomen who did not give birth in the past 12 months Now married:
91.7% (10)Unmarried:
8.3% (1)
Marital status - Native Hawaiian / Pacific Islander population 15 years and over
Males 0.0% Never married100.0% Now married0.0% Separated0.0% Widowed0.0% DivorcedFemales 0.0% Never married100.0% Now married0.0% Separated0.0% Widowed0.0% DivorcedMarital status - Other race population 15 years and over
Males 36.2% Never married63.8% Now married0.0% Separated0.0% Widowed0.0% DivorcedFemales 30.8% Never married43.8% Now married1.6% Separated20.5% Widowed3.2% DivorcedWomen who did not give birth in the past 12 months Now married:
39.4% (41)Unmarried:
60.6% (63)
Marital status - Two or more races population 15 years and over
Males 72.7% Never married27.3% Now married0.0% Separated0.0% Widowed0.0% DivorcedFemales 57.1% Never married31.4% Now married0.0% Separated0.0% Widowed11.4% DivorcedWomen who did not give birth in the past 12 months Now married:
25.0% (9)Unmarried:
75.0% (26)
Marital status - White alone, not Hispanic / Latino population 15 years and over
Males 62.9% Never married31.4% Now married0.0% Separated0.0% Widowed5.7% DivorcedFemales 16.7% Never married45.0% Now married0.0% Separated6.7% Widowed31.7% DivorcedWomen who did not give birth in the past 12 months Now married:
38.5% (10)Unmarried:
61.5% (15)
Marital status - Hispanic or Latino population 15 years and over
Males 38.6% Never married59.3% Now married0.0% Separated0.0% Widowed2.1% DivorcedFemales 27.8% Never married49.1% Now married1.3% Separated17.5% Widowed4.3% DivorcedWomen who did not give birth in the past 12 months Now married:
49.6% (70)Unmarried:
50.4% (71)
Ancestries in Cottage City
38 5.7% Nigerian20 3.0% Haitian16 2.4% Irish16 2.4% African14 2.1% Jamaican8 1.2% American5 0.7% Polish4 0.6% British West Indian2 0.3% German1 0.1% Italian
Children Nativity (place of birth) in Cottage City
Children under 6 years - Living with two parents Both parents native 0 36.4% NativeOne native, one foreign-born parent 28 100.0% NativeChildren under 6 years - Living with one parent Native parent 7 100.0% NativeChildren 6 to 17 years - Living with two parents Both parents native 0 3.9% Foreign-bornBoth parents foreign-born 11 100.0% Foreign-bornOne native, one foreign-born parent 4 100.0% NativeChildren 6 to 17 years - Living with one parent Native parent 45 88.9% Native6 11.1% Foreign-bornForeign-born parent 5 100.0% Native
Grandparents responsible for own grandchildren in Cottage City
Grandparents (30 to 59 years) Asian 7 100.0% Not responsible for grandchildrenOther race 4 100.0% Not responsible for grandchildrenTwo or more races 5 100.0% Responsible for grandchildrenHispanic or Latino 2 35.2% Responsible for grandchildren4 64.8% Not responsible for grandchildren
Grandparents (60 years and over) Asian 12 100.0% Not responsible for grandchildrenTwo or more races 5 100.0% Not responsible for grandchildrenHispanic or Latino 5 100.0% Not responsible for grandchildren