Races in Corinth, Vermont (VT) Detailed Stats
Ancestries, Foreign-born residents, place of birth
2.3% of Corinth, VT residents are foreign-born (1.4% born in Europe, 0.5% born in North America), which is 77.1% less than the foreign-born rate of 4.0% across the entire state of Vermont.
Race distribution in Corinth

- 1,42897.7%White alone
- 151.0%Hispanic
- 100.7%Two or more races
- 30.2%Black alone
- 30.2%American Indian alone
- 20.1%Other race alone

2000
2022
-
- 585,43196.2%White alone
- 6,8091.1%Two or more races
- 5,5040.9%Hispanic
- 5,1600.8%Asian alone
- 2,9210.5%Black alone
- 2,3250.4%American Indian alone
- 5570.09%Other race alone
- 1200.02%Native Hawaiian and Other
Pacific Islander alone

-
- 583,54690.2%White alone
- 27,3404.2%Two or more races
- 14,7702.3%Hispanic
- 11,5121.8%Asian alone
- 6,2641.0%Black alone
- 2,5210.4%Other race alone
- 1,0520.2%American Indian alone
- 590.01%Native Hawaiian and Other
Pacific Islander alone

Income and house value in Corinth
- Median household income in 2022
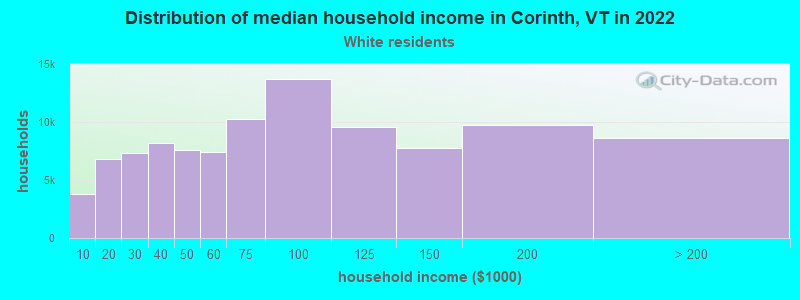
- $57,475White non-Hispanic householders
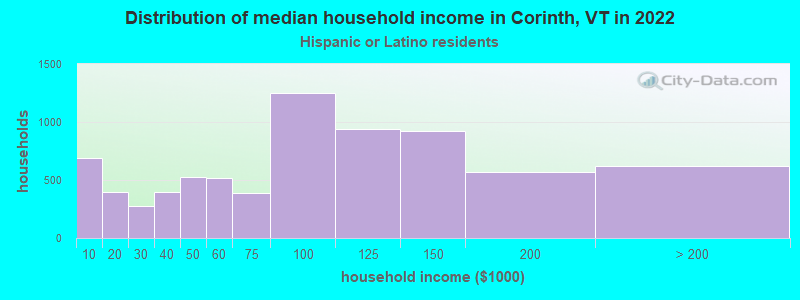
- $113,830Hispanic or Latino race householders
- Median 2022 house value
- $209,385White Non-Hispanic householders
Household income for White non-Hispanic householders
Household income for Hispanic or Latino race householders
Foreign-born residents in Corinth
33 residents are foreign born (1.4% Europe, 0.5% North America).
| This city: | 2.3% |
| Vermont: | 3.8% |
Ancestries in Corinth

- 46525.5%English
- 25413.9%French
- 18910.4%Irish
- 1719.4%Other
- 1307.1%United States
- 1277.0%German
- 1186.5%Scottish
- 573.1%Italian
- 512.8%Scotch-Irish
- 442.4%Polish
- 432.4%French Canadian
- 331.8%Dutch
- 301.6%Welsh
- 291.6%Swedish
- 160.9%Greek
- 130.7%Swiss
- 120.7%Danish
- 110.6%Norwegian
- 110.6%Russian
- 50.3%Czech
- 50.3%Hungarian
- 50.3%Lithuanian
- 20.1%Portuguese
- 20.1%Ukrainian

Zip codes: 05039.