Races in Conover, North Carolina (NC) Detailed Stats
Data:
Races - White alone (%)
Races - White alone (% change since 2000)
Races - Black alone (%)
Races - Black alone (% change since 2000)
Races - American Indian alone (%)
Races - American Indian alone (% change since 2000)
Races - Asian alone (%)
Races - Asian alone (% change since 2000)
Races - Hispanic (%)
Races - Hispanic (% change since 2000)
Races - Native Hawaiian and Other Pacific Islander alone (%)
Races - Native Hawaiian and Other Pacific Islander alone (% change since 2000)
Races - Two or more races(%)
Races - Two or more races(% change since 2000)
Races - Other race alone (%)
Races - Other race alone (% change since 2000)
Racial diversity
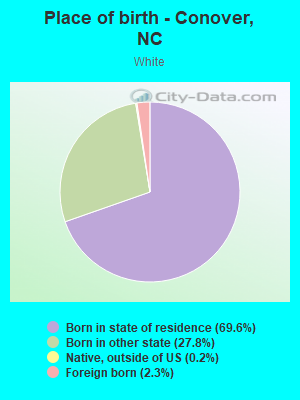
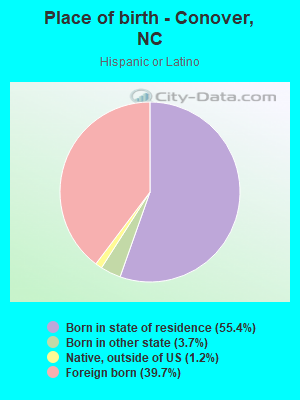
Place of birth - Born in state of residence (%)
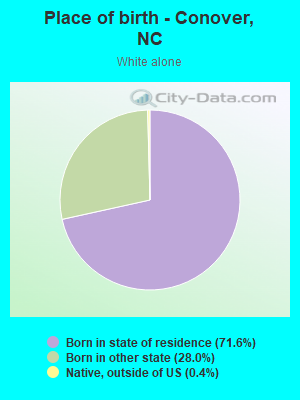
Place of birth - Born in state of residence (%) - White
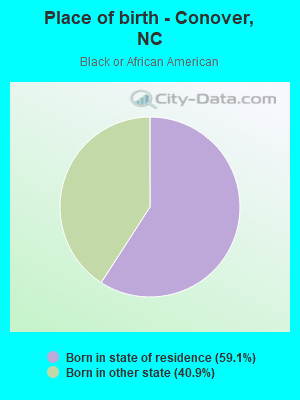
Place of birth - Born in state of residence (%) - Black or African American
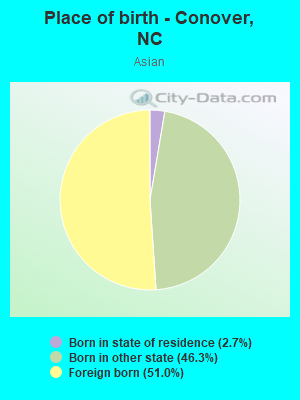
Place of birth - Born in state of residence (%) - Asian
Place of birth - Born in state of residence (%) - Hispanic or Latino
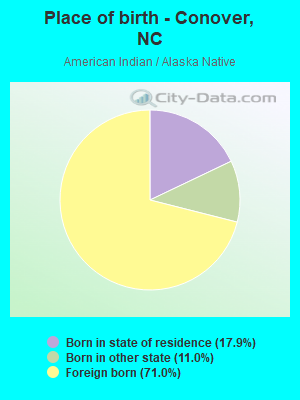
Place of birth - Born in state of residence (%) - American Indian and Alaska Native
Place of birth - Born in state of residence (%) - Multirace
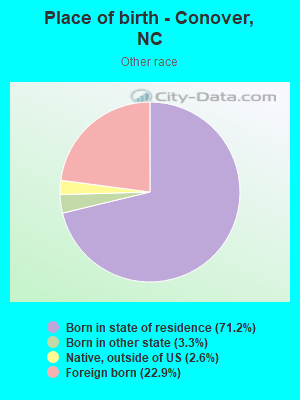
Place of birth - Born in state of residence (%) - Other Race
Place of birth - Born in other state (%)
Place of birth - Born in other state (%) - White
Place of birth - Born in other state (%) - Black or African American
Place of birth - Born in other state (%) - Asian
Place of birth - Born in other state (%) - Hispanic or Latino
Place of birth - Born in other state (%) - American Indian and Alaska Native
Place of birth - Born in other state (%) - Multirace
Place of birth - Born in other state (%) - Other Race
Place of birth - Native, outside of US (%)
Place of birth - Native, outside of US (%) - White
Place of birth - Native, outside of US (%) - Black or African American
Place of birth - Native, outside of US (%) - Asian
Place of birth - Native, outside of US (%) - Hispanic or Latino
Place of birth - Native, outside of US (%) - American Indian and Alaska Native
Place of birth - Native, outside of US (%) - Multirace
Place of birth - Native, outside of US (%) - Other Race
Place of birth - Foreign born (%)
Place of birth - Foreign born (%) - White
Place of birth - Foreign born (%) - Black or African American
Place of birth - Foreign born (%) - Asian
Place of birth - Foreign born (%) - Hispanic or Latino
Place of birth - Foreign born (%) - American Indian and Alaska Native
Place of birth - Foreign born (%) - Multirace
Place of birth - Foreign born (%) - Other Race
Residents speaking English at home (%)
Residents speaking English at home - Born in the United States (%)
Residents speaking English at home - Native, born elsewhere (%)
Residents speaking English at home - Foreign born (%)
Residents speaking Spanish at home (%)
Residents speaking Spanish at home - Born in the United States (%)
Residents speaking Spanish at home - Native, born elsewhere (%)
Residents speaking Spanish at home - Foreign born (%)
Residents speaking other language at home (%)
Residents speaking other language at home - Born in the United States (%)
Residents speaking other language at home - Native, born elsewhere (%)
Residents speaking other language at home - Foreign born (%)
Marital status - Never married (%)
Marital status - Now married (%)
Marital status - Separated (%)
Marital status - Widowed (%)
Marital status - Divorced (%)
Ancestries Reported - Arab (%)
Ancestries Reported - Czech (%)
Ancestries Reported - Danish (%)
Ancestries Reported - Dutch (%)
Ancestries Reported - English (%)
Ancestries Reported - French (%)
Ancestries Reported - French Canadian (%)
Ancestries Reported - German (%)
Ancestries Reported - Greek (%)
Ancestries Reported - Hungarian (%)
Ancestries Reported - Irish (%)
Ancestries Reported - Italian (%)
Ancestries Reported - Lithuanian (%)
Ancestries Reported - Norwegian (%)
Ancestries Reported - Polish (%)
Ancestries Reported - Portuguese (%)
Ancestries Reported - Russian (%)
Ancestries Reported - Scotch-Irish (%)
Ancestries Reported - Scottish (%)
Ancestries Reported - Slovak (%)
Ancestries Reported - Subsaharan African (%)
Ancestries Reported - Swedish (%)
Ancestries Reported - Swiss (%)
Ancestries Reported - Ukrainian (%)
Ancestries Reported - United States (%)
Ancestries Reported - Welsh (%)
Ancestries Reported - West Indian (%)
Ancestries Reported - Other (%)
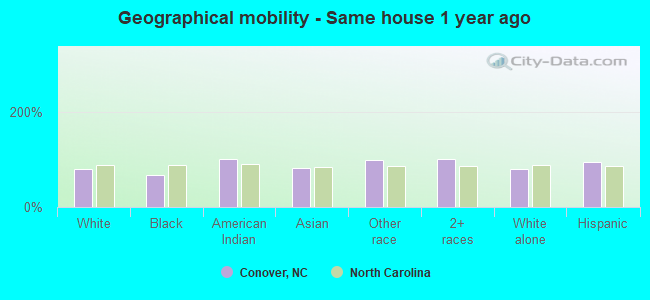
Geographical mobility - Same house 1 year ago (%)
Geographical mobility - Same house 1 year ago (%) - White
Geographical mobility - Same house 1 year ago (%) - Black or African American
Geographical mobility - Same house 1 year ago (%) - Asian
Geographical mobility - Same house 1 year ago (%) - Hispanic or Latino
Geographical mobility - Same house 1 year ago (%) - American Indian and Alaska Native
Geographical mobility - Same house 1 year ago (%) - Multirace
Geographical mobility - Same house 1 year ago (%) - Other Race
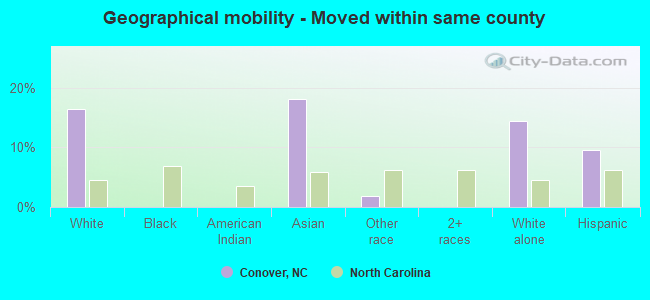
Geographical mobility - Moved within same county (%)
Geographical mobility - Moved within same county (%) - White
Geographical mobility - Moved within same county (%) - Black or African American
Geographical mobility - Moved within same county (%) - Asian
Geographical mobility - Moved within same county (%) - Hispanic or Latino
Geographical mobility - Moved within same county (%) - American Indian and Alaska Native
Geographical mobility - Moved within same county (%) - Multirace
Geographical mobility - Moved within same county (%) - Other Race
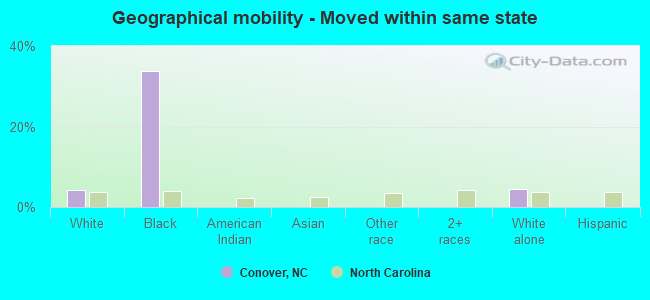
Geographical mobility - Moved from different county within same state (%)
Geographical mobility - Moved from different county within same state (%) - White
Geographical mobility - Moved from different county within same state (%) - Black or African American
Geographical mobility - Moved from different county within same state (%) - Asian
Geographical mobility - Moved from different county within same state (%) - Hispanic or Latino
Geographical mobility - Moved from different county within same state (%) - American Indian and Alaska Native
Geographical mobility - Moved from different county within same state (%) - Multirace
Geographical mobility - Moved from different county within same state (%) - Other Race
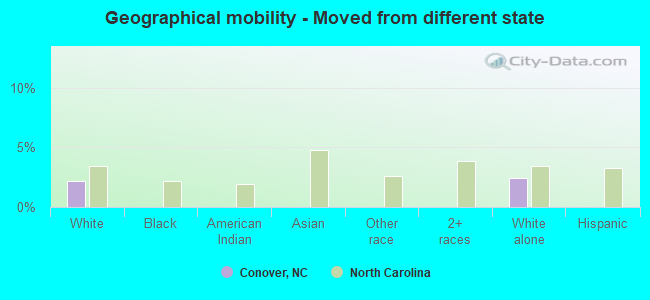
Geographical mobility - Moved from different state (%)
Geographical mobility - Moved from different state (%) - White
Geographical mobility - Moved from different state (%) - Black or African American
Geographical mobility - Moved from different state (%) - Asian
Geographical mobility - Moved from different state (%) - Hispanic or Latino
Geographical mobility - Moved from different state (%) - American Indian and Alaska Native
Geographical mobility - Moved from different state (%) - Multirace
Geographical mobility - Moved from different state (%) - Other Race
Geographical mobility - Moved from abroad (%)
Geographical mobility - Moved from abroad (%) - White
Geographical mobility - Moved from abroad (%) - Black or African American
Geographical mobility - Moved from abroad (%) - Asian
Geographical mobility - Moved from abroad (%) - Hispanic or Latino
Geographical mobility - Moved from abroad (%) - American Indian and Alaska Native
Geographical mobility - Moved from abroad (%) - Multirace
Geographical mobility - Moved from abroad (%) - Other Race
Place of birth for the foreign-born population - Ireland (%)
Place of birth for the foreign-born population - Denmark (%)
Place of birth for the foreign-born population - Norway (%)
Place of birth for the foreign-born population - Sweden (%)
Place of birth for the foreign-born population - United Kingdom (%)
Place of birth for the foreign-born population - England (%)
Place of birth for the foreign-born population - Scotland (%)
Place of birth for the foreign-born population - Other Northern Europe (%)
Place of birth for the foreign-born population - Austria (%)
Place of birth for the foreign-born population - Belgium (%)
Place of birth for the foreign-born population - France (%)
Place of birth for the foreign-born population - Germany (%)
Place of birth for the foreign-born population - Netherlands (%)
Place of birth for the foreign-born population - Switzerland (%)
Place of birth for the foreign-born population - Other Western Europe (%)
Place of birth for the foreign-born population - Greece (%)
Place of birth for the foreign-born population - Italy (%)
Place of birth for the foreign-born population - Portugal (%)
Place of birth for the foreign-born population - Spain (%)
Place of birth for the foreign-born population - Other Southern Europe (%)
Place of birth for the foreign-born population - Albania (%)
Place of birth for the foreign-born population - Belarus (%)
Place of birth for the foreign-born population - Bosnia and Herzegovina (%)
Place of birth for the foreign-born population - Bulgaria (%)
Place of birth for the foreign-born population - Croatia (%)
Place of birth for the foreign-born population - Czechoslovakia (%)
Place of birth for the foreign-born population - Hungary (%)
Place of birth for the foreign-born population - Latvia (%)
Place of birth for the foreign-born population - Lithuania (%)
Place of birth for the foreign-born population - North Macedonia (Macedonia) (%)
Place of birth for the foreign-born population - Moldova (%)
Place of birth for the foreign-born population - Poland (%)
Place of birth for the foreign-born population - Romania (%)
Place of birth for the foreign-born population - Russia (%)
Place of birth for the foreign-born population - Serbia (%)
Place of birth for the foreign-born population - Ukraine (%)
Place of birth for the foreign-born population - Other Eastern Europe (%)
Place of birth for the foreign-born population - China (%)
Place of birth for the foreign-born population - Hong Kong (%)
Place of birth for the foreign-born population - Taiwan (%)
Place of birth for the foreign-born population - Japan (%)
Place of birth for the foreign-born population - Korea (%)
Place of birth for the foreign-born population - Other Eastern Asia (%)
Place of birth for the foreign-born population - Afghanistan (%)
Place of birth for the foreign-born population - Bangladesh (%)
Place of birth for the foreign-born population - India (%)
Place of birth for the foreign-born population - Iran (%)
Place of birth for the foreign-born population - Kazakhstan (%)
Place of birth for the foreign-born population - Nepal (%)
Place of birth for the foreign-born population - Pakistan (%)
Place of birth for the foreign-born population - Sri Lanka (%)
Place of birth for the foreign-born population - Uzbekistan (%)
Place of birth for the foreign-born population - Other South Central Asia (%)
Place of birth for the foreign-born population - Burma (%)
Place of birth for the foreign-born population - Cambodia (%)
Place of birth for the foreign-born population - Indonesia (%)
Place of birth for the foreign-born population - Laos (%)
Place of birth for the foreign-born population - Malaysia (%)
Place of birth for the foreign-born population - Philippines (%)
Place of birth for the foreign-born population - Singapore (%)
Place of birth for the foreign-born population - Thailand (%)
Place of birth for the foreign-born population - Vietnam (%)
Place of birth for the foreign-born population - Other South Eastern Asia (%)
Place of birth for the foreign-born population - Armenia (%)
Place of birth for the foreign-born population - Iraq (%)
Place of birth for the foreign-born population - Israel (%)
Place of birth for the foreign-born population - Jordan (%)
Place of birth for the foreign-born population - Kuwait (%)
Place of birth for the foreign-born population - Lebanon (%)
Place of birth for the foreign-born population - Saudi Arabia (%)
Place of birth for the foreign-born population - Syria (%)
Place of birth for the foreign-born population - Turkey (%)
Place of birth for the foreign-born population - Yemen (%)
Place of birth for the foreign-born population - Other Western Asia (%)
Place of birth for the foreign-born population - Eritrea (%)
Place of birth for the foreign-born population - Ethiopia (%)
Place of birth for the foreign-born population - Kenya (%)
Place of birth for the foreign-born population - Somalia (%)
Place of birth for the foreign-born population - Uganda (%)
Place of birth for the foreign-born population - Zimbabwe (%)
Place of birth for the foreign-born population - Other Eastern Africa (%)
Place of birth for the foreign-born population - Cameroon (%)
Place of birth for the foreign-born population - Congo (%)
Place of birth for the foreign-born population - Democratic Republic of Congo (Zaire) (%)
Place of birth for the foreign-born population - Other Middle Africa (%)
Place of birth for the foreign-born population - Egypt (%)
Place of birth for the foreign-born population - Morocco (%)
Place of birth for the foreign-born population - Sudan (%)
Place of birth for the foreign-born population - Other Northern Africa (%)
Place of birth for the foreign-born population - South Africa (%)
Place of birth for the foreign-born population - Other Southern Africa (%)
Place of birth for the foreign-born population - Cabo Verde (%)
Place of birth for the foreign-born population - Ghana (%)
Place of birth for the foreign-born population - Liberia (%)
Place of birth for the foreign-born population - Nigeria (%)
Place of birth for the foreign-born population - Senegal (%)
Place of birth for the foreign-born population - Sierra Leone (%)
Place of birth for the foreign-born population - Other Western Africa (%)
Place of birth for the foreign-born population - Australia (%)
Place of birth for the foreign-born population - New Zealand (%)
Place of birth for the foreign-born population - Fiji (%)
Place of birth for the foreign-born population - Micronesia (%)
Place of birth for the foreign-born population - Bahamas (%)
Place of birth for the foreign-born population - Barbados (%)
Place of birth for the foreign-born population - Cuba (%)
Place of birth for the foreign-born population - Dominica (%)
Place of birth for the foreign-born population - Dominican Republic (%)
Place of birth for the foreign-born population - Grenada (%)
Place of birth for the foreign-born population - Haiti (%)
Place of birth for the foreign-born population - Jamaica (%)
Place of birth for the foreign-born population - St. Vincent and the Grenadines (%)
Place of birth for the foreign-born population - Trinidad and Tobago (%)
Place of birth for the foreign-born population - West Indies (%)
Place of birth for the foreign-born population - Other Caribbean (%)
Place of birth for the foreign-born population - Belize (%)
Place of birth for the foreign-born population - Costa Rica (%)
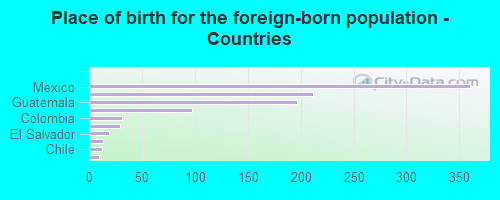
Place of birth for the foreign-born population - El Salvador (%)
Place of birth for the foreign-born population - Guatemala (%)
Place of birth for the foreign-born population - Honduras (%)
Place of birth for the foreign-born population - Mexico (%)
Place of birth for the foreign-born population - Nicaragua (%)
Place of birth for the foreign-born population - Panama (%)
Place of birth for the foreign-born population - Other Central America (%)
Place of birth for the foreign-born population - Argentina (%)
Place of birth for the foreign-born population - Bolivia (%)
Place of birth for the foreign-born population - Brazil (%)
Place of birth for the foreign-born population - Chile (%)
Place of birth for the foreign-born population - Colombia (%)
Place of birth for the foreign-born population - Ecuador (%)
Place of birth for the foreign-born population - Guyana (%)
Place of birth for the foreign-born population - Peru (%)
Place of birth for the foreign-born population - Uruguay (%)
Place of birth for the foreign-born population - Venezuela (%)
Place of birth for the foreign-born population - Other South America (%)
Place of birth for the foreign-born population - Canada (%)
Place of birth for the foreign-born population - Other Northern America (%)
Place of birth for the foreign-born population - Other (%)
Latest news about races in Conover, NC collected exclusively by city-data.com from local newspapers, TV, and radio stations
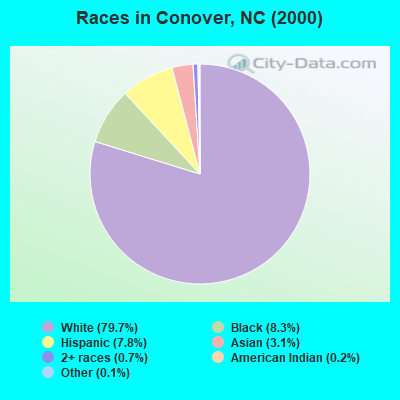
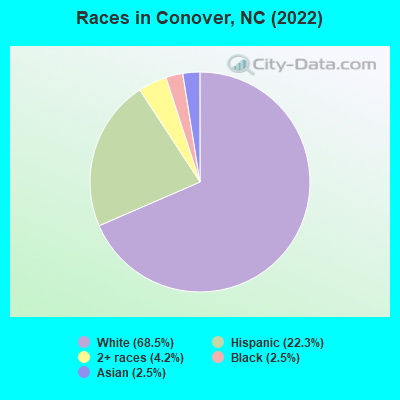
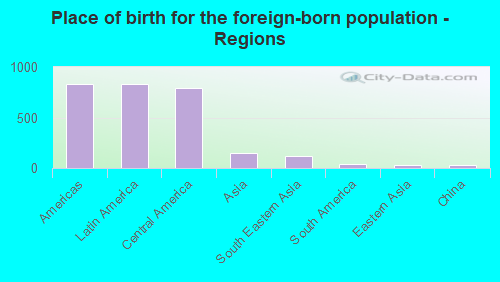
According to 2022 data, the most numerous races in Conover, NC are White alone (5,880 residents), Black alone (218 residents), and Hispanic (1,912 residents). 73.9% of Conover residents speak English at home. 11.5% of Conover, NC residents are foreign-born (9.3% born in Latin America, 1.7% born in Asia), which is 30.2% greater than the foreign-born rate of 8.0% across the entire state of North Carolina.
Race distribution in Conover
2000 2022
5,647,155 70.2% White alone 1,723,301 21.4% Black alone 378,963 4.7% Hispanic 112,416 1.4% Asian alone 95,333 1.2% American Indian alone 79,965 1.0% Two or more races 9,015 0.1% Other race alone 3,165 0.04% Native Hawaiian and Other
6,497,519 60.7% White alone 2,155,650 20.1% Black alone 1,114,799 10.4% Hispanic 438,061 4.1% Two or more races 341,052 3.2% Asian alone 91,758 0.9% American Indian alone 50,180 0.5% Other race alone 9,954 0.09% Native Hawaiian and Other
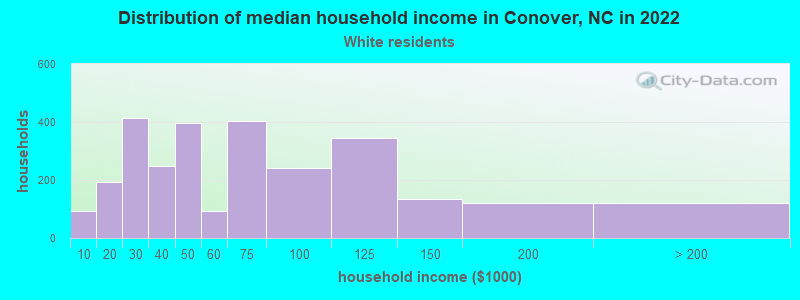
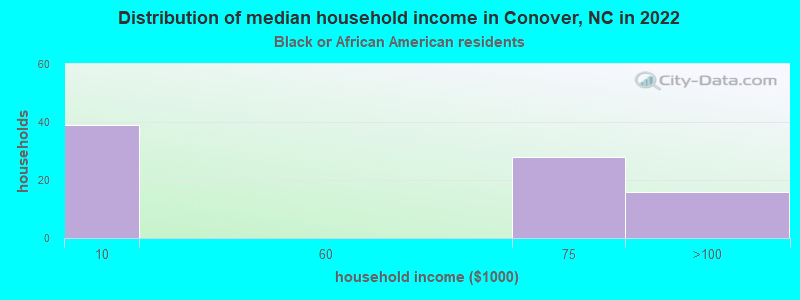
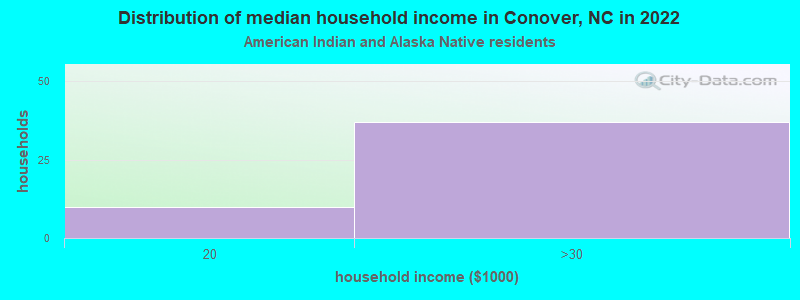
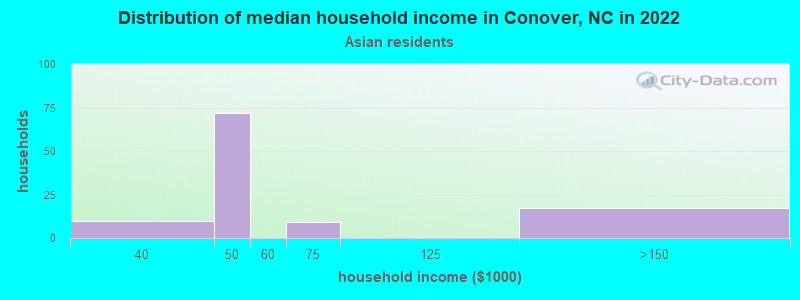
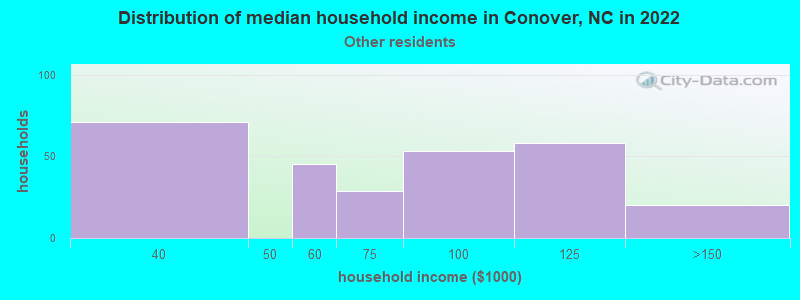
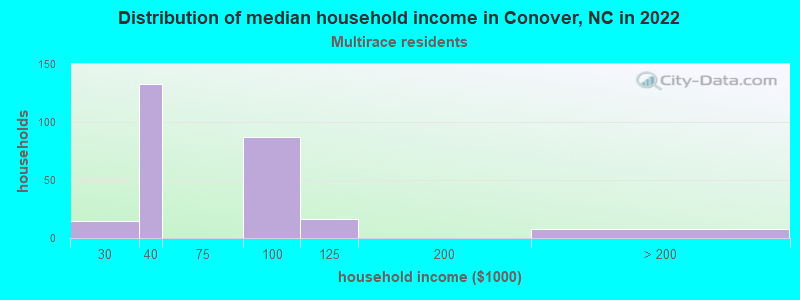
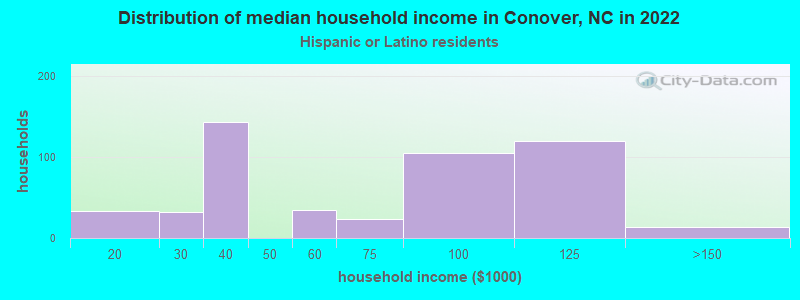
Income and house value in Conover Median household income in 2022 $52,014 White non-Hispanic householders$36,868 Asian householders$144,871 Some other race householders$52,212 Hispanic or Latino race householdersMedian 2022 house value $269,795 White Non-Hispanic householders$159,614 Black or African American householders $233,642 Asian householders$303,488 Hispanic or Latino householders
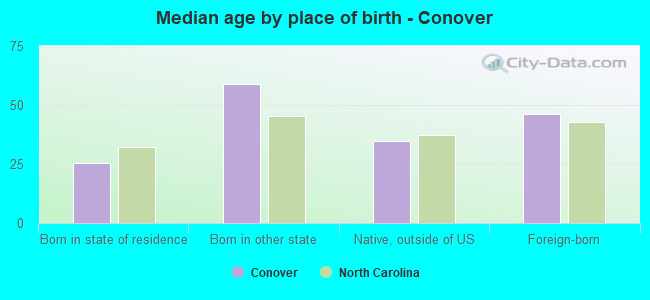
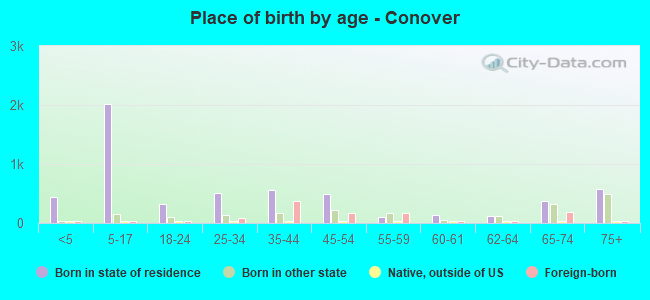
Median age by race in Conover
43.8 Median age for White residents42.6 44.4 50.8 Median age for Black or African American residents38.1 66.5 25.7 Median age for American Indian / Alaska Native residents29.7 61.5 37.5 Median age for Asian residents25.0 44.7 -666,666,666.0 Median age for Native Hawaiian / Pacific Islander residents-666,666,666.0 -666,666,666.0 23.7 Median age for Other race residents29.3 13.1 19.5 Median age for Two or more races residents16.3 32.4 43.7 Median age for White alone residents42.7 43.8 23.6 Median age for Hispanic or Latino residents21.5 27.3
Owner/renter occupied households by race in Conover
House owners and renters - White residents 2,221 77.6% Owner occupied642 22.4% Renter occupiedHouse owners and renters - Black or African American residents 46 65.2% Owner occupied25 34.8% Renter occupiedHouse owners and renters - American Indian / Alaska Native residents 41 81.6% Owner occupied9 18.4% Renter occupiedHouse owners and renters - Asian residents 74 88.7% Owner occupied9 11.3% Renter occupiedHouse owners and renters - Other race residents 226 89.1% Owner occupied28 10.9% Renter occupiedHouse owners and renters - Two or more races residents 137 41.0% Owner occupied197 59.0% Renter occupiedHouse owners and renters - White alone residents 2,219 79.0% Owner occupied588 21.0% Renter occupiedHouse owners and renters - Hispanic or Latino residents 358 65.6% Owner occupied188 34.4% Renter occupied
Language usage in Conover
English speakers - Total 73.9% of residents of Conover speak English at home.
21.0% of residents speak Spanish at home 1,196 70.0% Speak English very well512 30.0% Speak English less than very well4.2% of residents speak other language at home 100 29.2% Speak English very well243 70.8% Speak English less than very well
English speakers - Born in the United States 90.8% of residents of Conover speak English at home.
4.3% of residents speak Spanish at home 41 48.8% Speak English very well43 51.2% Speak English less than very well6.0% of residents speak other language at home 58 49.6% Speak English very well59 50.4% Speak English less than very well
English speakers - Native, born elsewhere 84.1% of residents of Conover speak English at home.
111.4% of residents speak Spanish at home 18 36.7% Speak English very well31 63.3% Speak English less than very well
English speakers - Foreign-born 0.0% of residents of Conover speak English at home.
73.9% of residents speak Spanish at home 337 47.1% Speak English very well378 52.9% Speak English less than very well20.1% of residents speak other language at home 11 5.7% Speak English very well183 94.3% Speak English less than very well
White (Caucasian) - Speak another language Native:
1.9% (106)Foreign-born:
100.0% (133)
American Indian / Alaska Native - Speak another language Native:
100.0% (51)Foreign-born:
100.0% (128)
Asian - Speak only English Native:
30.0% (33)Foreign-born:
1.2% (1)
Asian - Speak another language Native:
68.5% (75)Foreign-born:
93.0% (107)
Other race - Speak another language Native:
87.0% (447)Foreign-born:
100.0% (181)
Two or more races - Speak another language Native:
89.1% (797)Foreign-born:
94.3% (662)
Hispanic or Latino - Speak another language Native:
85.8% (965)Foreign-born:
98.1% (769)
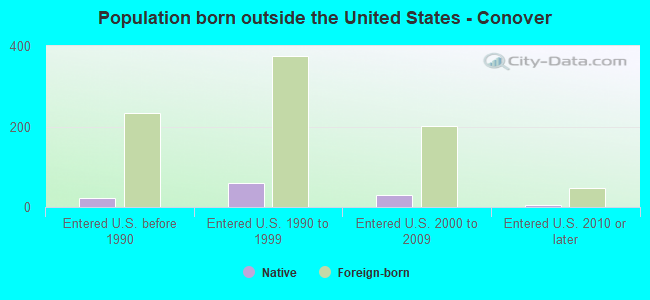
Foreign-born residents in Conover 984 residents are foreign born (9.3% Latin America , 1.7% Asia ).
This city:
11.5%North Carolina:
8.3%
Marital status for residents in Conover Marital status - White (Caucasian) population 15 years and over
Males 33.4% Never married49.7% Now married1.2% Separated5.8% Widowed10.0% DivorcedFemales 23.6% Never married42.2% Now married0.9% Separated15.1% Widowed18.1% DivorcedWomen who gave birth in the past 12 months Now married:
100.0% (20)Unmarried:
0.0% (0)
Women who did not give birth in the past 12 months Now married:
39.7% (468)Unmarried:
60.3% (712)
Marital status - Black or African American population 15 years and over
Males 2.3% Never married52.6% Now married17.3% Separated27.8% Widowed0.0% DivorcedFemales 15.5% Never married6.9% Now married0.0% Separated77.6% Widowed0.0% DivorcedMarital status - American Indian / Alaska Native population 15 years and over
Males 40.7% Never married59.3% Now married0.0% Separated0.0% Widowed0.0% DivorcedFemales 0.0% Never married100.0% Now married0.0% Separated0.0% Widowed0.0% DivorcedWomen who did not give birth in the past 12 months Now married:
100.0% (10)Unmarried:
0.0% (0)
Marital status - Asian population 15 years and over
Males 33.7% Never married66.3% Now married0.0% Separated0.0% Widowed0.0% DivorcedFemales 24.4% Never married44.4% Now married0.0% Separated0.0% Widowed31.1% DivorcedWomen who did not give birth in the past 12 months Now married:
0.0% (0)Unmarried:
100.0% (51)
Marital status - Other race population 15 years and over
Males 38.2% Never married53.5% Now married0.0% Separated0.0% Widowed8.3% DivorcedFemales 41.7% Never married41.7% Now married0.0% Separated16.5% Widowed0.0% DivorcedWomen who gave birth in the past 12 months Now married:
100.0% (75)Unmarried:
0.0% (0)
Women who did not give birth in the past 12 months Now married:
22.1% (49)Unmarried:
77.9% (174)
Marital status - Two or more races population 15 years and over
Males 79.2% Never married16.8% Now married0.0% Separated0.0% Widowed4.0% DivorcedFemales 61.0% Never married39.0% Now married0.0% Separated0.0% Widowed0.0% DivorcedWomen who did not give birth in the past 12 months Now married:
32.1% (74)Unmarried:
67.9% (156)
Marital status - White alone, not Hispanic / Latino population 15 years and over
Males 32.9% Never married52.0% Now married1.2% Separated3.4% Widowed10.4% DivorcedFemales 23.5% Never married42.0% Now married1.0% Separated15.6% Widowed17.9% DivorcedWomen who gave birth in the past 12 months Now married:
100.0% (20)Unmarried:
0.0% (0)
Women who did not give birth in the past 12 months Now married:
41.0% (473)Unmarried:
59.0% (681)
Marital status - Hispanic or Latino population 15 years and over
Males 57.7% Never married32.1% Now married0.0% Separated7.4% Widowed2.8% DivorcedFemales 39.2% Never married48.1% Now married0.0% Separated8.2% Widowed4.5% DivorcedWomen who gave birth in the past 12 months Now married:
100.0% (57)Unmarried:
0.0% (0)
Women who did not give birth in the past 12 months Now married:
26.1% (84)Unmarried:
73.9% (238)
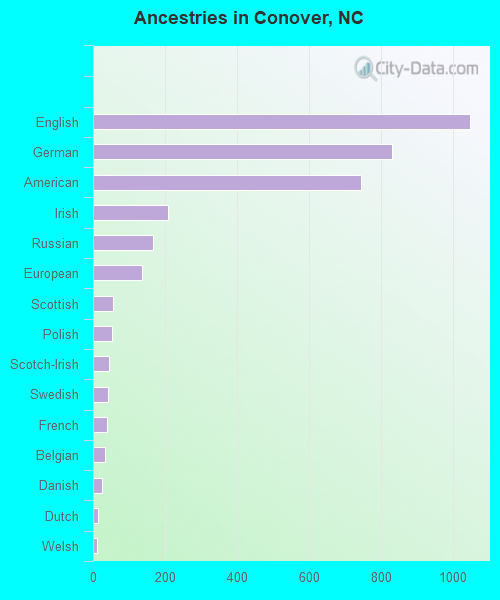
Ancestries in Conover
1,049 18.7% English833 14.9% German745 13.3% American208 3.7% Irish168 3.0% Russian135 2.4% European57 1.0% Scottish53 0.9% Polish44 0.8% Scotch-Irish43 0.8% Swedish39 0.7% French32 0.6% Belgian24 0.4% Danish15 0.3% Dutch11 0.2% Welsh
Children Nativity (place of birth) in Conover
Children under 6 years - Living with two parents Both parents native 251 100.0% NativeBoth parents foreign-born 72 100.0% NativeChildren under 6 years - Living with one parent Native parent 233 100.0% NativeChildren 6 to 17 years - Living with two parents Both parents native 574 100.0% NativeBoth parents foreign-born 288 100.0% NativeOne native, one foreign-born parent 140 100.0% NativeChildren 6 to 17 years - Living with one parent Native parent 658 100.0% NativeForeign-born parent 257 51.0% Native248 49.0% Foreign-born
Grandparents responsible for own grandchildren in Conover
Grandparents (30 to 59 years) White / Caucasian 23 73.2% Responsible for grandchildren9 26.8% Not responsible for grandchildrenWhite alone, not Hispanic / Latino 25 74.4% Responsible for grandchildren9 25.6% Not responsible for grandchildren
Grandparents (60 years and over) White / Caucasian 89 100.0% Responsible for grandchildrenWhite alone, not Hispanic / Latino 89 100.0% Responsible for grandchildren