Races in Connerton, Florida (FL) Detailed Stats
Data:
Races - White alone (%)
Races - White alone (% change since 2000)
Races - Black alone (%)
Races - Black alone (% change since 2000)
Races - American Indian alone (%)
Races - American Indian alone (% change since 2000)
Races - Asian alone (%)
Races - Asian alone (% change since 2000)
Races - Hispanic (%)
Races - Hispanic (% change since 2000)
Races - Native Hawaiian and Other Pacific Islander alone (%)
Races - Native Hawaiian and Other Pacific Islander alone (% change since 2000)
Races - Two or more races(%)
Races - Two or more races(% change since 2000)
Races - Other race alone (%)
Races - Other race alone (% change since 2000)
Racial diversity
Place of birth - Born in state of residence (%)
Place of birth - Born in state of residence (%) - White
Place of birth - Born in state of residence (%) - Black or African American
Place of birth - Born in state of residence (%) - Asian
Place of birth - Born in state of residence (%) - Hispanic or Latino
Place of birth - Born in state of residence (%) - American Indian and Alaska Native
Place of birth - Born in state of residence (%) - Multirace
Place of birth - Born in state of residence (%) - Other Race
Place of birth - Born in other state (%)
Place of birth - Born in other state (%) - White
Place of birth - Born in other state (%) - Black or African American
Place of birth - Born in other state (%) - Asian
Place of birth - Born in other state (%) - Hispanic or Latino
Place of birth - Born in other state (%) - American Indian and Alaska Native
Place of birth - Born in other state (%) - Multirace
Place of birth - Born in other state (%) - Other Race
Place of birth - Native, outside of US (%)
Place of birth - Native, outside of US (%) - White
Place of birth - Native, outside of US (%) - Black or African American
Place of birth - Native, outside of US (%) - Asian
Place of birth - Native, outside of US (%) - Hispanic or Latino
Place of birth - Native, outside of US (%) - American Indian and Alaska Native
Place of birth - Native, outside of US (%) - Multirace
Place of birth - Native, outside of US (%) - Other Race
Place of birth - Foreign born (%)
Place of birth - Foreign born (%) - White
Place of birth - Foreign born (%) - Black or African American
Place of birth - Foreign born (%) - Asian
Place of birth - Foreign born (%) - Hispanic or Latino
Place of birth - Foreign born (%) - American Indian and Alaska Native
Place of birth - Foreign born (%) - Multirace
Place of birth - Foreign born (%) - Other Race
Residents speaking English at home (%)
Residents speaking English at home - Born in the United States (%)
Residents speaking English at home - Native, born elsewhere (%)
Residents speaking English at home - Foreign born (%)
Residents speaking Spanish at home (%)
Residents speaking Spanish at home - Born in the United States (%)
Residents speaking Spanish at home - Native, born elsewhere (%)
Residents speaking Spanish at home - Foreign born (%)
Residents speaking other language at home (%)
Residents speaking other language at home - Born in the United States (%)
Residents speaking other language at home - Native, born elsewhere (%)
Residents speaking other language at home - Foreign born (%)
Marital status - Never married (%)
Marital status - Now married (%)
Marital status - Separated (%)
Marital status - Widowed (%)
Marital status - Divorced (%)
Ancestries Reported - Arab (%)
Ancestries Reported - Czech (%)
Ancestries Reported - Danish (%)
Ancestries Reported - Dutch (%)
Ancestries Reported - English (%)
Ancestries Reported - French (%)
Ancestries Reported - French Canadian (%)
Ancestries Reported - German (%)
Ancestries Reported - Greek (%)
Ancestries Reported - Hungarian (%)
Ancestries Reported - Irish (%)
Ancestries Reported - Italian (%)
Ancestries Reported - Lithuanian (%)
Ancestries Reported - Norwegian (%)
Ancestries Reported - Polish (%)
Ancestries Reported - Portuguese (%)
Ancestries Reported - Russian (%)
Ancestries Reported - Scotch-Irish (%)
Ancestries Reported - Scottish (%)
Ancestries Reported - Slovak (%)
Ancestries Reported - Subsaharan African (%)
Ancestries Reported - Swedish (%)
Ancestries Reported - Swiss (%)
Ancestries Reported - Ukrainian (%)
Ancestries Reported - United States (%)
Ancestries Reported - Welsh (%)
Ancestries Reported - West Indian (%)
Ancestries Reported - Other (%)
Geographical mobility - Same house 1 year ago (%)
Geographical mobility - Same house 1 year ago (%) - White
Geographical mobility - Same house 1 year ago (%) - Black or African American
Geographical mobility - Same house 1 year ago (%) - Asian
Geographical mobility - Same house 1 year ago (%) - Hispanic or Latino
Geographical mobility - Same house 1 year ago (%) - American Indian and Alaska Native
Geographical mobility - Same house 1 year ago (%) - Multirace
Geographical mobility - Same house 1 year ago (%) - Other Race
Geographical mobility - Moved within same county (%)
Geographical mobility - Moved within same county (%) - White
Geographical mobility - Moved within same county (%) - Black or African American
Geographical mobility - Moved within same county (%) - Asian
Geographical mobility - Moved within same county (%) - Hispanic or Latino
Geographical mobility - Moved within same county (%) - American Indian and Alaska Native
Geographical mobility - Moved within same county (%) - Multirace
Geographical mobility - Moved within same county (%) - Other Race
Geographical mobility - Moved from different county within same state (%)
Geographical mobility - Moved from different county within same state (%) - White
Geographical mobility - Moved from different county within same state (%) - Black or African American
Geographical mobility - Moved from different county within same state (%) - Asian
Geographical mobility - Moved from different county within same state (%) - Hispanic or Latino
Geographical mobility - Moved from different county within same state (%) - American Indian and Alaska Native
Geographical mobility - Moved from different county within same state (%) - Multirace
Geographical mobility - Moved from different county within same state (%) - Other Race
Geographical mobility - Moved from different state (%)
Geographical mobility - Moved from different state (%) - White
Geographical mobility - Moved from different state (%) - Black or African American
Geographical mobility - Moved from different state (%) - Asian
Geographical mobility - Moved from different state (%) - Hispanic or Latino
Geographical mobility - Moved from different state (%) - American Indian and Alaska Native
Geographical mobility - Moved from different state (%) - Multirace
Geographical mobility - Moved from different state (%) - Other Race
Geographical mobility - Moved from abroad (%)
Geographical mobility - Moved from abroad (%) - White
Geographical mobility - Moved from abroad (%) - Black or African American
Geographical mobility - Moved from abroad (%) - Asian
Geographical mobility - Moved from abroad (%) - Hispanic or Latino
Geographical mobility - Moved from abroad (%) - American Indian and Alaska Native
Geographical mobility - Moved from abroad (%) - Multirace
Geographical mobility - Moved from abroad (%) - Other Race
Place of birth for the foreign-born population - Ireland (%)
Place of birth for the foreign-born population - Denmark (%)
Place of birth for the foreign-born population - Norway (%)
Place of birth for the foreign-born population - Sweden (%)
Place of birth for the foreign-born population - United Kingdom (%)
Place of birth for the foreign-born population - England (%)
Place of birth for the foreign-born population - Scotland (%)
Place of birth for the foreign-born population - Other Northern Europe (%)
Place of birth for the foreign-born population - Austria (%)
Place of birth for the foreign-born population - Belgium (%)
Place of birth for the foreign-born population - France (%)
Place of birth for the foreign-born population - Germany (%)
Place of birth for the foreign-born population - Netherlands (%)
Place of birth for the foreign-born population - Switzerland (%)
Place of birth for the foreign-born population - Other Western Europe (%)
Place of birth for the foreign-born population - Greece (%)
Place of birth for the foreign-born population - Italy (%)
Place of birth for the foreign-born population - Portugal (%)
Place of birth for the foreign-born population - Spain (%)
Place of birth for the foreign-born population - Other Southern Europe (%)
Place of birth for the foreign-born population - Albania (%)
Place of birth for the foreign-born population - Belarus (%)
Place of birth for the foreign-born population - Bosnia and Herzegovina (%)
Place of birth for the foreign-born population - Bulgaria (%)
Place of birth for the foreign-born population - Croatia (%)
Place of birth for the foreign-born population - Czechoslovakia (%)
Place of birth for the foreign-born population - Hungary (%)
Place of birth for the foreign-born population - Latvia (%)
Place of birth for the foreign-born population - Lithuania (%)
Place of birth for the foreign-born population - North Macedonia (Macedonia) (%)
Place of birth for the foreign-born population - Moldova (%)
Place of birth for the foreign-born population - Poland (%)
Place of birth for the foreign-born population - Romania (%)
Place of birth for the foreign-born population - Russia (%)
Place of birth for the foreign-born population - Serbia (%)
Place of birth for the foreign-born population - Ukraine (%)
Place of birth for the foreign-born population - Other Eastern Europe (%)
Place of birth for the foreign-born population - China (%)
Place of birth for the foreign-born population - Hong Kong (%)
Place of birth for the foreign-born population - Taiwan (%)
Place of birth for the foreign-born population - Japan (%)
Place of birth for the foreign-born population - Korea (%)
Place of birth for the foreign-born population - Other Eastern Asia (%)
Place of birth for the foreign-born population - Afghanistan (%)
Place of birth for the foreign-born population - Bangladesh (%)
Place of birth for the foreign-born population - India (%)
Place of birth for the foreign-born population - Iran (%)
Place of birth for the foreign-born population - Kazakhstan (%)
Place of birth for the foreign-born population - Nepal (%)
Place of birth for the foreign-born population - Pakistan (%)
Place of birth for the foreign-born population - Sri Lanka (%)
Place of birth for the foreign-born population - Uzbekistan (%)
Place of birth for the foreign-born population - Other South Central Asia (%)
Place of birth for the foreign-born population - Burma (%)
Place of birth for the foreign-born population - Cambodia (%)
Place of birth for the foreign-born population - Indonesia (%)
Place of birth for the foreign-born population - Laos (%)
Place of birth for the foreign-born population - Malaysia (%)
Place of birth for the foreign-born population - Philippines (%)
Place of birth for the foreign-born population - Singapore (%)
Place of birth for the foreign-born population - Thailand (%)
Place of birth for the foreign-born population - Vietnam (%)
Place of birth for the foreign-born population - Other South Eastern Asia (%)
Place of birth for the foreign-born population - Armenia (%)
Place of birth for the foreign-born population - Iraq (%)
Place of birth for the foreign-born population - Israel (%)
Place of birth for the foreign-born population - Jordan (%)
Place of birth for the foreign-born population - Kuwait (%)
Place of birth for the foreign-born population - Lebanon (%)
Place of birth for the foreign-born population - Saudi Arabia (%)
Place of birth for the foreign-born population - Syria (%)
Place of birth for the foreign-born population - Turkey (%)
Place of birth for the foreign-born population - Yemen (%)
Place of birth for the foreign-born population - Other Western Asia (%)
Place of birth for the foreign-born population - Eritrea (%)
Place of birth for the foreign-born population - Ethiopia (%)
Place of birth for the foreign-born population - Kenya (%)
Place of birth for the foreign-born population - Somalia (%)
Place of birth for the foreign-born population - Uganda (%)
Place of birth for the foreign-born population - Zimbabwe (%)
Place of birth for the foreign-born population - Other Eastern Africa (%)
Place of birth for the foreign-born population - Cameroon (%)
Place of birth for the foreign-born population - Congo (%)
Place of birth for the foreign-born population - Democratic Republic of Congo (Zaire) (%)
Place of birth for the foreign-born population - Other Middle Africa (%)
Place of birth for the foreign-born population - Egypt (%)
Place of birth for the foreign-born population - Morocco (%)
Place of birth for the foreign-born population - Sudan (%)
Place of birth for the foreign-born population - Other Northern Africa (%)
Place of birth for the foreign-born population - South Africa (%)
Place of birth for the foreign-born population - Other Southern Africa (%)
Place of birth for the foreign-born population - Cabo Verde (%)
Place of birth for the foreign-born population - Ghana (%)
Place of birth for the foreign-born population - Liberia (%)
Place of birth for the foreign-born population - Nigeria (%)
Place of birth for the foreign-born population - Senegal (%)
Place of birth for the foreign-born population - Sierra Leone (%)
Place of birth for the foreign-born population - Other Western Africa (%)
Place of birth for the foreign-born population - Australia (%)
Place of birth for the foreign-born population - New Zealand (%)
Place of birth for the foreign-born population - Fiji (%)
Place of birth for the foreign-born population - Micronesia (%)
Place of birth for the foreign-born population - Bahamas (%)
Place of birth for the foreign-born population - Barbados (%)
Place of birth for the foreign-born population - Cuba (%)
Place of birth for the foreign-born population - Dominica (%)
Place of birth for the foreign-born population - Dominican Republic (%)
Place of birth for the foreign-born population - Grenada (%)
Place of birth for the foreign-born population - Haiti (%)
Place of birth for the foreign-born population - Jamaica (%)
Place of birth for the foreign-born population - St. Vincent and the Grenadines (%)
Place of birth for the foreign-born population - Trinidad and Tobago (%)
Place of birth for the foreign-born population - West Indies (%)
Place of birth for the foreign-born population - Other Caribbean (%)
Place of birth for the foreign-born population - Belize (%)
Place of birth for the foreign-born population - Costa Rica (%)
Place of birth for the foreign-born population - El Salvador (%)
Place of birth for the foreign-born population - Guatemala (%)
Place of birth for the foreign-born population - Honduras (%)
Place of birth for the foreign-born population - Mexico (%)
Place of birth for the foreign-born population - Nicaragua (%)
Place of birth for the foreign-born population - Panama (%)
Place of birth for the foreign-born population - Other Central America (%)
Place of birth for the foreign-born population - Argentina (%)
Place of birth for the foreign-born population - Bolivia (%)
Place of birth for the foreign-born population - Brazil (%)
Place of birth for the foreign-born population - Chile (%)
Place of birth for the foreign-born population - Colombia (%)
Place of birth for the foreign-born population - Ecuador (%)
Place of birth for the foreign-born population - Guyana (%)
Place of birth for the foreign-born population - Peru (%)
Place of birth for the foreign-born population - Uruguay (%)
Place of birth for the foreign-born population - Venezuela (%)
Place of birth for the foreign-born population - Other South America (%)
Place of birth for the foreign-born population - Canada (%)
Place of birth for the foreign-born population - Other Northern America (%)
Place of birth for the foreign-born population - Other (%)
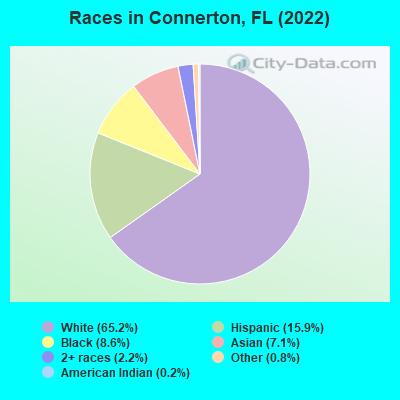
According to 2022 data, the most numerous races in Connerton, FL are White alone (4,451 residents), Hispanic (1,086 residents), and Black alone (586 residents). 88.2% of Connerton residents speak English at home.
Race distribution in Connerton 4,451 65.2% White alone 1,086 15.9% Hispanic 586 8.6% Black alone 486 7.1% Asian alone 150 2.2% Two or more races 56 0.8% Other race alone 11 0.2% American Indian alone
2000 2022
10,458,509 65.4% White alone 2,682,715 16.8% Hispanic 2,264,268 14.2% Black alone 261,693 1.6% Asian alone 236,954 1.5% Two or more races 42,358 0.3% American Indian alone 28,994 0.2% Other race alone 6,887 0.04% Native Hawaiian and Other
11,309,403 50.8% White alone 6,025,039 27.1% Hispanic 3,241,015 14.6% Black alone 861,630 3.9% Two or more races 623,692 2.8% Asian alone 152,054 0.7% Other race alone 22,504 0.1% American Indian alone 9,486 0.04% Native Hawaiian and Other
Income and house value in Connerton Median household income in 2022 $121,384 White non-Hispanic householders$50,747 Asian householders$120,593 Two or more races householders$109,477 Hispanic or Latino race householders
Median age by race in Connerton
32.5 Median age for White residents32.3 32.8 31.5 Median age for Black or African American residents34.2 16.1 -513,238,288.7 Median age for American Indian / Alaska Native residents-769,874,476.2 -501,002,003.5 48.8 Median age for Asian residents39.9 63.6 -835,555,554.7 Median age for Native Hawaiian / Pacific Islander residents-858,307,848.3 -444,051,825.2 46.8 Median age for Other race residents41.2 44.2 22.6 Median age for Two or more races residents21.0 28.6 32.0 Median age for White alone residents31.7 32.5 39.1 Median age for Hispanic or Latino residents26.4 43.2
Owner/renter occupied households by race in Connerton
House owners and renters - White residents 1,079 98.6% Owner occupied16 1.4% Renter occupiedHouse owners and renters - Black or African American residents 122 100.0% Owner occupiedHouse owners and renters - American Indian / Alaska Native residents 10 100.0% Owner occupiedHouse owners and renters - Asian residents 165 100.0% Owner occupiedHouse owners and renters - Two or more races residents 185 100.0% Owner occupiedHouse owners and renters - White alone residents 1,012 98.4% Owner occupied16 1.6% Renter occupiedHouse owners and renters - Hispanic or Latino residents 225 100.0% Owner occupied
Language usage in Connerton
English speakers - Total 88.2% of residents of Connerton speak English at home.
3.7% of residents speak Spanish at home 142 60.7% Speak English very well92 39.3% Speak English less than very well7.3% of residents speak other language at home 448 97.8% Speak English very well10 2.2% Speak English less than very well
English speakers - Born in the United States 94.7% of residents of Connerton speak English at home.
3.0% of residents speak Spanish at home 48 51.6% Speak English very well45 48.4% Speak English less than very well2.3% of residents speak other language at home 72 100.0% Speak English very well
English speakers - Native, born elsewhere 75.6% of residents of Connerton speak English at home.
4.4% of residents speak Spanish at home 6 100.0% Speak English less than very well
English speakers - Foreign-born 28.6% of residents of Connerton speak English at home.
18.4% of residents speak Spanish at home 101 84.2% Speak English very well19 15.8% Speak English less than very well56.5% of residents speak other language at home 358 97.3% Speak English very well10 2.7% Speak English less than very well
White (Caucasian) - Speak only English Native:
100.0% (4,175)Foreign-born:
74.7% (74)
White (Caucasian) - Speak another language Native:
0.9% (38)Foreign-born:
25.7% (26)
American Indian / Alaska Native - Speak only English Native:
77.0% (9)Foreign-born:
61.4% (13)
Asian - Speak only English Native:
11.7% (11)Foreign-born:
18.4% (64)
Asian - Speak another language Native:
62.4% (61)Foreign-born:
80.5% (282)
Other race - Speak only English Native:
82.5% (171)Foreign-born:
83.9% (23)
Other race - Speak another language Native:
10.5% (22)Foreign-born:
16.6% (5)
Two or more races - Speak another language Native:
18.3% (104)Foreign-born:
100.0% (149)
White alone - Speak only English Native:
99.2% (3,864)Foreign-born:
66.3% (50)
White alone - Speak another language Native:
0.8% (31)Foreign-born:
28.4% (21)
Hispanic or Latino - Speak only English Native:
84.6% (760)Foreign-born:
19.1% (31)
Hispanic or Latino - Speak another language Native:
13.0% (117)Foreign-born:
74.0% (120)
Foreign-born residents in Connerton
Marital status for residents in Connerton Marital status - White (Caucasian) population 15 years and over
Males 39.6% Never married55.8% Now married0.0% Separated1.2% Widowed3.3% DivorcedFemales 26.7% Never married66.9% Now married0.0% Separated2.7% Widowed3.7% DivorcedWomen who gave birth in the past 12 months Now married:
63.2% (11)Unmarried:
36.8% (7)
Women who did not give birth in the past 12 months Now married:
63.6% (745)Unmarried:
36.4% (426)
Marital status - Black or African American population 15 years and over
Males 48.6% Never married51.4% Now married0.0% Separated0.0% Widowed0.0% DivorcedFemales 46.8% Never married53.2% Now married0.0% Separated0.0% Widowed0.0% DivorcedWomen who did not give birth in the past 12 months Now married:
53.2% (91)Unmarried:
46.8% (80)
Marital status - Asian population 15 years and over
Males 34.8% Never married65.2% Now married0.0% Separated0.0% Widowed0.0% DivorcedFemales 0.0% Never married48.0% Now married14.3% Separated37.8% Widowed0.0% DivorcedWomen who gave birth in the past 12 months Now married:
100.0% (22)Unmarried:
0.0% (0)
Women who did not give birth in the past 12 months Now married:
100.0% (61)Unmarried:
0.0% (0)
Marital status - Other race population 15 years and over
Males 52.4% Never married47.6% Now married0.0% Separated0.0% Widowed0.0% DivorcedFemales 0.0% Never married100.0% Now married0.0% Separated0.0% Widowed0.0% DivorcedWomen who did not give birth in the past 12 months Now married:
100.0% (153)Unmarried:
0.0% (0)
Marital status - Two or more races population 15 years and over
Males 67.0% Never married33.0% Now married0.0% Separated0.0% Widowed0.0% DivorcedFemales 60.1% Never married33.1% Now married0.0% Separated6.8% Widowed0.0% DivorcedWomen who gave birth in the past 12 months Now married:
0.0% (0)Unmarried:
100.0% (28)
Women who did not give birth in the past 12 months Now married:
34.5% (120)Unmarried:
65.5% (228)
Marital status - White alone, not Hispanic / Latino population 15 years and over
Males 40.9% Never married54.0% Now married0.0% Separated1.4% Widowed3.7% DivorcedFemales 26.9% Never married66.4% Now married0.0% Separated2.8% Widowed3.9% DivorcedWomen who gave birth in the past 12 months Now married:
63.2% (12)Unmarried:
36.8% (7)
Women who did not give birth in the past 12 months Now married:
63.9% (769)Unmarried:
36.1% (435)
Marital status - Hispanic or Latino population 15 years and over
Males 44.2% Never married55.8% Now married0.0% Separated0.0% Widowed0.0% DivorcedFemales 36.8% Never married63.2% Now married0.0% Separated0.0% Widowed0.0% DivorcedWomen who did not give birth in the past 12 months Now married:
61.0% (212)Unmarried:
39.0% (136)
Ancestries in Connerton
876 24.6% American632 17.7% English631 17.7% Irish157 4.4% German111 3.1% Polish39 1.1% Italian16 0.4% Dutch16 0.4% Greek15 0.4% Portuguese13 0.4% British
Children Nativity (place of birth) in Connerton
Children under 6 years - Living with two parents Both parents native 604 100.0% NativeBoth parents foreign-born 26 55.2% Native21 44.8% Foreign-bornOne native, one foreign-born parent 31 100.0% NativeChildren under 6 years - Living with one parent Native parent 19 100.0% Native
Children 6 to 17 years - Living with two parents Both parents native 1,236 100.0% NativeBoth parents foreign-born 22 100.0% NativeOne native, one foreign-born parent 127 100.0% NativeChildren 6 to 17 years - Living with one parent Native parent 21 100.0% Native
Grandparents responsible for own grandchildren in Connerton
Grandparents (30 to 59 years) White / Caucasian 20 100.0% Not responsible for grandchildrenWhite alone, not Hispanic / Latino 17 100.0% Not responsible for grandchildren
Grandparents (60 years and over) White / Caucasian 11 100.0% Not responsible for grandchildrenWhite alone, not Hispanic / Latino 12 100.0% Not responsible for grandchildren