Races in Concord, Massachusetts (MA) Detailed Stats
Ancestries, Foreign-born residents, place of birth

Recent posts about races in Concord, Massachusetts on our local forum with over 2,400,000 registered users:

Latest news about races in Concord, MA collected exclusively by city-data.com from local newspapers, TV, and radio stations
8.2% of Concord, MA residents are foreign-born (3.7% born in Europe, 2.3% born in Asia, 1.4% born in Latin America), which is 118.6% less than the foreign-born rate of 18.0% across the entire state of Massachusetts.
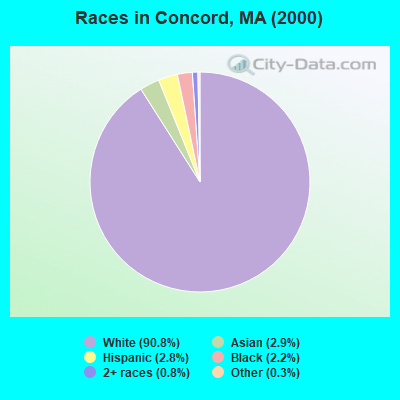
Race distribution in Concord

- 15,43290.8%White alone
- 4912.9%Asian alone
- 4752.8%Hispanic
- 3782.2%Black alone
- 1440.8%Two or more races
- 560.3%Other race alone
- 130.08%American Indian alone
- 40.02%Native Hawaiian and Other
Pacific Islander alone
2000
2022
-
- 5,198,35981.9%White alone
- 428,7296.8%Hispanic
- 318,3295.0%Black alone
- 236,7863.7%Asian alone
- 110,3381.7%Two or more races
- 43,5860.7%Other race alone
- 11,2640.2%American Indian alone
- 1,7060.03%Native Hawaiian and Other
Pacific Islander alone

-
- 4,676,62767.0%White alone
- 911,03813.0%Hispanic
- 501,4637.2%Asian alone
- 459,7406.6%Black alone
- 341,8894.9%Two or more races
- 84,4031.2%Other race alone
- 5,8380.08%American Indian alone
- 9760.01%Native Hawaiian and Other
Pacific Islander alone

Income and house value in Concord
- Median household income in 2022
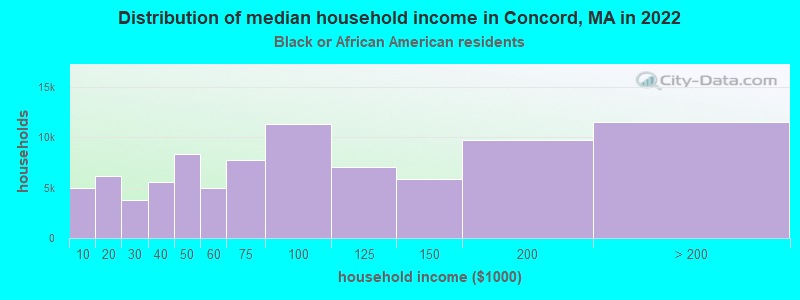
- $188,523White non-Hispanic householders
- over $200,000Black householders
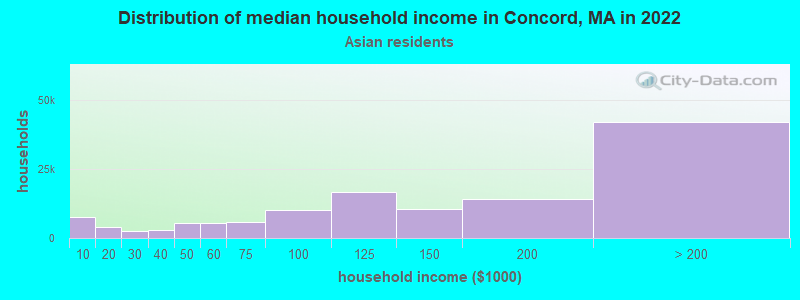
- over $200,000Asian householders
- $60,380Some other race householders
- $102,635Two or more races householders
- over $200,000Hispanic or Latino race householders
- Median 2022 house value
- over $1,000,000White Non-Hispanic householders
- over $1,000,000Black or African American householders
- over $1,000,000Asian householders
- $418,041Two or more races householders
- over $1,000,000Hispanic or Latino householders
Household income for White non-Hispanic householders
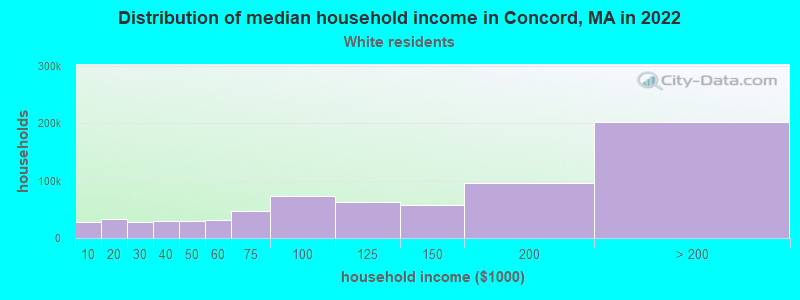
Household income for Black householders
Household income for Asian householders
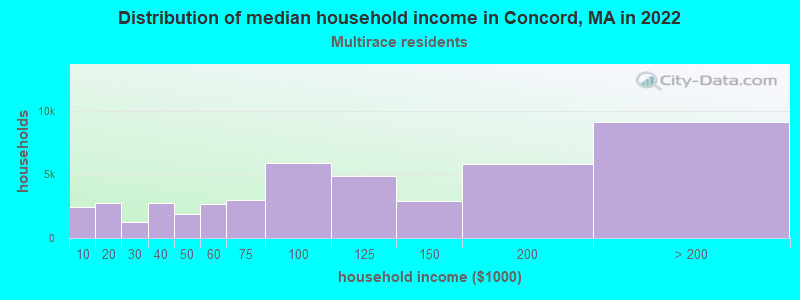
Household income for Two or more races householders
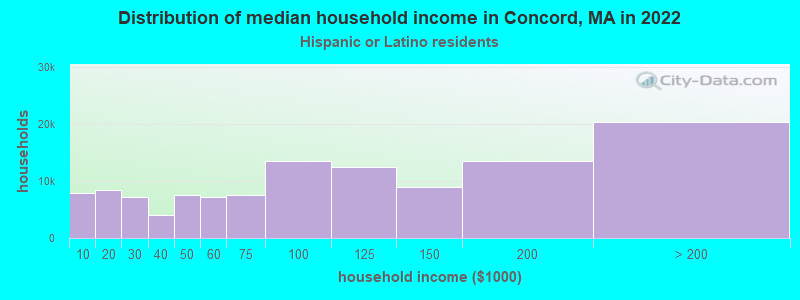
Household income for Hispanic or Latino race householders
Foreign-born residents in Concord
1,399 residents are foreign born (3.7% Europe, 2.3% Asia, 1.4% Latin America).
| This city: | 8.2% |
| Massachusetts: | 12.2% |
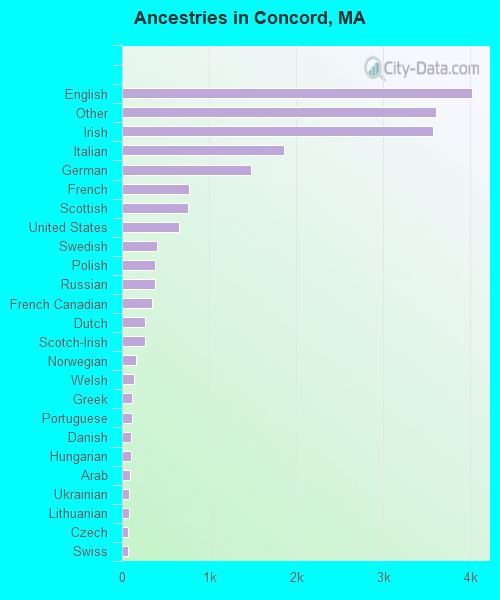
Ancestries in Concord

- 4,01620.1%English
- 3,61318.0%Other
- 3,57717.9%Irish
- 1,8569.3%Italian
- 1,4797.4%German
- 7723.9%French
- 7563.8%Scottish
- 6503.2%United States
- 4012.0%Swedish
- 3821.9%Polish
- 3821.9%Russian
- 3481.7%French Canadian
- 2691.3%Dutch
- 2671.3%Scotch-Irish
- 1650.8%Norwegian
- 1390.7%Welsh
- 1130.6%Greek
- 1120.6%Portuguese
- 1080.5%Danish
- 1080.5%Hungarian
- 950.5%Arab
- 830.4%Ukrainian
- 820.4%Lithuanian
- 710.4%Czech
- 650.3%Swiss
- 620.3%Subsaharan African
- 460.2%West Indian
- 70.03%Slovak
Zip codes: 01742.