Races in Colmar Manor, Maryland (MD) Detailed Stats
Data:
Races - White alone (%)
Races - White alone (% change since 2000)
Races - Black alone (%)
Races - Black alone (% change since 2000)
Races - American Indian alone (%)
Races - American Indian alone (% change since 2000)
Races - Asian alone (%)
Races - Asian alone (% change since 2000)
Races - Hispanic (%)
Races - Hispanic (% change since 2000)
Races - Native Hawaiian and Other Pacific Islander alone (%)
Races - Native Hawaiian and Other Pacific Islander alone (% change since 2000)
Races - Two or more races(%)
Races - Two or more races(% change since 2000)
Races - Other race alone (%)
Races - Other race alone (% change since 2000)
Racial diversity
Place of birth - Born in state of residence (%)
Place of birth - Born in state of residence (%) - White
Place of birth - Born in state of residence (%) - Black or African American
Place of birth - Born in state of residence (%) - Asian
Place of birth - Born in state of residence (%) - Hispanic or Latino
Place of birth - Born in state of residence (%) - American Indian and Alaska Native
Place of birth - Born in state of residence (%) - Multirace
Place of birth - Born in state of residence (%) - Other Race
Place of birth - Born in other state (%)
Place of birth - Born in other state (%) - White
Place of birth - Born in other state (%) - Black or African American
Place of birth - Born in other state (%) - Asian
Place of birth - Born in other state (%) - Hispanic or Latino
Place of birth - Born in other state (%) - American Indian and Alaska Native
Place of birth - Born in other state (%) - Multirace
Place of birth - Born in other state (%) - Other Race
Place of birth - Native, outside of US (%)
Place of birth - Native, outside of US (%) - White
Place of birth - Native, outside of US (%) - Black or African American
Place of birth - Native, outside of US (%) - Asian
Place of birth - Native, outside of US (%) - Hispanic or Latino
Place of birth - Native, outside of US (%) - American Indian and Alaska Native
Place of birth - Native, outside of US (%) - Multirace
Place of birth - Native, outside of US (%) - Other Race
Place of birth - Foreign born (%)
Place of birth - Foreign born (%) - White
Place of birth - Foreign born (%) - Black or African American
Place of birth - Foreign born (%) - Asian
Place of birth - Foreign born (%) - Hispanic or Latino
Place of birth - Foreign born (%) - American Indian and Alaska Native
Place of birth - Foreign born (%) - Multirace
Place of birth - Foreign born (%) - Other Race
Residents speaking English at home (%)
Residents speaking English at home - Born in the United States (%)
Residents speaking English at home - Native, born elsewhere (%)
Residents speaking English at home - Foreign born (%)
Residents speaking Spanish at home (%)
Residents speaking Spanish at home - Born in the United States (%)
Residents speaking Spanish at home - Native, born elsewhere (%)
Residents speaking Spanish at home - Foreign born (%)
Residents speaking other language at home (%)
Residents speaking other language at home - Born in the United States (%)
Residents speaking other language at home - Native, born elsewhere (%)
Residents speaking other language at home - Foreign born (%)
Marital status - Never married (%)
Marital status - Now married (%)
Marital status - Separated (%)
Marital status - Widowed (%)
Marital status - Divorced (%)
Ancestries Reported - Arab (%)
Ancestries Reported - Czech (%)
Ancestries Reported - Danish (%)
Ancestries Reported - Dutch (%)
Ancestries Reported - English (%)
Ancestries Reported - French (%)
Ancestries Reported - French Canadian (%)
Ancestries Reported - German (%)
Ancestries Reported - Greek (%)
Ancestries Reported - Hungarian (%)
Ancestries Reported - Irish (%)
Ancestries Reported - Italian (%)
Ancestries Reported - Lithuanian (%)
Ancestries Reported - Norwegian (%)
Ancestries Reported - Polish (%)
Ancestries Reported - Portuguese (%)
Ancestries Reported - Russian (%)
Ancestries Reported - Scotch-Irish (%)
Ancestries Reported - Scottish (%)
Ancestries Reported - Slovak (%)
Ancestries Reported - Subsaharan African (%)
Ancestries Reported - Swedish (%)
Ancestries Reported - Swiss (%)
Ancestries Reported - Ukrainian (%)
Ancestries Reported - United States (%)
Ancestries Reported - Welsh (%)
Ancestries Reported - West Indian (%)
Ancestries Reported - Other (%)
Geographical mobility - Same house 1 year ago (%)
Geographical mobility - Same house 1 year ago (%) - White
Geographical mobility - Same house 1 year ago (%) - Black or African American
Geographical mobility - Same house 1 year ago (%) - Asian
Geographical mobility - Same house 1 year ago (%) - Hispanic or Latino
Geographical mobility - Same house 1 year ago (%) - American Indian and Alaska Native
Geographical mobility - Same house 1 year ago (%) - Multirace
Geographical mobility - Same house 1 year ago (%) - Other Race
Geographical mobility - Moved within same county (%)
Geographical mobility - Moved within same county (%) - White
Geographical mobility - Moved within same county (%) - Black or African American
Geographical mobility - Moved within same county (%) - Asian
Geographical mobility - Moved within same county (%) - Hispanic or Latino
Geographical mobility - Moved within same county (%) - American Indian and Alaska Native
Geographical mobility - Moved within same county (%) - Multirace
Geographical mobility - Moved within same county (%) - Other Race
Geographical mobility - Moved from different county within same state (%)
Geographical mobility - Moved from different county within same state (%) - White
Geographical mobility - Moved from different county within same state (%) - Black or African American
Geographical mobility - Moved from different county within same state (%) - Asian
Geographical mobility - Moved from different county within same state (%) - Hispanic or Latino
Geographical mobility - Moved from different county within same state (%) - American Indian and Alaska Native
Geographical mobility - Moved from different county within same state (%) - Multirace
Geographical mobility - Moved from different county within same state (%) - Other Race
Geographical mobility - Moved from different state (%)
Geographical mobility - Moved from different state (%) - White
Geographical mobility - Moved from different state (%) - Black or African American
Geographical mobility - Moved from different state (%) - Asian
Geographical mobility - Moved from different state (%) - Hispanic or Latino
Geographical mobility - Moved from different state (%) - American Indian and Alaska Native
Geographical mobility - Moved from different state (%) - Multirace
Geographical mobility - Moved from different state (%) - Other Race
Geographical mobility - Moved from abroad (%)
Geographical mobility - Moved from abroad (%) - White
Geographical mobility - Moved from abroad (%) - Black or African American
Geographical mobility - Moved from abroad (%) - Asian
Geographical mobility - Moved from abroad (%) - Hispanic or Latino
Geographical mobility - Moved from abroad (%) - American Indian and Alaska Native
Geographical mobility - Moved from abroad (%) - Multirace
Geographical mobility - Moved from abroad (%) - Other Race
Place of birth for the foreign-born population - Ireland (%)
Place of birth for the foreign-born population - Denmark (%)
Place of birth for the foreign-born population - Norway (%)
Place of birth for the foreign-born population - Sweden (%)
Place of birth for the foreign-born population - United Kingdom (%)
Place of birth for the foreign-born population - England (%)
Place of birth for the foreign-born population - Scotland (%)
Place of birth for the foreign-born population - Other Northern Europe (%)
Place of birth for the foreign-born population - Austria (%)
Place of birth for the foreign-born population - Belgium (%)
Place of birth for the foreign-born population - France (%)
Place of birth for the foreign-born population - Germany (%)
Place of birth for the foreign-born population - Netherlands (%)
Place of birth for the foreign-born population - Switzerland (%)
Place of birth for the foreign-born population - Other Western Europe (%)
Place of birth for the foreign-born population - Greece (%)
Place of birth for the foreign-born population - Italy (%)
Place of birth for the foreign-born population - Portugal (%)
Place of birth for the foreign-born population - Spain (%)
Place of birth for the foreign-born population - Other Southern Europe (%)
Place of birth for the foreign-born population - Albania (%)
Place of birth for the foreign-born population - Belarus (%)
Place of birth for the foreign-born population - Bosnia and Herzegovina (%)
Place of birth for the foreign-born population - Bulgaria (%)
Place of birth for the foreign-born population - Croatia (%)
Place of birth for the foreign-born population - Czechoslovakia (%)
Place of birth for the foreign-born population - Hungary (%)
Place of birth for the foreign-born population - Latvia (%)
Place of birth for the foreign-born population - Lithuania (%)
Place of birth for the foreign-born population - North Macedonia (Macedonia) (%)
Place of birth for the foreign-born population - Moldova (%)
Place of birth for the foreign-born population - Poland (%)
Place of birth for the foreign-born population - Romania (%)
Place of birth for the foreign-born population - Russia (%)
Place of birth for the foreign-born population - Serbia (%)
Place of birth for the foreign-born population - Ukraine (%)
Place of birth for the foreign-born population - Other Eastern Europe (%)
Place of birth for the foreign-born population - China (%)
Place of birth for the foreign-born population - Hong Kong (%)
Place of birth for the foreign-born population - Taiwan (%)
Place of birth for the foreign-born population - Japan (%)
Place of birth for the foreign-born population - Korea (%)
Place of birth for the foreign-born population - Other Eastern Asia (%)
Place of birth for the foreign-born population - Afghanistan (%)
Place of birth for the foreign-born population - Bangladesh (%)
Place of birth for the foreign-born population - India (%)
Place of birth for the foreign-born population - Iran (%)
Place of birth for the foreign-born population - Kazakhstan (%)
Place of birth for the foreign-born population - Nepal (%)
Place of birth for the foreign-born population - Pakistan (%)
Place of birth for the foreign-born population - Sri Lanka (%)
Place of birth for the foreign-born population - Uzbekistan (%)
Place of birth for the foreign-born population - Other South Central Asia (%)
Place of birth for the foreign-born population - Burma (%)
Place of birth for the foreign-born population - Cambodia (%)
Place of birth for the foreign-born population - Indonesia (%)
Place of birth for the foreign-born population - Laos (%)
Place of birth for the foreign-born population - Malaysia (%)
Place of birth for the foreign-born population - Philippines (%)
Place of birth for the foreign-born population - Singapore (%)
Place of birth for the foreign-born population - Thailand (%)
Place of birth for the foreign-born population - Vietnam (%)
Place of birth for the foreign-born population - Other South Eastern Asia (%)
Place of birth for the foreign-born population - Armenia (%)
Place of birth for the foreign-born population - Iraq (%)
Place of birth for the foreign-born population - Israel (%)
Place of birth for the foreign-born population - Jordan (%)
Place of birth for the foreign-born population - Kuwait (%)
Place of birth for the foreign-born population - Lebanon (%)
Place of birth for the foreign-born population - Saudi Arabia (%)
Place of birth for the foreign-born population - Syria (%)
Place of birth for the foreign-born population - Turkey (%)
Place of birth for the foreign-born population - Yemen (%)
Place of birth for the foreign-born population - Other Western Asia (%)
Place of birth for the foreign-born population - Eritrea (%)
Place of birth for the foreign-born population - Ethiopia (%)
Place of birth for the foreign-born population - Kenya (%)
Place of birth for the foreign-born population - Somalia (%)
Place of birth for the foreign-born population - Uganda (%)
Place of birth for the foreign-born population - Zimbabwe (%)
Place of birth for the foreign-born population - Other Eastern Africa (%)
Place of birth for the foreign-born population - Cameroon (%)
Place of birth for the foreign-born population - Congo (%)
Place of birth for the foreign-born population - Democratic Republic of Congo (Zaire) (%)
Place of birth for the foreign-born population - Other Middle Africa (%)
Place of birth for the foreign-born population - Egypt (%)
Place of birth for the foreign-born population - Morocco (%)
Place of birth for the foreign-born population - Sudan (%)
Place of birth for the foreign-born population - Other Northern Africa (%)
Place of birth for the foreign-born population - South Africa (%)
Place of birth for the foreign-born population - Other Southern Africa (%)
Place of birth for the foreign-born population - Cabo Verde (%)
Place of birth for the foreign-born population - Ghana (%)
Place of birth for the foreign-born population - Liberia (%)
Place of birth for the foreign-born population - Nigeria (%)
Place of birth for the foreign-born population - Senegal (%)
Place of birth for the foreign-born population - Sierra Leone (%)
Place of birth for the foreign-born population - Other Western Africa (%)
Place of birth for the foreign-born population - Australia (%)
Place of birth for the foreign-born population - New Zealand (%)
Place of birth for the foreign-born population - Fiji (%)
Place of birth for the foreign-born population - Micronesia (%)
Place of birth for the foreign-born population - Bahamas (%)
Place of birth for the foreign-born population - Barbados (%)
Place of birth for the foreign-born population - Cuba (%)
Place of birth for the foreign-born population - Dominica (%)
Place of birth for the foreign-born population - Dominican Republic (%)
Place of birth for the foreign-born population - Grenada (%)
Place of birth for the foreign-born population - Haiti (%)
Place of birth for the foreign-born population - Jamaica (%)
Place of birth for the foreign-born population - St. Vincent and the Grenadines (%)
Place of birth for the foreign-born population - Trinidad and Tobago (%)
Place of birth for the foreign-born population - West Indies (%)
Place of birth for the foreign-born population - Other Caribbean (%)
Place of birth for the foreign-born population - Belize (%)
Place of birth for the foreign-born population - Costa Rica (%)
Place of birth for the foreign-born population - El Salvador (%)
Place of birth for the foreign-born population - Guatemala (%)
Place of birth for the foreign-born population - Honduras (%)
Place of birth for the foreign-born population - Mexico (%)
Place of birth for the foreign-born population - Nicaragua (%)
Place of birth for the foreign-born population - Panama (%)
Place of birth for the foreign-born population - Other Central America (%)
Place of birth for the foreign-born population - Argentina (%)
Place of birth for the foreign-born population - Bolivia (%)
Place of birth for the foreign-born population - Brazil (%)
Place of birth for the foreign-born population - Chile (%)
Place of birth for the foreign-born population - Colombia (%)
Place of birth for the foreign-born population - Ecuador (%)
Place of birth for the foreign-born population - Guyana (%)
Place of birth for the foreign-born population - Peru (%)
Place of birth for the foreign-born population - Uruguay (%)
Place of birth for the foreign-born population - Venezuela (%)
Place of birth for the foreign-born population - Other South America (%)
Place of birth for the foreign-born population - Canada (%)
Place of birth for the foreign-born population - Other Northern America (%)
Place of birth for the foreign-born population - Other (%)
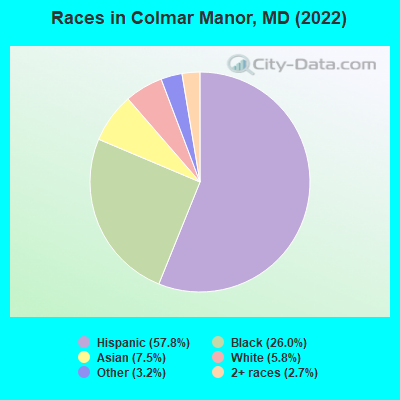
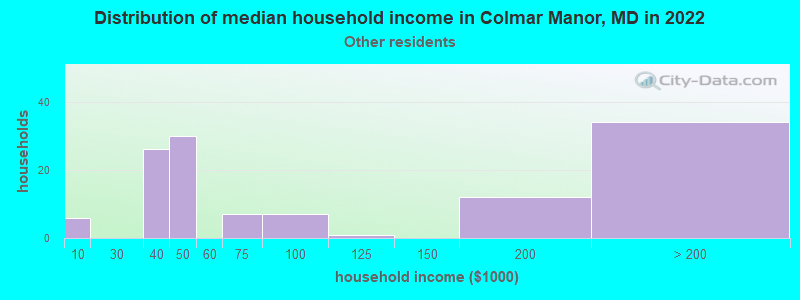
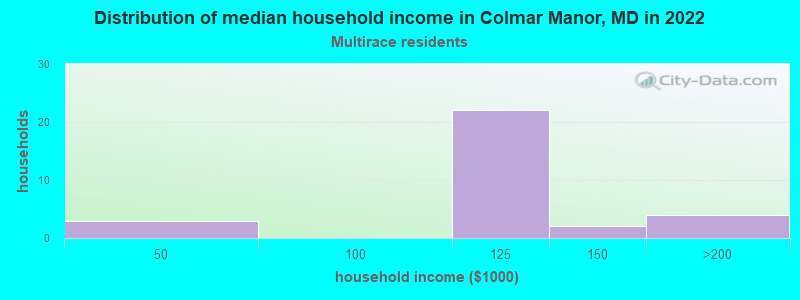
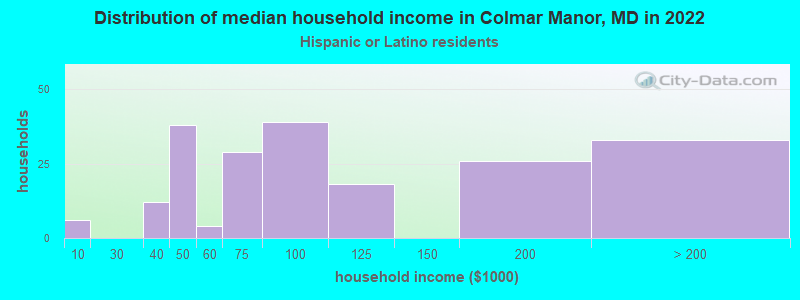
According to 2022 data, the most numerous races in Colmar Manor, MD are White alone (87 residents), Black alone (389 residents), and Hispanic (866 residents). 33.1% of Colmar Manor residents speak English at home. 38.7% of Colmar Manor, MD residents are foreign-born (27.3% born in Latin America, 5.3% born in Asia), which is 58.7% greater than the foreign-born rate of 16.0% across the entire state of Maryland.
Race distribution in Colmar Manor
2000 2022
3,286,547 62.1% White alone 1,464,735 27.7% Black alone 227,916 4.3% Hispanic 209,738 4.0% Asian alone 82,946 1.6% Two or more races 13,312 0.3% American Indian alone 9,379 0.2% Other race alone 1,913 0.04% Native Hawaiian and Other
2,906,492 47.1% White alone 1,800,914 29.2% Black alone 705,842 11.4% Hispanic 401,818 6.5% Asian alone 291,317 4.7% Two or more races 46,930 0.8% Other race alone 8,930 0.1% American Indian alone 2,417 0.04% Native Hawaiian and Other
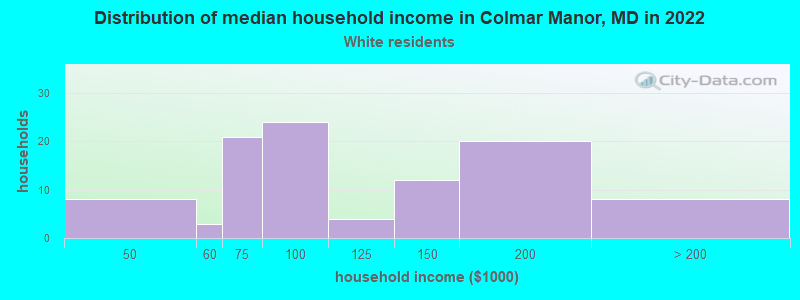
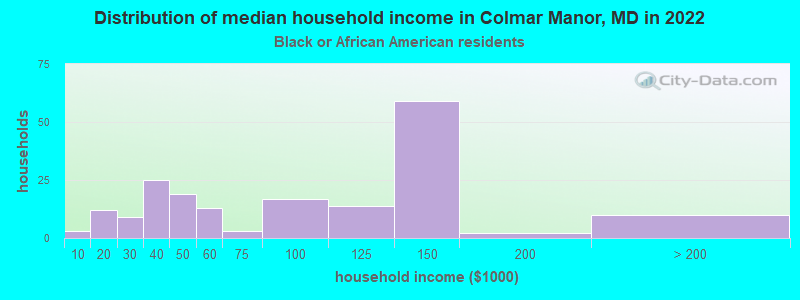
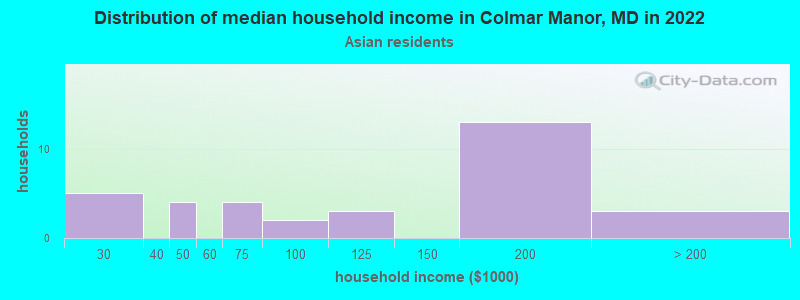
Income and house value in Colmar Manor Median household income in 2022 $128,617 White non-Hispanic householders$128,161 American Indian and Alaska Native householders$139,662 Asian householders$111,545 Two or more races householders$77,862 Hispanic or Latino race householdersMedian 2022 house value $372,565 White Non-Hispanic householders$372,186 Black or African American householders $429,795 Asian householders$379,008 Some other race householders$322,157 Two or more races householders$394,926 Hispanic or Latino householders
Median age by race in Colmar Manor
42.0 Median age for White residents45.6 41.6 47.2 Median age for Black or African American residents39.9 50.6 58.1 Median age for American Indian / Alaska Native residents66.2 47.1 42.1 Median age for Asian residents48.2 35.4 -571,600,480.8 Median age for Native Hawaiian / Pacific Islander residents-720,061,021.4 -760,942,760.2 21.5 Median age for Other race residents22.8 22.2 17.1 Median age for Two or more races residents23.0 7.3 53.0 Median age for White alone residents49.3 53.4 23.3 Median age for Hispanic or Latino residents25.3 21.8
Owner/renter occupied households by race in Colmar Manor
House owners and renters - White residents 81 84.1% Owner occupied15 15.9% Renter occupiedHouse owners and renters - Black or African American residents 152 81.2% Owner occupied35 18.8% Renter occupiedHouse owners and renters - American Indian / Alaska Native residents 9 100.0% Owner occupiedHouse owners and renters - Asian residents 33 95.5% Owner occupied2 4.5% Renter occupiedHouse owners and renters - Other race residents 63 54.9% Owner occupied52 45.1% Renter occupiedHouse owners and renters - Two or more races residents 26 100.0% Owner occupiedHouse owners and renters - White alone residents 37 73.7% Owner occupied13 26.3% Renter occupiedHouse owners and renters - Hispanic or Latino residents 142 72.9% Owner occupied53 27.1% Renter occupied
Language usage in Colmar Manor
English speakers - Total 33.1% of residents of Colmar Manor speak English at home.
53.9% of residents speak Spanish at home 413 54.7% Speak English very well342 45.3% Speak English less than very well15.6% of residents speak other language at home 179 81.7% Speak English very well40 18.3% Speak English less than very well
English speakers - Born in the United States 55.4% of residents of Colmar Manor speak English at home.
39.6% of residents speak Spanish at home 232 98.3% Speak English very well4 1.7% Speak English less than very well9.2% of residents speak other language at home 54 98.2% Speak English very well1 1.8% Speak English less than very well
English speakers - Native, born elsewhere 28.2% of residents of Colmar Manor speak English at home.
62.8% of residents speak Spanish at home 31 63.3% Speak English very well18 36.7% Speak English less than very well1.3% of residents speak other language at home 1 100.0% Speak English very well
English speakers - Foreign-born 4.9% of residents of Colmar Manor speak English at home.
67.9% of residents speak Spanish at home 82 20.6% Speak English very well317 79.4% Speak English less than very well25.9% of residents speak other language at home 117 77.0% Speak English very well35 23.0% Speak English less than very well
White (Caucasian) - Speak only English Native:
51.3% (85)Foreign-born:
7.5% (5)
White (Caucasian) - Speak another language Native:
45.2% (75)Foreign-born:
86.0% (52)
Black or African American - Speak only English Native:
84.0% (278)Foreign-born:
17.7% (14)
Black or African American - Speak another language Native:
17.8% (59)Foreign-born:
84.8% (66)
American Indian / Alaska Native - Speak another language Native:
59.3% (6)Foreign-born:
99.9% (37)
Asian - Speak only English Native:
37.6% (10)Foreign-born:
7.7% (6)
Asian - Speak another language Native:
63.6% (18)Foreign-born:
91.0% (69)
Other race - Speak another language Native:
83.8% (236)Foreign-born:
100.0% (275)
Two or more races - Speak only English Native:
37.5% (16)Foreign-born:
16.2% (6)
Two or more races - Speak another language Native:
66.3% (28)Foreign-born:
84.9% (33)
White alone - Speak another language Native:
27.7% (22)Foreign-born:
98.2% (10)
Hispanic or Latino - Speak only English Native:
11.5% (47)Foreign-born:
1.1% (4)
Hispanic or Latino - Speak another language Native:
87.6% (358)Foreign-born:
99.4% (402)
Foreign-born residents in Colmar Manor 581 residents are foreign born (27.3% Latin America , 5.3% Asia ).
This city:
38.7%Maryland:
15.7%
Marital status for residents in Colmar Manor Marital status - White (Caucasian) population 15 years and over
Males 24.6% Never married59.8% Now married0.0% Separated0.0% Widowed15.6% DivorcedFemales 25.2% Never married57.3% Now married1.0% Separated13.6% Widowed2.9% DivorcedWomen who did not give birth in the past 12 months Now married:
51.0% (22)Unmarried:
49.0% (22)
Marital status - Black or African American population 15 years and over
Males 62.2% Never married22.0% Now married0.0% Separated0.0% Widowed15.7% DivorcedFemales 47.0% Never married21.8% Now married3.9% Separated21.1% Widowed6.3% DivorcedWomen who gave birth in the past 12 months Now married:
100.0% (5)Unmarried:
0.0% (0)
Women who did not give birth in the past 12 months Now married:
26.2% (36)Unmarried:
73.8% (101)
Marital status - American Indian / Alaska Native population 15 years and over
Males 13.3% Never married73.3% Now married0.0% Separated13.3% Widowed0.0% DivorcedFemales 55.6% Never married22.2% Now married0.0% Separated22.2% Widowed0.0% DivorcedWomen who did not give birth in the past 12 months Now married:
0.0% (0)Unmarried:
100.0% (4)
Marital status - Asian population 15 years and over
Males 21.4% Never married78.6% Now married0.0% Separated0.0% Widowed0.0% DivorcedFemales 30.4% Never married66.1% Now married0.0% Separated3.6% Widowed0.0% DivorcedWomen who did not give birth in the past 12 months Now married:
54.1% (19)Unmarried:
45.9% (16)
Marital status - Other race population 15 years and over
Males 47.7% Never married51.1% Now married0.0% Separated0.0% Widowed1.3% DivorcedFemales 61.4% Never married37.6% Now married0.0% Separated0.0% Widowed1.0% DivorcedWomen who gave birth in the past 12 months Now married:
100.0% (7)Unmarried:
0.0% (0)
Women who did not give birth in the past 12 months Now married:
31.9% (64)Unmarried:
68.1% (138)
Marital status - Two or more races population 15 years and over
Males 44.0% Never married52.0% Now married0.0% Separated0.0% Widowed4.0% DivorcedFemales 12.5% Never married62.5% Now married0.0% Separated12.5% Widowed12.5% DivorcedWomen who did not give birth in the past 12 months Now married:
63.6% (8)Unmarried:
36.4% (4)
Marital status - White alone, not Hispanic / Latino population 15 years and over
Males 17.3% Never married55.8% Now married0.0% Separated0.0% Widowed26.9% DivorcedFemales 18.4% Never married55.3% Now married2.6% Separated21.1% Widowed2.6% DivorcedWomen who did not give birth in the past 12 months Now married:
84.6% (10)Unmarried:
15.4% (2)
Marital status - Hispanic or Latino population 15 years and over
Males 41.7% Never married55.1% Now married0.0% Separated0.6% Widowed2.7% DivorcedFemales 53.1% Never married42.0% Now married0.0% Separated2.8% Widowed2.1% DivorcedWomen who gave birth in the past 12 months Now married:
100.0% (6)Unmarried:
0.0% (0)
Women who did not give birth in the past 12 months Now married:
34.0% (83)Unmarried:
66.0% (162)
Ancestries in Colmar Manor
30 2.6% Ugandan25 2.2% Ethiopian22 1.9% American21 1.8% African18 1.6% Haitian18 1.6% Trinidadian and Tobagonian9 0.8% French8 0.7% English5 0.4% European4 0.3% British West Indian3 0.3% British3 0.3% Nigerian3 0.3% Welsh2 0.2% Dutch2 0.2% French Canadian
Children Nativity (place of birth) in Colmar Manor
Children under 6 years - Living with two parents Both parents native 13 100.0% NativeBoth parents foreign-born 60 100.0% NativeOne native, one foreign-born parent 4 100.0% NativeChildren under 6 years - Living with one parent Native parent 24 100.0% NativeChildren 6 to 17 years - Living with two parents Both parents native 0 11.4% Foreign-bornBoth parents foreign-born 153 83.0% Native31 17.0% Foreign-bornOne native, one foreign-born parent 32 100.0% NativeChildren 6 to 17 years - Living with one parent Native parent 0 12.4% NativeForeign-born parent 19 55.0% Native16 45.0% Foreign-born
Grandparents responsible for own grandchildren in Colmar Manor
Grandparents (30 to 59 years) White / Caucasian 1 100.0% Not responsible for grandchildrenBlack or African American 1 100.0% Not responsible for grandchildrenOther race 4 100.0% Not responsible for grandchildrenHispanic or Latino 1 100.0% Not responsible for grandchildrenGrandparents (60 years and over) White / Caucasian 5 100.0% Not responsible for grandchildrenBlack or African American 1 10.1% Responsible for grandchildren8 89.9% Not responsible for grandchildrenOther race 13 100.0% Not responsible for grandchildrenHispanic or Latino 1 5.1% Responsible for grandchildren12 94.9% Not responsible for grandchildren