Races in Cohasset, Massachusetts (MA) Detailed Stats
Ancestries, Foreign-born residents, place of birth

Recent posts about races in Cohasset, Massachusetts on our local forum with over 2,400,000 registered users:
 | Missing Cohasset Woman (199 replies) |
| Nicer house in Pembroke or hold out for Norwell scituate duxbury? (72 replies) |
| Norwell, Cohasset, Scituate or Hanover? (26 replies) |
| Hingham or Cohasset (51 replies) |
| towns that offer the most jobs per dollar of house (58 replies) |
| 2022 Real Estate Observations (1122 replies) |
Latest news about races in Cohasset, MA collected exclusively by city-data.com from local newspapers, TV, and radio stations
4.6% of Cohasset, MA residents are foreign-born (2.9% born in Europe, 0.8% born in North America, 0.5% born in Asia), which is 289.0% less than the foreign-born rate of 18.0% across the entire state of Massachusetts.
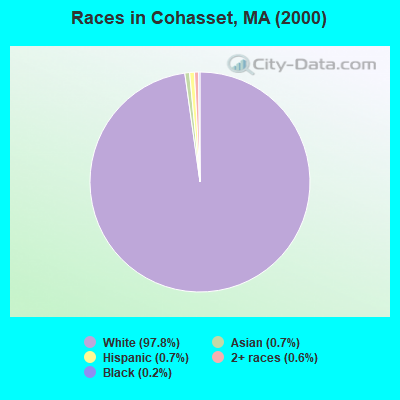
Race distribution in Cohasset

- 7,09997.8%White alone
- 500.7%Hispanic
- 510.7%Asian alone
- 410.6%Two or more races
- 130.2%Black alone
- 50.07%American Indian alone
- 20.03%Native Hawaiian and Other
Pacific Islander alone
2000
2022
-
- 5,198,35981.9%White alone
- 428,7296.8%Hispanic
- 318,3295.0%Black alone
- 236,7863.7%Asian alone
- 110,3381.7%Two or more races
- 43,5860.7%Other race alone
- 11,2640.2%American Indian alone
- 1,7060.03%Native Hawaiian and Other
Pacific Islander alone

-
- 4,676,62767.0%White alone
- 911,03813.0%Hispanic
- 501,4637.2%Asian alone
- 459,7406.6%Black alone
- 341,8894.9%Two or more races
- 84,4031.2%Other race alone
- 5,8380.08%American Indian alone
- 9760.01%Native Hawaiian and Other
Pacific Islander alone

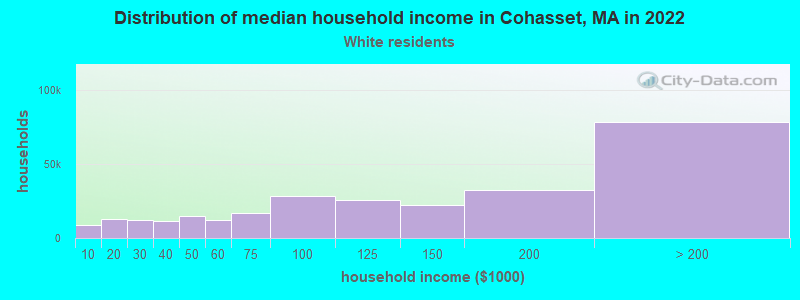
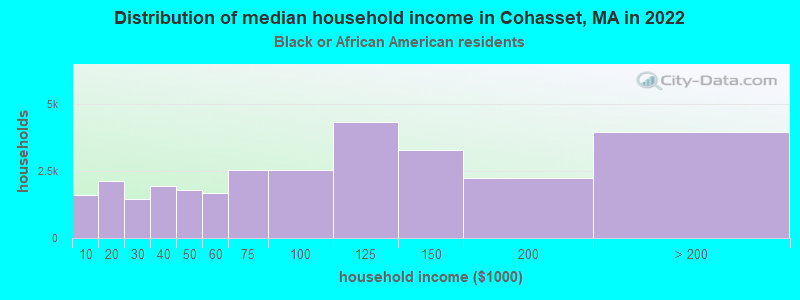
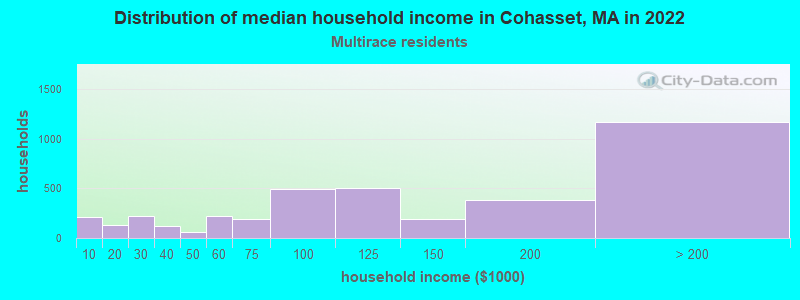
Income and house value in Cohasset
- Median household income in 2022
- $155,944White non-Hispanic householders
- $162,132Black householders
- $31,465Two or more races householders
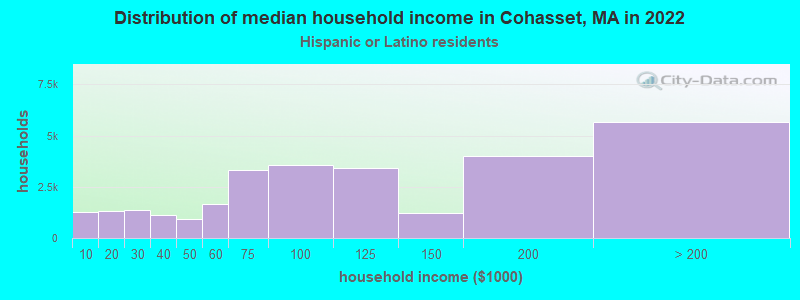
- over $200,000Hispanic or Latino race householders
- Median 2022 house value
- over $1,000,000White Non-Hispanic householders
- $789,700Hispanic or Latino householders
Household income for White non-Hispanic householders
Household income for Black householders
Household income for Two or more races householders
Household income for Hispanic or Latino race householders
Foreign-born residents in Cohasset
336 residents are foreign born (2.9% Europe, 0.8% North America, 0.5% Asia).
| This city: | 4.6% |
| Massachusetts: | 12.2% |
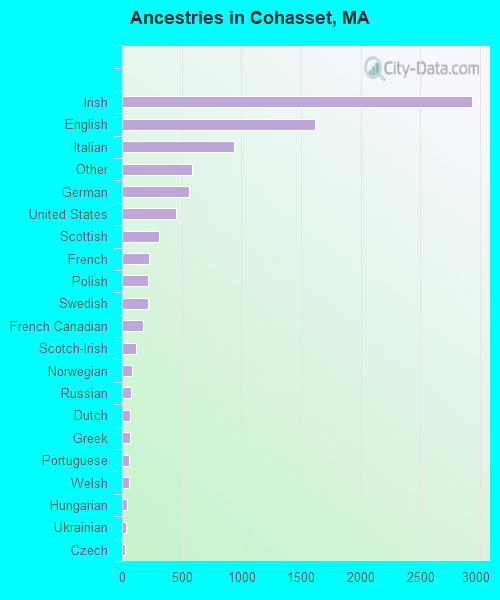
Ancestries in Cohasset

- 2,93132.8%Irish
- 1,61818.1%English
- 94310.5%Italian
- 5896.6%Other
- 5596.2%German
- 4525.1%United States
- 3103.5%Scottish
- 2292.6%French
- 2212.5%Polish
- 2172.4%Swedish
- 1752.0%French Canadian
- 1211.4%Scotch-Irish
- 800.9%Norwegian
- 730.8%Russian
- 710.8%Dutch
- 660.7%Greek
- 610.7%Portuguese
- 550.6%Welsh
- 440.5%Hungarian
- 320.4%Ukrainian
- 280.3%Czech
- 220.2%Lithuanian
- 220.2%Swiss
- 140.2%Danish
- 130.1%Slovak
Zip codes: 02025.