Races in Clinton, North Carolina (NC) Detailed Stats
Data:
Races - White alone (%)
Races - White alone (% change since 2000)
Races - Black alone (%)
Races - Black alone (% change since 2000)
Races - American Indian alone (%)
Races - American Indian alone (% change since 2000)
Races - Asian alone (%)
Races - Asian alone (% change since 2000)
Races - Hispanic (%)
Races - Hispanic (% change since 2000)
Races - Native Hawaiian and Other Pacific Islander alone (%)
Races - Native Hawaiian and Other Pacific Islander alone (% change since 2000)
Races - Two or more races(%)
Races - Two or more races(% change since 2000)
Races - Other race alone (%)
Races - Other race alone (% change since 2000)
Racial diversity
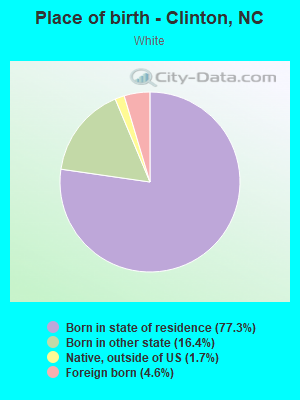
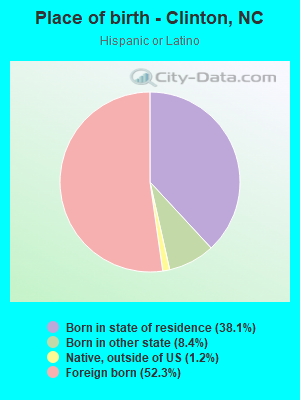
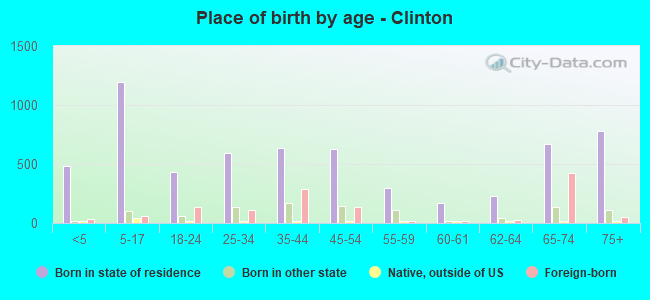
Place of birth - Born in state of residence (%)
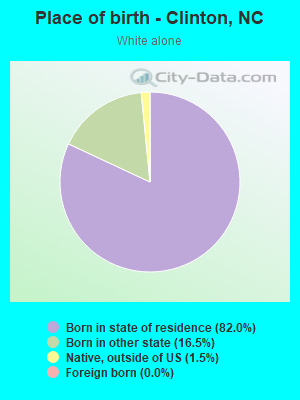
Place of birth - Born in state of residence (%) - White
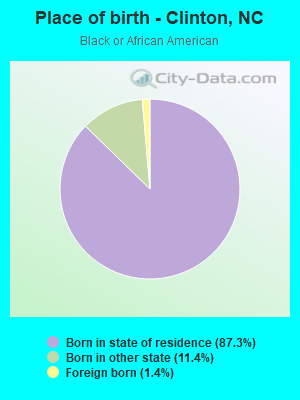
Place of birth - Born in state of residence (%) - Black or African American
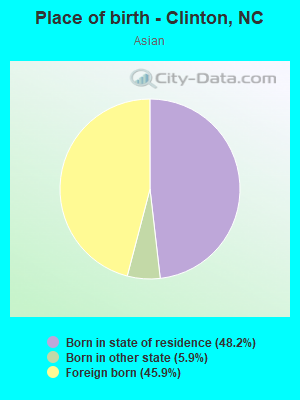
Place of birth - Born in state of residence (%) - Asian
Place of birth - Born in state of residence (%) - Hispanic or Latino
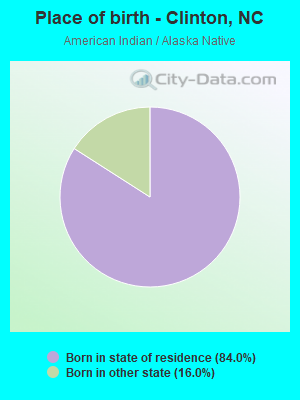
Place of birth - Born in state of residence (%) - American Indian and Alaska Native
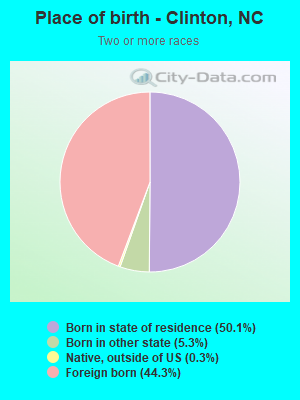
Place of birth - Born in state of residence (%) - Multirace
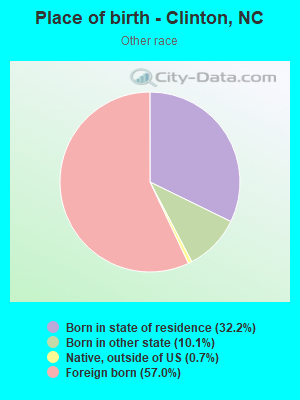
Place of birth - Born in state of residence (%) - Other Race
Place of birth - Born in other state (%)
Place of birth - Born in other state (%) - White
Place of birth - Born in other state (%) - Black or African American
Place of birth - Born in other state (%) - Asian
Place of birth - Born in other state (%) - Hispanic or Latino
Place of birth - Born in other state (%) - American Indian and Alaska Native
Place of birth - Born in other state (%) - Multirace
Place of birth - Born in other state (%) - Other Race
Place of birth - Native, outside of US (%)
Place of birth - Native, outside of US (%) - White
Place of birth - Native, outside of US (%) - Black or African American
Place of birth - Native, outside of US (%) - Asian
Place of birth - Native, outside of US (%) - Hispanic or Latino
Place of birth - Native, outside of US (%) - American Indian and Alaska Native
Place of birth - Native, outside of US (%) - Multirace
Place of birth - Native, outside of US (%) - Other Race
Place of birth - Foreign born (%)
Place of birth - Foreign born (%) - White
Place of birth - Foreign born (%) - Black or African American
Place of birth - Foreign born (%) - Asian
Place of birth - Foreign born (%) - Hispanic or Latino
Place of birth - Foreign born (%) - American Indian and Alaska Native
Place of birth - Foreign born (%) - Multirace
Place of birth - Foreign born (%) - Other Race
Residents speaking English at home (%)
Residents speaking English at home - Born in the United States (%)
Residents speaking English at home - Native, born elsewhere (%)
Residents speaking English at home - Foreign born (%)
Residents speaking Spanish at home (%)
Residents speaking Spanish at home - Born in the United States (%)
Residents speaking Spanish at home - Native, born elsewhere (%)
Residents speaking Spanish at home - Foreign born (%)
Residents speaking other language at home (%)
Residents speaking other language at home - Born in the United States (%)
Residents speaking other language at home - Native, born elsewhere (%)
Residents speaking other language at home - Foreign born (%)
Marital status - Never married (%)
Marital status - Now married (%)
Marital status - Separated (%)
Marital status - Widowed (%)
Marital status - Divorced (%)
Ancestries Reported - Arab (%)
Ancestries Reported - Czech (%)
Ancestries Reported - Danish (%)
Ancestries Reported - Dutch (%)
Ancestries Reported - English (%)
Ancestries Reported - French (%)
Ancestries Reported - French Canadian (%)
Ancestries Reported - German (%)
Ancestries Reported - Greek (%)
Ancestries Reported - Hungarian (%)
Ancestries Reported - Irish (%)
Ancestries Reported - Italian (%)
Ancestries Reported - Lithuanian (%)
Ancestries Reported - Norwegian (%)
Ancestries Reported - Polish (%)
Ancestries Reported - Portuguese (%)
Ancestries Reported - Russian (%)
Ancestries Reported - Scotch-Irish (%)
Ancestries Reported - Scottish (%)
Ancestries Reported - Slovak (%)
Ancestries Reported - Subsaharan African (%)
Ancestries Reported - Swedish (%)
Ancestries Reported - Swiss (%)
Ancestries Reported - Ukrainian (%)
Ancestries Reported - United States (%)
Ancestries Reported - Welsh (%)
Ancestries Reported - West Indian (%)
Ancestries Reported - Other (%)
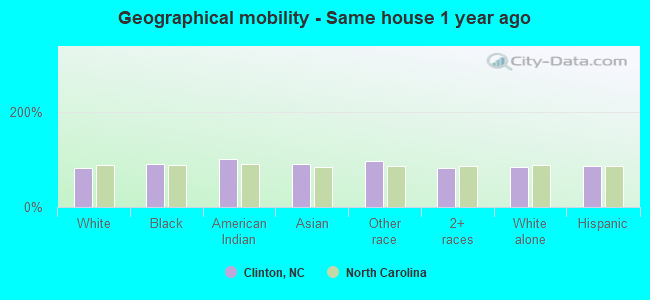
Geographical mobility - Same house 1 year ago (%)
Geographical mobility - Same house 1 year ago (%) - White
Geographical mobility - Same house 1 year ago (%) - Black or African American
Geographical mobility - Same house 1 year ago (%) - Asian
Geographical mobility - Same house 1 year ago (%) - Hispanic or Latino
Geographical mobility - Same house 1 year ago (%) - American Indian and Alaska Native
Geographical mobility - Same house 1 year ago (%) - Multirace
Geographical mobility - Same house 1 year ago (%) - Other Race
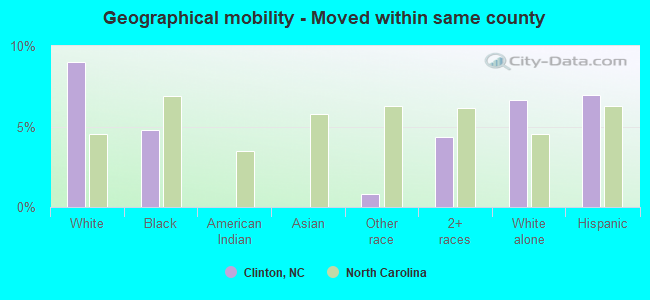
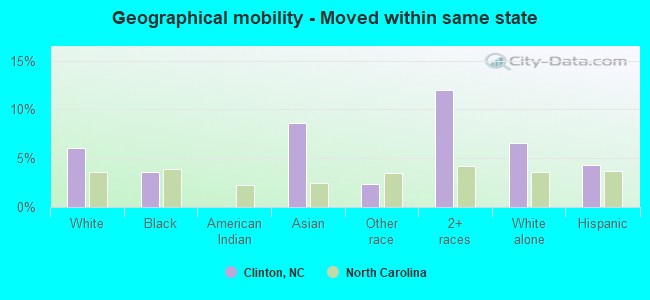
Geographical mobility - Moved within same county (%)
Geographical mobility - Moved within same county (%) - White
Geographical mobility - Moved within same county (%) - Black or African American
Geographical mobility - Moved within same county (%) - Asian
Geographical mobility - Moved within same county (%) - Hispanic or Latino
Geographical mobility - Moved within same county (%) - American Indian and Alaska Native
Geographical mobility - Moved within same county (%) - Multirace
Geographical mobility - Moved within same county (%) - Other Race
Geographical mobility - Moved from different county within same state (%)
Geographical mobility - Moved from different county within same state (%) - White
Geographical mobility - Moved from different county within same state (%) - Black or African American
Geographical mobility - Moved from different county within same state (%) - Asian
Geographical mobility - Moved from different county within same state (%) - Hispanic or Latino
Geographical mobility - Moved from different county within same state (%) - American Indian and Alaska Native
Geographical mobility - Moved from different county within same state (%) - Multirace
Geographical mobility - Moved from different county within same state (%) - Other Race
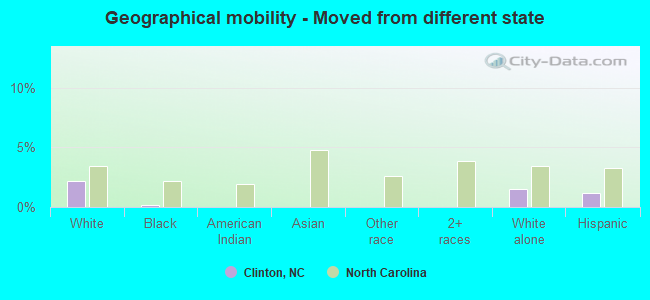
Geographical mobility - Moved from different state (%)
Geographical mobility - Moved from different state (%) - White
Geographical mobility - Moved from different state (%) - Black or African American
Geographical mobility - Moved from different state (%) - Asian
Geographical mobility - Moved from different state (%) - Hispanic or Latino
Geographical mobility - Moved from different state (%) - American Indian and Alaska Native
Geographical mobility - Moved from different state (%) - Multirace
Geographical mobility - Moved from different state (%) - Other Race
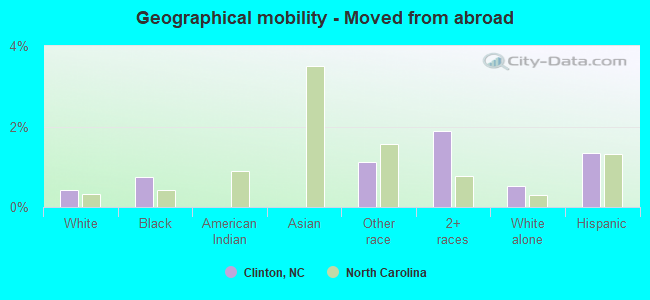
Geographical mobility - Moved from abroad (%)
Geographical mobility - Moved from abroad (%) - White
Geographical mobility - Moved from abroad (%) - Black or African American
Geographical mobility - Moved from abroad (%) - Asian
Geographical mobility - Moved from abroad (%) - Hispanic or Latino
Geographical mobility - Moved from abroad (%) - American Indian and Alaska Native
Geographical mobility - Moved from abroad (%) - Multirace
Geographical mobility - Moved from abroad (%) - Other Race
Place of birth for the foreign-born population - Ireland (%)
Place of birth for the foreign-born population - Denmark (%)
Place of birth for the foreign-born population - Norway (%)
Place of birth for the foreign-born population - Sweden (%)
Place of birth for the foreign-born population - United Kingdom (%)
Place of birth for the foreign-born population - England (%)
Place of birth for the foreign-born population - Scotland (%)
Place of birth for the foreign-born population - Other Northern Europe (%)
Place of birth for the foreign-born population - Austria (%)
Place of birth for the foreign-born population - Belgium (%)
Place of birth for the foreign-born population - France (%)
Place of birth for the foreign-born population - Germany (%)
Place of birth for the foreign-born population - Netherlands (%)
Place of birth for the foreign-born population - Switzerland (%)
Place of birth for the foreign-born population - Other Western Europe (%)
Place of birth for the foreign-born population - Greece (%)
Place of birth for the foreign-born population - Italy (%)
Place of birth for the foreign-born population - Portugal (%)
Place of birth for the foreign-born population - Spain (%)
Place of birth for the foreign-born population - Other Southern Europe (%)
Place of birth for the foreign-born population - Albania (%)
Place of birth for the foreign-born population - Belarus (%)
Place of birth for the foreign-born population - Bosnia and Herzegovina (%)
Place of birth for the foreign-born population - Bulgaria (%)
Place of birth for the foreign-born population - Croatia (%)
Place of birth for the foreign-born population - Czechoslovakia (%)
Place of birth for the foreign-born population - Hungary (%)
Place of birth for the foreign-born population - Latvia (%)
Place of birth for the foreign-born population - Lithuania (%)
Place of birth for the foreign-born population - North Macedonia (Macedonia) (%)
Place of birth for the foreign-born population - Moldova (%)
Place of birth for the foreign-born population - Poland (%)
Place of birth for the foreign-born population - Romania (%)
Place of birth for the foreign-born population - Russia (%)
Place of birth for the foreign-born population - Serbia (%)
Place of birth for the foreign-born population - Ukraine (%)
Place of birth for the foreign-born population - Other Eastern Europe (%)
Place of birth for the foreign-born population - China (%)
Place of birth for the foreign-born population - Hong Kong (%)
Place of birth for the foreign-born population - Taiwan (%)
Place of birth for the foreign-born population - Japan (%)
Place of birth for the foreign-born population - Korea (%)
Place of birth for the foreign-born population - Other Eastern Asia (%)
Place of birth for the foreign-born population - Afghanistan (%)
Place of birth for the foreign-born population - Bangladesh (%)
Place of birth for the foreign-born population - India (%)
Place of birth for the foreign-born population - Iran (%)
Place of birth for the foreign-born population - Kazakhstan (%)
Place of birth for the foreign-born population - Nepal (%)
Place of birth for the foreign-born population - Pakistan (%)
Place of birth for the foreign-born population - Sri Lanka (%)
Place of birth for the foreign-born population - Uzbekistan (%)
Place of birth for the foreign-born population - Other South Central Asia (%)
Place of birth for the foreign-born population - Burma (%)
Place of birth for the foreign-born population - Cambodia (%)
Place of birth for the foreign-born population - Indonesia (%)
Place of birth for the foreign-born population - Laos (%)
Place of birth for the foreign-born population - Malaysia (%)
Place of birth for the foreign-born population - Philippines (%)
Place of birth for the foreign-born population - Singapore (%)
Place of birth for the foreign-born population - Thailand (%)
Place of birth for the foreign-born population - Vietnam (%)
Place of birth for the foreign-born population - Other South Eastern Asia (%)
Place of birth for the foreign-born population - Armenia (%)
Place of birth for the foreign-born population - Iraq (%)
Place of birth for the foreign-born population - Israel (%)
Place of birth for the foreign-born population - Jordan (%)
Place of birth for the foreign-born population - Kuwait (%)
Place of birth for the foreign-born population - Lebanon (%)
Place of birth for the foreign-born population - Saudi Arabia (%)
Place of birth for the foreign-born population - Syria (%)
Place of birth for the foreign-born population - Turkey (%)
Place of birth for the foreign-born population - Yemen (%)
Place of birth for the foreign-born population - Other Western Asia (%)
Place of birth for the foreign-born population - Eritrea (%)
Place of birth for the foreign-born population - Ethiopia (%)
Place of birth for the foreign-born population - Kenya (%)
Place of birth for the foreign-born population - Somalia (%)
Place of birth for the foreign-born population - Uganda (%)
Place of birth for the foreign-born population - Zimbabwe (%)
Place of birth for the foreign-born population - Other Eastern Africa (%)
Place of birth for the foreign-born population - Cameroon (%)
Place of birth for the foreign-born population - Congo (%)
Place of birth for the foreign-born population - Democratic Republic of Congo (Zaire) (%)
Place of birth for the foreign-born population - Other Middle Africa (%)
Place of birth for the foreign-born population - Egypt (%)
Place of birth for the foreign-born population - Morocco (%)
Place of birth for the foreign-born population - Sudan (%)
Place of birth for the foreign-born population - Other Northern Africa (%)
Place of birth for the foreign-born population - South Africa (%)
Place of birth for the foreign-born population - Other Southern Africa (%)
Place of birth for the foreign-born population - Cabo Verde (%)
Place of birth for the foreign-born population - Ghana (%)
Place of birth for the foreign-born population - Liberia (%)
Place of birth for the foreign-born population - Nigeria (%)
Place of birth for the foreign-born population - Senegal (%)
Place of birth for the foreign-born population - Sierra Leone (%)
Place of birth for the foreign-born population - Other Western Africa (%)
Place of birth for the foreign-born population - Australia (%)
Place of birth for the foreign-born population - New Zealand (%)
Place of birth for the foreign-born population - Fiji (%)
Place of birth for the foreign-born population - Micronesia (%)
Place of birth for the foreign-born population - Bahamas (%)
Place of birth for the foreign-born population - Barbados (%)
Place of birth for the foreign-born population - Cuba (%)
Place of birth for the foreign-born population - Dominica (%)
Place of birth for the foreign-born population - Dominican Republic (%)
Place of birth for the foreign-born population - Grenada (%)
Place of birth for the foreign-born population - Haiti (%)
Place of birth for the foreign-born population - Jamaica (%)
Place of birth for the foreign-born population - St. Vincent and the Grenadines (%)
Place of birth for the foreign-born population - Trinidad and Tobago (%)
Place of birth for the foreign-born population - West Indies (%)
Place of birth for the foreign-born population - Other Caribbean (%)
Place of birth for the foreign-born population - Belize (%)
Place of birth for the foreign-born population - Costa Rica (%)
Place of birth for the foreign-born population - El Salvador (%)
Place of birth for the foreign-born population - Guatemala (%)
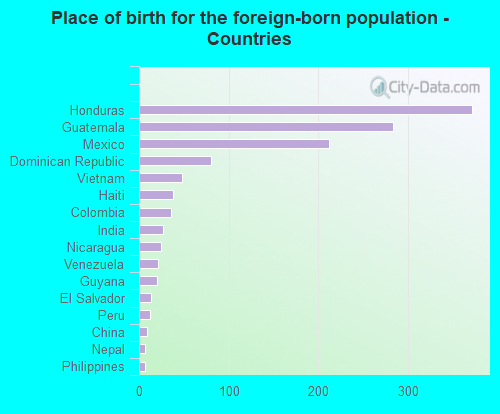
Place of birth for the foreign-born population - Honduras (%)
Place of birth for the foreign-born population - Mexico (%)
Place of birth for the foreign-born population - Nicaragua (%)
Place of birth for the foreign-born population - Panama (%)
Place of birth for the foreign-born population - Other Central America (%)
Place of birth for the foreign-born population - Argentina (%)
Place of birth for the foreign-born population - Bolivia (%)
Place of birth for the foreign-born population - Brazil (%)
Place of birth for the foreign-born population - Chile (%)
Place of birth for the foreign-born population - Colombia (%)
Place of birth for the foreign-born population - Ecuador (%)
Place of birth for the foreign-born population - Guyana (%)
Place of birth for the foreign-born population - Peru (%)
Place of birth for the foreign-born population - Uruguay (%)
Place of birth for the foreign-born population - Venezuela (%)
Place of birth for the foreign-born population - Other South America (%)
Place of birth for the foreign-born population - Canada (%)
Place of birth for the foreign-born population - Other Northern America (%)
Place of birth for the foreign-born population - Other (%)
Latest news about races in Clinton, NC collected exclusively by city-data.com from local newspapers, TV, and radio stations
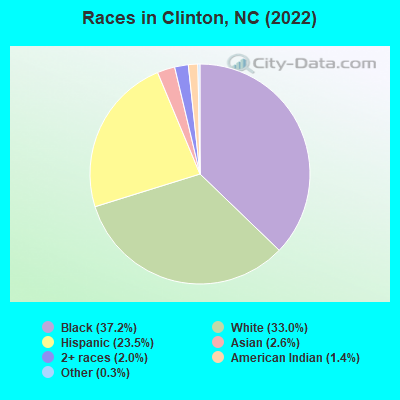
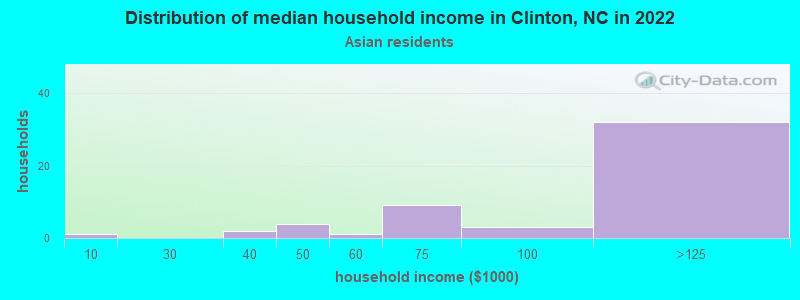
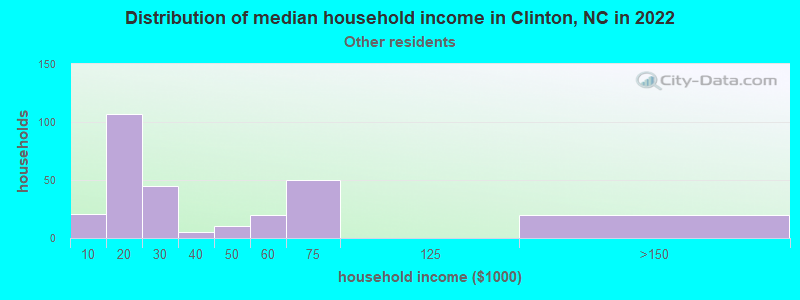
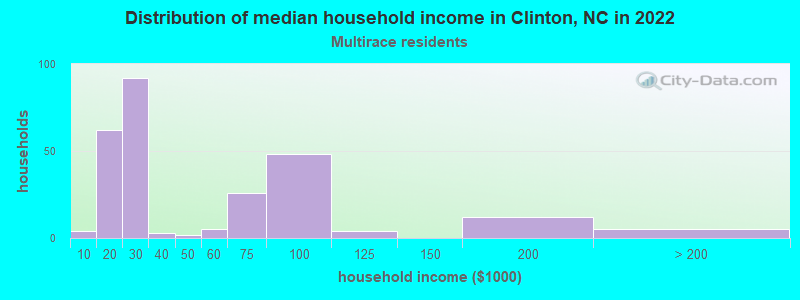
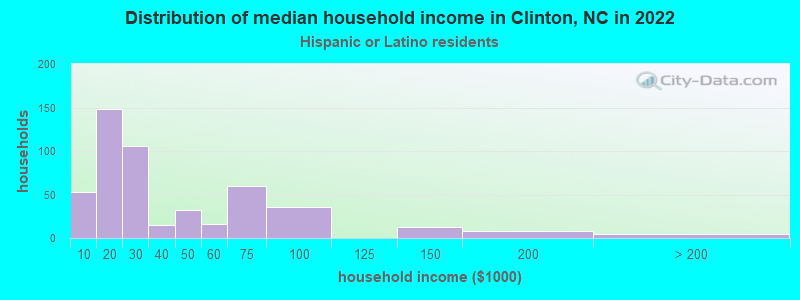
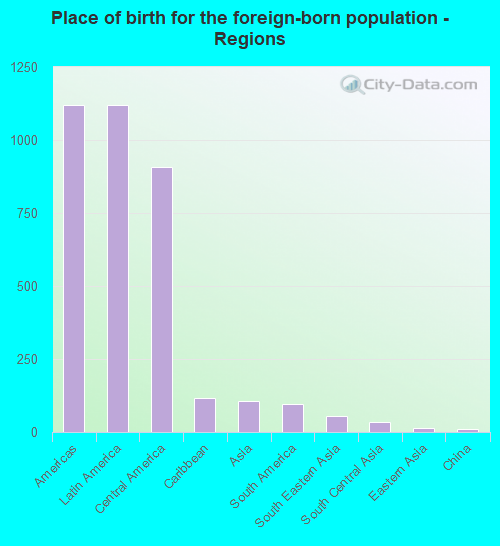
According to 2022 data, the most numerous races in Clinton, NC are White alone (2,821 residents), Black alone (3,176 residents), and Hispanic (2,005 residents). 79.3% of Clinton residents speak English at home. 14.5% of Clinton, NC residents are foreign-born (12.7% born in Latin America), which is 44.6% greater than the foreign-born rate of 8.0% across the entire state of North Carolina.
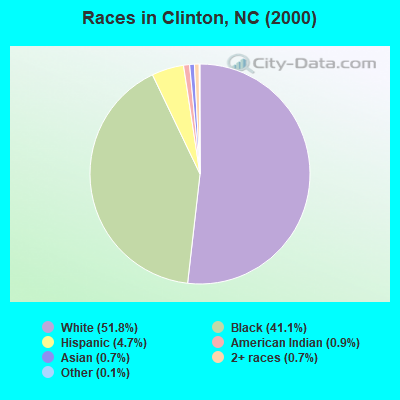
Race distribution in Clinton
2000 2022
5,647,155 70.2% White alone 1,723,301 21.4% Black alone 378,963 4.7% Hispanic 112,416 1.4% Asian alone 95,333 1.2% American Indian alone 79,965 1.0% Two or more races 9,015 0.1% Other race alone 3,165 0.04% Native Hawaiian and Other
6,497,519 60.7% White alone 2,155,650 20.1% Black alone 1,114,799 10.4% Hispanic 438,061 4.1% Two or more races 341,052 3.2% Asian alone 91,758 0.9% American Indian alone 50,180 0.5% Other race alone 9,954 0.09% Native Hawaiian and Other
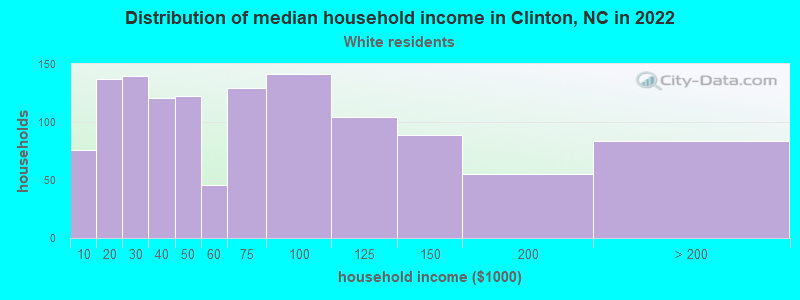
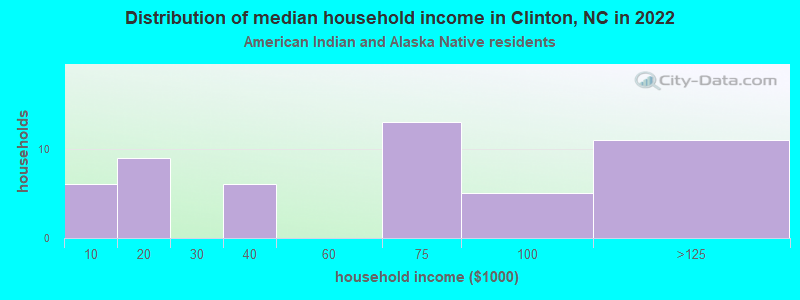
Income and house value in Clinton Median household income in 2022 $60,022 White non-Hispanic householders$30,801 Black householders$64,029 American Indian and Alaska Native householders$104,460 Asian householders$22,875 Some other race householders$26,803 Two or more races householders$26,845 Hispanic or Latino race householdersMedian 2022 house value $209,310 White Non-Hispanic householders$157,592 Black or African American householders$134,173 Some other race householders$143,443 Hispanic or Latino householders
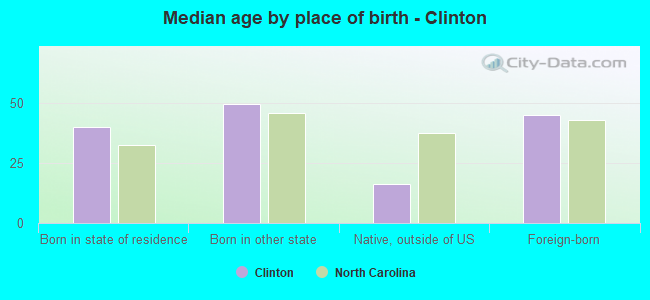
Median age by race in Clinton
49.9 Median age for White residents44.3 56.8 41.2 Median age for Black or African American residents40.9 42.3 21.8 Median age for American Indian / Alaska Native residents19.0 22.3 24.7 Median age for Asian residents36.1 23.5 -609,884,331.7 Median age for Native Hawaiian / Pacific Islander residents-611,708,482.1 -612,403,100.2 41.2 Median age for Other race residents35.4 67.6 21.5 Median age for Two or more races residents30.7 11.6 53.1 Median age for White alone residents47.4 58.5 35.5 Median age for Hispanic or Latino residents34.8 39.5
Owner/renter occupied households by race in Clinton
House owners and renters - White residents 814 65.3% Owner occupied432 34.7% Renter occupiedHouse owners and renters - Black or African American residents 343 27.6% Owner occupied901 72.4% Renter occupiedHouse owners and renters - American Indian / Alaska Native residents 35 66.4% Owner occupied18 33.6% Renter occupiedHouse owners and renters - Asian residents 36 68.6% Owner occupied17 31.4% Renter occupiedHouse owners and renters - Other race residents 108 38.6% Owner occupied172 61.4% Renter occupiedHouse owners and renters - Two or more races residents 188 66.3% Owner occupied96 33.7% Renter occupiedHouse owners and renters - White alone residents 789 66.1% Owner occupied404 33.9% Renter occupiedHouse owners and renters - Hispanic or Latino residents 252 49.8% Owner occupied253 50.2% Renter occupied
Language usage in Clinton
English speakers - Total 79.3% of residents of Clinton speak English at home.
18.4% of residents speak Spanish at home 823 55.9% Speak English very well650 44.1% Speak English less than very well2.2% of residents speak other language at home 65 36.3% Speak English very well114 63.7% Speak English less than very well
English speakers - Born in the United States 88.8% of residents of Clinton speak English at home.
10.9% of residents speak Spanish at home 85 75.9% Speak English very well27 24.1% Speak English less than very well0.3% of residents speak other language at home 3 100.0% Speak English very well
English speakers - Native, born elsewhere 65.3% of residents of Clinton speak English at home.
33.3% of residents speak Spanish at home 12 50.0% Speak English very well12 50.0% Speak English less than very well
English speakers - Foreign-born 5.9% of residents of Clinton speak English at home.
80.0% of residents speak Spanish at home 420 43.7% Speak English very well541 56.3% Speak English less than very well11.2% of residents speak other language at home 30 22.2% Speak English very well105 77.8% Speak English less than very well
White (Caucasian) - Speak another language Native:
2.6% (72)Foreign-born:
83.5% (106)
Black or African American - Speak only English Native:
98.4% (2,943)Foreign-born:
20.8% (9)
Black or African American - Speak another language Native:
1.6% (49)Foreign-born:
78.9% (34)
Asian - Speak only English Native:
79.9% (98)Foreign-born:
5.0% (5)
Asian - Speak another language Native:
19.8% (24)Foreign-born:
95.3% (99)
Other race - Speak another language Native:
68.1% (296)Foreign-born:
100.0% (700)
Two or more races - Speak only English Native:
69.5% (258)Foreign-born:
18.2% (72)
Two or more races - Speak another language Native:
31.6% (117)Foreign-born:
81.0% (320)
White alone - Speak another language Native:
0.7% (18)Foreign-born:
99.9% (1)
Hispanic or Latino - Speak only English Native:
36.0% (265)Foreign-born:
3.4% (34)
Hispanic or Latino - Speak another language Native:
63.6% (467)Foreign-born:
96.6% (970)
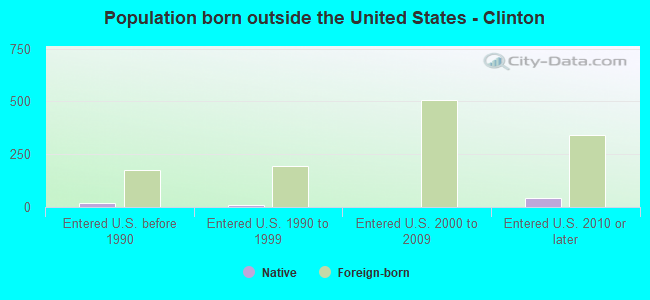
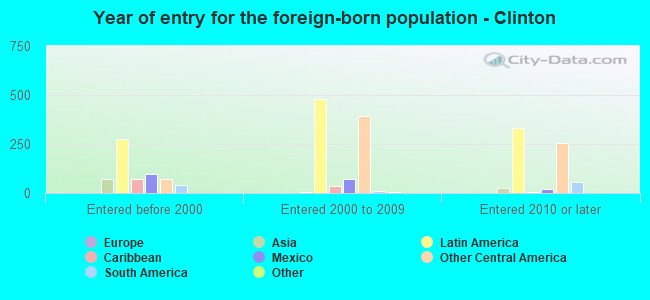
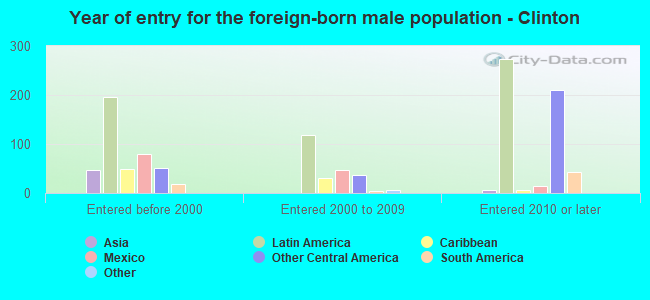
Foreign-born residents in Clinton 1,235 residents are foreign born (12.7% Latin America ).
This city:
14.5%North Carolina:
8.3%
Marital status for residents in Clinton Marital status - White (Caucasian) population 15 years and over
Males 31.9% Never married50.2% Now married1.8% Separated5.8% Widowed10.4% DivorcedFemales 17.3% Never married39.1% Now married4.5% Separated21.8% Widowed17.2% DivorcedWomen who gave birth in the past 12 months Now married:
100.0% (19)Unmarried:
0.0% (0)
Women who did not give birth in the past 12 months Now married:
45.5% (217)Unmarried:
54.5% (260)
Marital status - Black or African American population 15 years and over
Males 57.0% Never married24.9% Now married3.8% Separated1.7% Widowed12.5% DivorcedFemales 40.2% Never married21.5% Now married3.9% Separated17.4% Widowed16.9% DivorcedWomen who gave birth in the past 12 months Now married:
15.0% (6)Unmarried:
85.0% (34)
Women who did not give birth in the past 12 months Now married:
24.8% (162)Unmarried:
75.2% (489)
Marital status - American Indian / Alaska Native population 15 years and over
Males 45.1% Never married43.1% Now married11.8% Separated0.0% Widowed0.0% DivorcedFemales 47.0% Never married53.0% Now married0.0% Separated0.0% Widowed0.0% DivorcedWomen who did not give birth in the past 12 months Now married:
46.6% (29)Unmarried:
53.4% (33)
Marital status - Asian population 15 years and over
Males 47.7% Never married40.4% Now married0.0% Separated11.9% Widowed0.0% DivorcedFemales 48.6% Never married32.9% Now married0.0% Separated18.6% Widowed0.0% DivorcedWomen who did not give birth in the past 12 months Now married:
35.8% (20)Unmarried:
64.2% (36)
Marital status - Other race population 15 years and over
Males 40.2% Never married36.5% Now married14.3% Separated0.0% Widowed9.0% DivorcedFemales 17.6% Never married19.2% Now married8.1% Separated48.8% Widowed6.4% DivorcedWomen who gave birth in the past 12 months Now married:
0.0% (0)Unmarried:
100.0% (5)
Women who did not give birth in the past 12 months Now married:
30.4% (52)Unmarried:
69.6% (119)
Marital status - Two or more races population 15 years and over
Males 50.6% Never married14.6% Now married10.4% Separated24.4% Widowed0.0% DivorcedFemales 18.0% Never married28.1% Now married46.1% Separated3.4% Widowed4.5% DivorcedWomen who gave birth in the past 12 months Now married:
100.0% (3)Unmarried:
0.0% (0)
Women who did not give birth in the past 12 months Now married:
72.2% (71)Unmarried:
27.8% (27)
Marital status - White alone, not Hispanic / Latino population 15 years and over
Males 29.6% Never married52.3% Now married0.5% Separated6.1% Widowed11.5% DivorcedFemales 13.7% Never married40.2% Now married4.8% Separated22.9% Widowed18.4% DivorcedWomen who gave birth in the past 12 months Now married:
100.0% (13)Unmarried:
0.0% (0)
Women who did not give birth in the past 12 months Now married:
51.4% (217)Unmarried:
48.6% (205)
Marital status - Hispanic or Latino population 15 years and over
Males 47.2% Never married26.5% Now married13.8% Separated8.6% Widowed3.9% DivorcedFemales 26.1% Never married20.8% Now married11.5% Separated36.3% Widowed5.2% DivorcedWomen who gave birth in the past 12 months Now married:
69.2% (10)Unmarried:
30.8% (4)
Women who did not give birth in the past 12 months Now married:
35.5% (107)Unmarried:
64.5% (194)
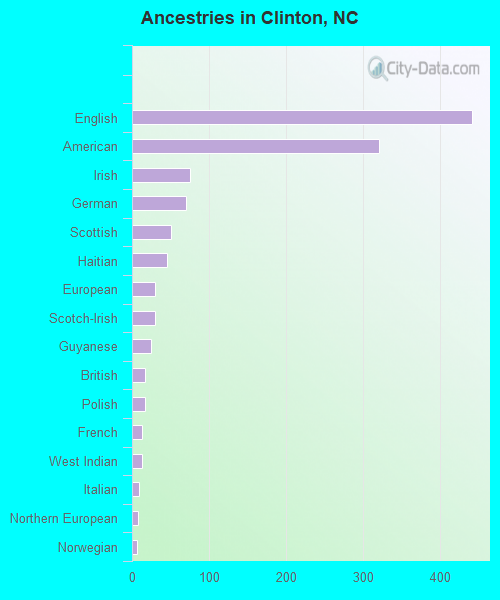
Ancestries in Clinton
441 7.2% English321 5.3% American75 1.2% Irish70 1.1% German50 0.8% Scottish45 0.7% Haitian30 0.5% European30 0.5% Scotch-Irish25 0.4% Guyanese17 0.3% British17 0.3% Polish13 0.2% French13 0.2% West Indian9 0.1% Italian8 0.1% Northern European7 0.1% Norwegian3 0.05% Welsh2 0.03% Lebanese2 0.03% Dutch2 0.03% Eastern European2 0.03% Greek
Geographical mobility in Clinton Same house 1 year ago 2,476 81.0% White (Caucasian)2,885 91.2% Black or African American173 100.0% American Indian / Alaska Native205 91.4% Asian1,227 96.4% Other race720 82.3% Two or more races2,362 84.1% White alone, not Hispanic / Latino1,707 86.2% Hispanic or LatinoMoved within same county 276 9.0% White / Caucasian152 4.8% Black or African American10 0.8% Other race38 4.3% Two or more races187 6.7% White alone, not Hispanic / Latino138 7.0% Hispanic or LatinoMoved within same state 184 6.0% White / Caucasian115 3.6% Black or African American19 8.6% Asian30 2.4% Other race105 12.0% Two or more races183 6.5% White alone, not Hispanic / Latino85 4.3% Hispanic or LatinoMoved from different state 67 2.2% White / Caucasian5 0.2% Black or African American43 1.5% White alone, not Hispanic / Latino24 1.2% Hispanic or LatinoMoved from abroad 13 0.4% White24 0.8% Black or African American14 1.1% Other race16 1.9% Two or more races15 0.5% White alone, not Hispanic / Latino26 1.3% Hispanic or Latino
Children Nativity (place of birth) in Clinton
Children under 6 years - Living with two parents Both parents native 115 100.0% Native0 0.0% Foreign-bornBoth parents foreign-born 98 84.5% Native18 15.5% Foreign-bornOne native, one foreign-born parent 11 100.0% NativeChildren under 6 years - Living with one parent Native parent 297 100.0% NativeForeign-born parent 76 86.4% Native12 13.6% Foreign-bornChildren 6 to 17 years - Living with two parents Both parents native 360 100.0% NativeBoth parents foreign-born 104 89.9% Native12 10.1% Foreign-bornOne native, one foreign-born parent 39 100.0% NativeChildren 6 to 17 years - Living with one parent Native parent 521 100.0% NativeForeign-born parent 101 56.3% Native78 43.7% Foreign-born
Grandparents responsible for own grandchildren in Clinton
Grandparents (30 to 59 years) White / Caucasian 2 14.9% Responsible for grandchildren10 85.1% Not responsible for grandchildrenBlack or African American 56 61.5% Responsible for grandchildren35 38.5% Not responsible for grandchildrenAmerican Indian / Alaska Native 23 100.0% Not responsible for grandchildrenAsian 40 100.0% Not responsible for grandchildrenWhite alone, not Hispanic / Latino 2 100.0% Responsible for grandchildrenHispanic or Latino 15 100.0% Not responsible for grandchildrenGrandparents (60 years and over) White / Caucasian 13 65.1% Responsible for grandchildren7 34.9% Not responsible for grandchildrenBlack or African American 7 31.6% Responsible for grandchildren14 68.4% Not responsible for grandchildrenAsian 26 100.0% Not responsible for grandchildrenWhite alone, not Hispanic / Latino 14 65.2% Responsible for grandchildren7 34.8% Not responsible for grandchildrenHispanic or Latino 204 100.0% Not responsible for grandchildren