Races in Clearfield, Utah (UT) Detailed Stats
Data:
Races - White alone (%)
Races - White alone (% change since 2000)
Races - Black alone (%)
Races - Black alone (% change since 2000)
Races - American Indian alone (%)
Races - American Indian alone (% change since 2000)
Races - Asian alone (%)
Races - Asian alone (% change since 2000)
Races - Hispanic (%)
Races - Hispanic (% change since 2000)
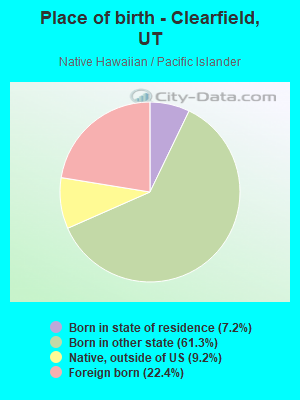
Races - Native Hawaiian and Other Pacific Islander alone (%)
Races - Native Hawaiian and Other Pacific Islander alone (% change since 2000)
Races - Two or more races(%)
Races - Two or more races(% change since 2000)
Races - Other race alone (%)
Races - Other race alone (% change since 2000)
Racial diversity
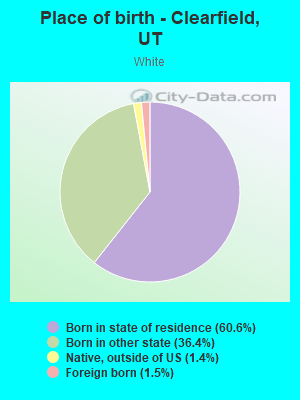
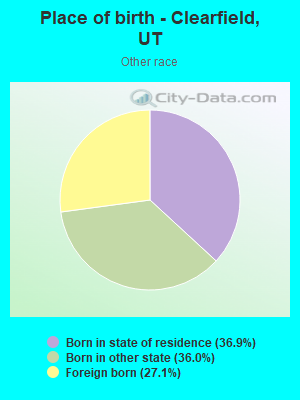
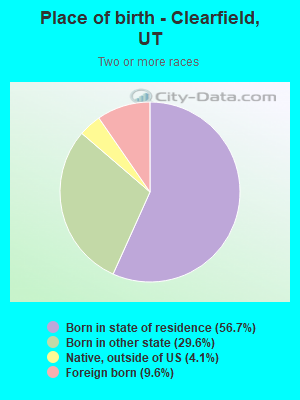
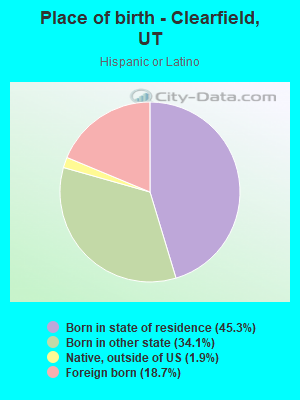
Place of birth - Born in state of residence (%)
Place of birth - Born in state of residence (%) - White
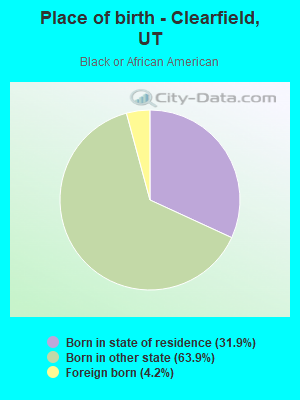
Place of birth - Born in state of residence (%) - Black or African American
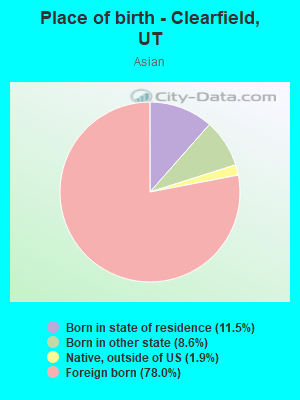
Place of birth - Born in state of residence (%) - Asian
Place of birth - Born in state of residence (%) - Hispanic or Latino
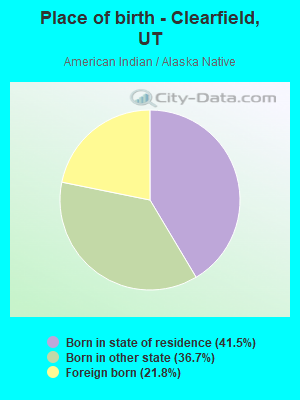
Place of birth - Born in state of residence (%) - American Indian and Alaska Native
Place of birth - Born in state of residence (%) - Multirace
Place of birth - Born in state of residence (%) - Other Race
Place of birth - Born in other state (%)
Place of birth - Born in other state (%) - White
Place of birth - Born in other state (%) - Black or African American
Place of birth - Born in other state (%) - Asian
Place of birth - Born in other state (%) - Hispanic or Latino
Place of birth - Born in other state (%) - American Indian and Alaska Native
Place of birth - Born in other state (%) - Multirace
Place of birth - Born in other state (%) - Other Race
Place of birth - Native, outside of US (%)
Place of birth - Native, outside of US (%) - White
Place of birth - Native, outside of US (%) - Black or African American
Place of birth - Native, outside of US (%) - Asian
Place of birth - Native, outside of US (%) - Hispanic or Latino
Place of birth - Native, outside of US (%) - American Indian and Alaska Native
Place of birth - Native, outside of US (%) - Multirace
Place of birth - Native, outside of US (%) - Other Race
Place of birth - Foreign born (%)
Place of birth - Foreign born (%) - White
Place of birth - Foreign born (%) - Black or African American
Place of birth - Foreign born (%) - Asian
Place of birth - Foreign born (%) - Hispanic or Latino
Place of birth - Foreign born (%) - American Indian and Alaska Native
Place of birth - Foreign born (%) - Multirace
Place of birth - Foreign born (%) - Other Race
Residents speaking English at home (%)
Residents speaking English at home - Born in the United States (%)
Residents speaking English at home - Native, born elsewhere (%)
Residents speaking English at home - Foreign born (%)
Residents speaking Spanish at home (%)
Residents speaking Spanish at home - Born in the United States (%)
Residents speaking Spanish at home - Native, born elsewhere (%)
Residents speaking Spanish at home - Foreign born (%)
Residents speaking other language at home (%)
Residents speaking other language at home - Born in the United States (%)
Residents speaking other language at home - Native, born elsewhere (%)
Residents speaking other language at home - Foreign born (%)
Marital status - Never married (%)
Marital status - Now married (%)
Marital status - Separated (%)
Marital status - Widowed (%)
Marital status - Divorced (%)
Ancestries Reported - Arab (%)
Ancestries Reported - Czech (%)
Ancestries Reported - Danish (%)
Ancestries Reported - Dutch (%)
Ancestries Reported - English (%)
Ancestries Reported - French (%)
Ancestries Reported - French Canadian (%)
Ancestries Reported - German (%)
Ancestries Reported - Greek (%)
Ancestries Reported - Hungarian (%)
Ancestries Reported - Irish (%)
Ancestries Reported - Italian (%)
Ancestries Reported - Lithuanian (%)
Ancestries Reported - Norwegian (%)
Ancestries Reported - Polish (%)
Ancestries Reported - Portuguese (%)
Ancestries Reported - Russian (%)
Ancestries Reported - Scotch-Irish (%)
Ancestries Reported - Scottish (%)
Ancestries Reported - Slovak (%)
Ancestries Reported - Subsaharan African (%)
Ancestries Reported - Swedish (%)
Ancestries Reported - Swiss (%)
Ancestries Reported - Ukrainian (%)
Ancestries Reported - United States (%)
Ancestries Reported - Welsh (%)
Ancestries Reported - West Indian (%)
Ancestries Reported - Other (%)
Geographical mobility - Same house 1 year ago (%)
Geographical mobility - Same house 1 year ago (%) - White
Geographical mobility - Same house 1 year ago (%) - Black or African American
Geographical mobility - Same house 1 year ago (%) - Asian
Geographical mobility - Same house 1 year ago (%) - Hispanic or Latino
Geographical mobility - Same house 1 year ago (%) - American Indian and Alaska Native
Geographical mobility - Same house 1 year ago (%) - Multirace
Geographical mobility - Same house 1 year ago (%) - Other Race
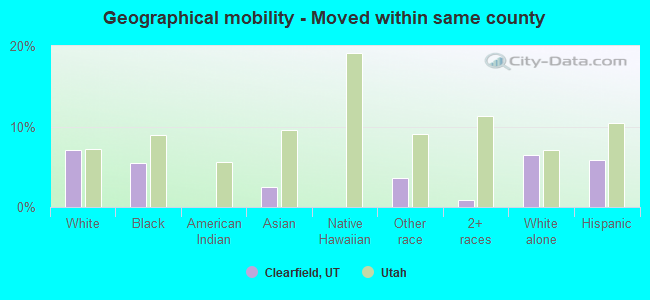
Geographical mobility - Moved within same county (%)
Geographical mobility - Moved within same county (%) - White
Geographical mobility - Moved within same county (%) - Black or African American
Geographical mobility - Moved within same county (%) - Asian
Geographical mobility - Moved within same county (%) - Hispanic or Latino
Geographical mobility - Moved within same county (%) - American Indian and Alaska Native
Geographical mobility - Moved within same county (%) - Multirace
Geographical mobility - Moved within same county (%) - Other Race
Geographical mobility - Moved from different county within same state (%)
Geographical mobility - Moved from different county within same state (%) - White
Geographical mobility - Moved from different county within same state (%) - Black or African American
Geographical mobility - Moved from different county within same state (%) - Asian
Geographical mobility - Moved from different county within same state (%) - Hispanic or Latino
Geographical mobility - Moved from different county within same state (%) - American Indian and Alaska Native
Geographical mobility - Moved from different county within same state (%) - Multirace
Geographical mobility - Moved from different county within same state (%) - Other Race
Geographical mobility - Moved from different state (%)
Geographical mobility - Moved from different state (%) - White
Geographical mobility - Moved from different state (%) - Black or African American
Geographical mobility - Moved from different state (%) - Asian
Geographical mobility - Moved from different state (%) - Hispanic or Latino
Geographical mobility - Moved from different state (%) - American Indian and Alaska Native
Geographical mobility - Moved from different state (%) - Multirace
Geographical mobility - Moved from different state (%) - Other Race
Geographical mobility - Moved from abroad (%)
Geographical mobility - Moved from abroad (%) - White
Geographical mobility - Moved from abroad (%) - Black or African American
Geographical mobility - Moved from abroad (%) - Asian
Geographical mobility - Moved from abroad (%) - Hispanic or Latino
Geographical mobility - Moved from abroad (%) - American Indian and Alaska Native
Geographical mobility - Moved from abroad (%) - Multirace
Geographical mobility - Moved from abroad (%) - Other Race
Place of birth for the foreign-born population - Ireland (%)
Place of birth for the foreign-born population - Denmark (%)
Place of birth for the foreign-born population - Norway (%)
Place of birth for the foreign-born population - Sweden (%)
Place of birth for the foreign-born population - United Kingdom (%)
Place of birth for the foreign-born population - England (%)
Place of birth for the foreign-born population - Scotland (%)
Place of birth for the foreign-born population - Other Northern Europe (%)
Place of birth for the foreign-born population - Austria (%)
Place of birth for the foreign-born population - Belgium (%)
Place of birth for the foreign-born population - France (%)
Place of birth for the foreign-born population - Germany (%)
Place of birth for the foreign-born population - Netherlands (%)
Place of birth for the foreign-born population - Switzerland (%)
Place of birth for the foreign-born population - Other Western Europe (%)
Place of birth for the foreign-born population - Greece (%)
Place of birth for the foreign-born population - Italy (%)
Place of birth for the foreign-born population - Portugal (%)
Place of birth for the foreign-born population - Spain (%)
Place of birth for the foreign-born population - Other Southern Europe (%)
Place of birth for the foreign-born population - Albania (%)
Place of birth for the foreign-born population - Belarus (%)
Place of birth for the foreign-born population - Bosnia and Herzegovina (%)
Place of birth for the foreign-born population - Bulgaria (%)
Place of birth for the foreign-born population - Croatia (%)
Place of birth for the foreign-born population - Czechoslovakia (%)
Place of birth for the foreign-born population - Hungary (%)
Place of birth for the foreign-born population - Latvia (%)
Place of birth for the foreign-born population - Lithuania (%)
Place of birth for the foreign-born population - North Macedonia (Macedonia) (%)
Place of birth for the foreign-born population - Moldova (%)
Place of birth for the foreign-born population - Poland (%)
Place of birth for the foreign-born population - Romania (%)
Place of birth for the foreign-born population - Russia (%)
Place of birth for the foreign-born population - Serbia (%)
Place of birth for the foreign-born population - Ukraine (%)
Place of birth for the foreign-born population - Other Eastern Europe (%)
Place of birth for the foreign-born population - China (%)
Place of birth for the foreign-born population - Hong Kong (%)
Place of birth for the foreign-born population - Taiwan (%)
Place of birth for the foreign-born population - Japan (%)
Place of birth for the foreign-born population - Korea (%)
Place of birth for the foreign-born population - Other Eastern Asia (%)
Place of birth for the foreign-born population - Afghanistan (%)
Place of birth for the foreign-born population - Bangladesh (%)
Place of birth for the foreign-born population - India (%)
Place of birth for the foreign-born population - Iran (%)
Place of birth for the foreign-born population - Kazakhstan (%)
Place of birth for the foreign-born population - Nepal (%)
Place of birth for the foreign-born population - Pakistan (%)
Place of birth for the foreign-born population - Sri Lanka (%)
Place of birth for the foreign-born population - Uzbekistan (%)
Place of birth for the foreign-born population - Other South Central Asia (%)
Place of birth for the foreign-born population - Burma (%)
Place of birth for the foreign-born population - Cambodia (%)
Place of birth for the foreign-born population - Indonesia (%)
Place of birth for the foreign-born population - Laos (%)
Place of birth for the foreign-born population - Malaysia (%)
Place of birth for the foreign-born population - Philippines (%)
Place of birth for the foreign-born population - Singapore (%)
Place of birth for the foreign-born population - Thailand (%)
Place of birth for the foreign-born population - Vietnam (%)
Place of birth for the foreign-born population - Other South Eastern Asia (%)
Place of birth for the foreign-born population - Armenia (%)
Place of birth for the foreign-born population - Iraq (%)
Place of birth for the foreign-born population - Israel (%)
Place of birth for the foreign-born population - Jordan (%)
Place of birth for the foreign-born population - Kuwait (%)
Place of birth for the foreign-born population - Lebanon (%)
Place of birth for the foreign-born population - Saudi Arabia (%)
Place of birth for the foreign-born population - Syria (%)
Place of birth for the foreign-born population - Turkey (%)
Place of birth for the foreign-born population - Yemen (%)
Place of birth for the foreign-born population - Other Western Asia (%)
Place of birth for the foreign-born population - Eritrea (%)
Place of birth for the foreign-born population - Ethiopia (%)
Place of birth for the foreign-born population - Kenya (%)
Place of birth for the foreign-born population - Somalia (%)
Place of birth for the foreign-born population - Uganda (%)
Place of birth for the foreign-born population - Zimbabwe (%)
Place of birth for the foreign-born population - Other Eastern Africa (%)
Place of birth for the foreign-born population - Cameroon (%)
Place of birth for the foreign-born population - Congo (%)
Place of birth for the foreign-born population - Democratic Republic of Congo (Zaire) (%)
Place of birth for the foreign-born population - Other Middle Africa (%)
Place of birth for the foreign-born population - Egypt (%)
Place of birth for the foreign-born population - Morocco (%)
Place of birth for the foreign-born population - Sudan (%)
Place of birth for the foreign-born population - Other Northern Africa (%)
Place of birth for the foreign-born population - South Africa (%)
Place of birth for the foreign-born population - Other Southern Africa (%)
Place of birth for the foreign-born population - Cabo Verde (%)
Place of birth for the foreign-born population - Ghana (%)
Place of birth for the foreign-born population - Liberia (%)
Place of birth for the foreign-born population - Nigeria (%)
Place of birth for the foreign-born population - Senegal (%)
Place of birth for the foreign-born population - Sierra Leone (%)
Place of birth for the foreign-born population - Other Western Africa (%)
Place of birth for the foreign-born population - Australia (%)
Place of birth for the foreign-born population - New Zealand (%)
Place of birth for the foreign-born population - Fiji (%)
Place of birth for the foreign-born population - Micronesia (%)
Place of birth for the foreign-born population - Bahamas (%)
Place of birth for the foreign-born population - Barbados (%)
Place of birth for the foreign-born population - Cuba (%)
Place of birth for the foreign-born population - Dominica (%)
Place of birth for the foreign-born population - Dominican Republic (%)
Place of birth for the foreign-born population - Grenada (%)
Place of birth for the foreign-born population - Haiti (%)
Place of birth for the foreign-born population - Jamaica (%)
Place of birth for the foreign-born population - St. Vincent and the Grenadines (%)
Place of birth for the foreign-born population - Trinidad and Tobago (%)
Place of birth for the foreign-born population - West Indies (%)
Place of birth for the foreign-born population - Other Caribbean (%)
Place of birth for the foreign-born population - Belize (%)
Place of birth for the foreign-born population - Costa Rica (%)
Place of birth for the foreign-born population - El Salvador (%)
Place of birth for the foreign-born population - Guatemala (%)
Place of birth for the foreign-born population - Honduras (%)
Place of birth for the foreign-born population - Mexico (%)
Place of birth for the foreign-born population - Nicaragua (%)
Place of birth for the foreign-born population - Panama (%)
Place of birth for the foreign-born population - Other Central America (%)
Place of birth for the foreign-born population - Argentina (%)
Place of birth for the foreign-born population - Bolivia (%)
Place of birth for the foreign-born population - Brazil (%)
Place of birth for the foreign-born population - Chile (%)
Place of birth for the foreign-born population - Colombia (%)
Place of birth for the foreign-born population - Ecuador (%)
Place of birth for the foreign-born population - Guyana (%)
Place of birth for the foreign-born population - Peru (%)
Place of birth for the foreign-born population - Uruguay (%)
Place of birth for the foreign-born population - Venezuela (%)
Place of birth for the foreign-born population - Other South America (%)
Place of birth for the foreign-born population - Canada (%)
Place of birth for the foreign-born population - Other Northern America (%)
Place of birth for the foreign-born population - Other (%)
Latest news about races in Clearfield, UT collected exclusively by city-data.com from local newspapers, TV, and radio stations
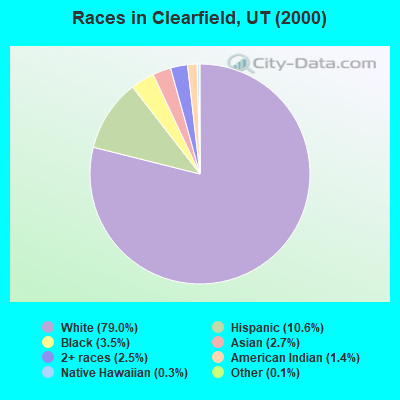
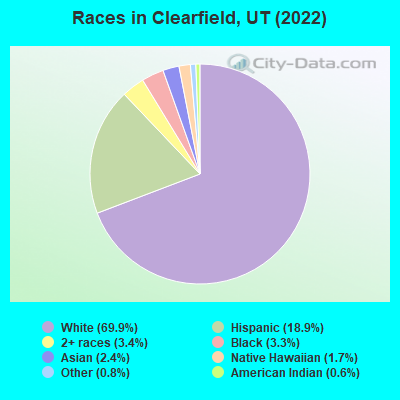
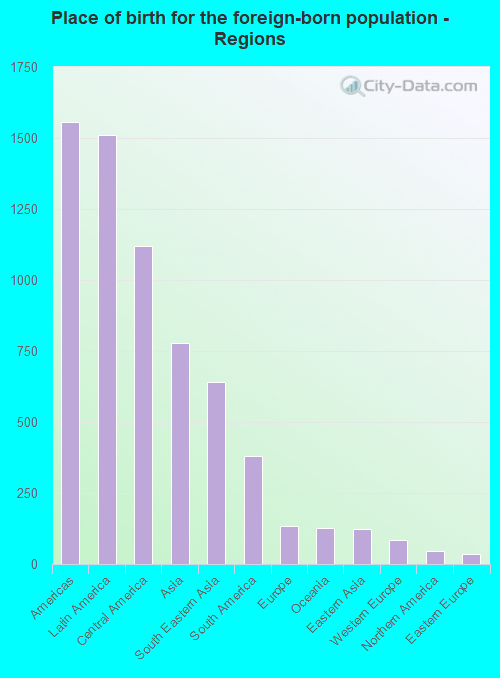
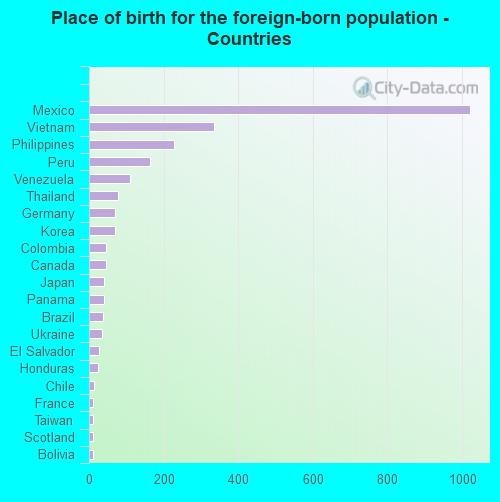
According to 2022 data, the most numerous races in Clearfield, UT are White alone (23,041 residents), Hispanic (6,237 residents), and Two or more races (1,115 residents). 84.7% of Clearfield residents speak English at home. 7.9% of Clearfield, UT residents are foreign-born (4.4% born in Latin America, 2.3% born in Asia), which is about the same as the foreign-born rate of 8.0% across the entire state of Utah.
Race distribution in Clearfield
2000 2022
1,904,265 85.3% White alone 201,559 9.0% Hispanic 36,483 1.6% Asian alone 31,308 1.4% Two or more races 26,663 1.2% American Indian alone 14,806 0.7% Native Hawaiian and Other 16,137 0.7% Black alone 1,948 0.09% Other race alone
2,557,466 75.6% White alone 512,086 15.1% Hispanic 119,308 3.5% Two or more races 82,388 2.4% Asian alone 36,978 1.1% Native Hawaiian and Other 34,873 1.0% Black alone 22,803 0.7% American Indian alone 14,898 0.4% Other race alone
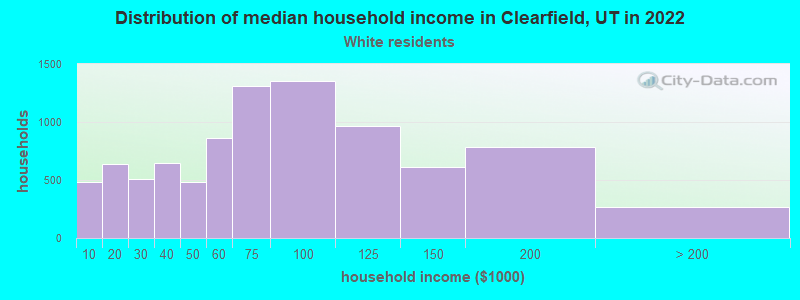
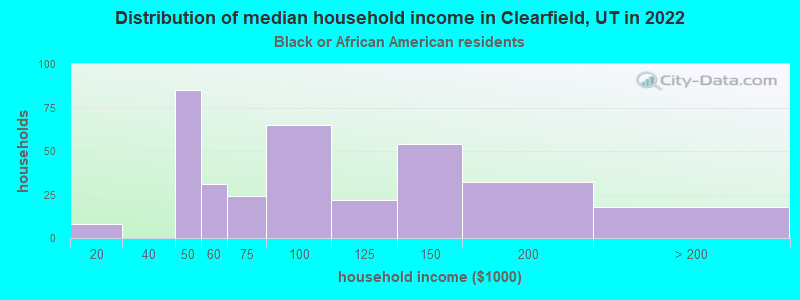
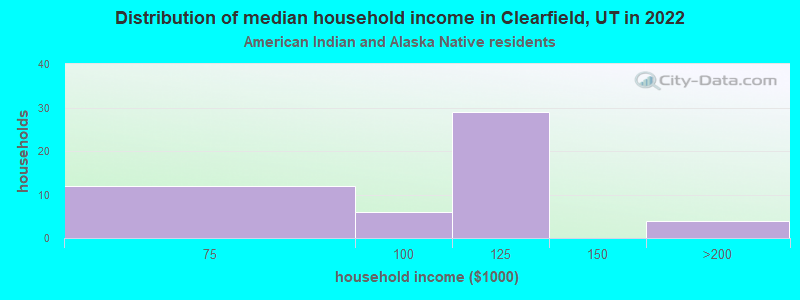
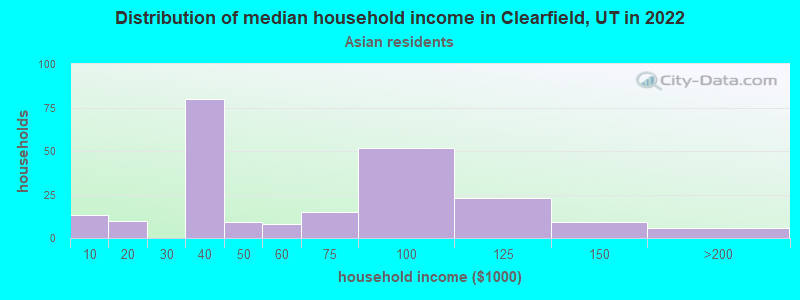
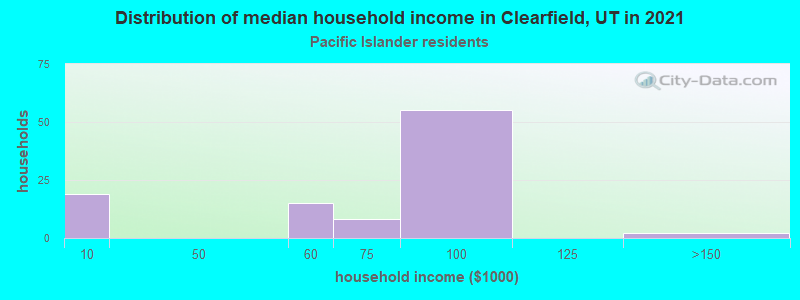
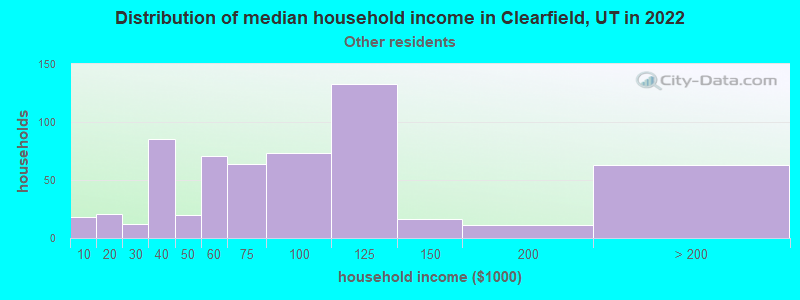
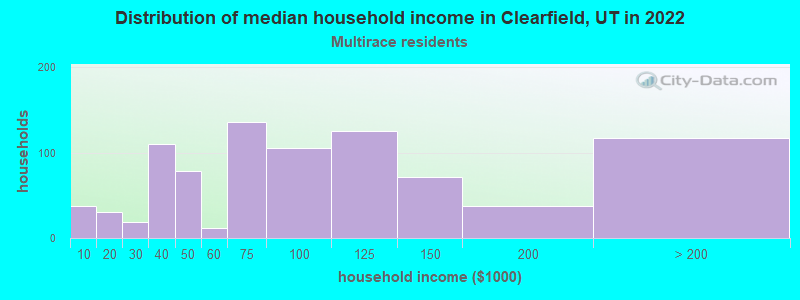
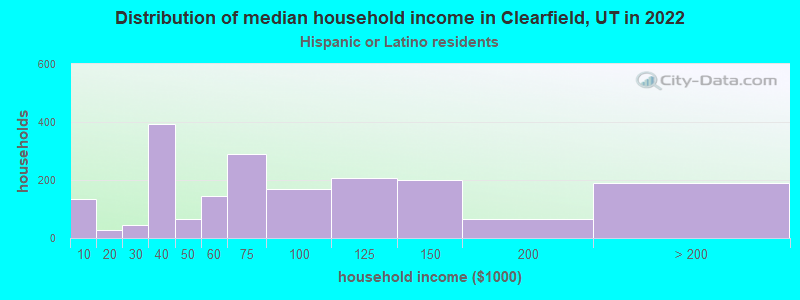
Income and house value in Clearfield Median household income in 2022 $70,893 White non-Hispanic householders$75,740 Black householders$128,225 American Indian and Alaska Native householders$104,927 Native Hawaiian and other Pacific Islander householders$74,258 Some other race householders$92,220 Two or more races householders$69,422 Hispanic or Latino race householdersMedian 2022 house value $391,060 White Non-Hispanic householders$471,462 Black or African American householders$438,275 American Indian or Alaska Native householders $362,663 Asian householders$384,902 Native Hawaiian and other Pacific Islander householders$340,082 Some other race householders$419,799 Two or more races householders$382,507 Hispanic or Latino householders
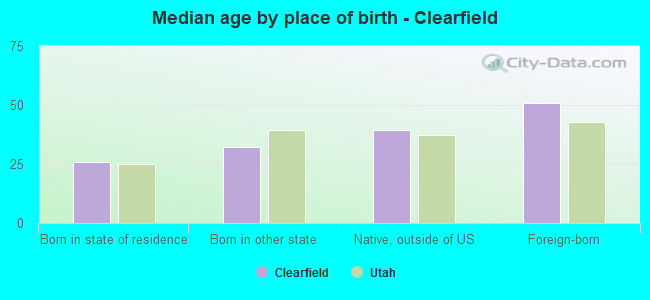
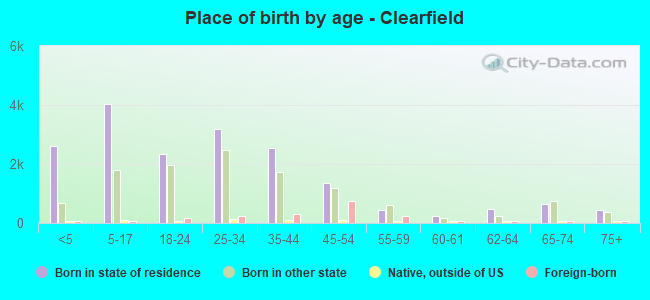
Median age by race in Clearfield
31.0 Median age for White residents31.6 30.8 25.6 Median age for Black or African American residents30.0 27.2 30.6 Median age for American Indian / Alaska Native residents37.7 17.9 49.1 Median age for Asian residents42.1 48.8 20.3 Median age for Native Hawaiian / Pacific Islander residents21.5 15.5 30.5 Median age for Other race residents32.5 22.1 20.6 Median age for Two or more races residents27.2 16.5 31.5 Median age for White alone residents31.9 31.2 27.5 Median age for Hispanic or Latino residents30.2 25.3
Owner/renter occupied households by race in Clearfield
House owners and renters - White residents 5,345 59.3% Owner occupied3,676 40.7% Renter occupiedHouse owners and renters - Black or African American residents 128 32.3% Owner occupied268 67.7% Renter occupiedHouse owners and renters - American Indian / Alaska Native residents 74 100.0% Renter occupiedHouse owners and renters - Asian residents 134 56.9% Owner occupied101 43.1% Renter occupiedHouse owners and renters - Native Hawaiian / Pacific Islander residents 96 64.1% Owner occupied54 35.9% Renter occupiedHouse owners and renters - Other race residents 422 62.8% Owner occupied250 37.2% Renter occupiedHouse owners and renters - Two or more races residents 430 56.2% Owner occupied335 43.8% Renter occupiedHouse owners and renters - White alone residents 5,090 61.8% Owner occupied3,150 38.2% Renter occupiedHouse owners and renters - Hispanic or Latino residents 829 45.0% Owner occupied1,011 55.0% Renter occupied
Language usage in Clearfield
English speakers - Total 84.7% of residents of Clearfield speak English at home.
11.4% of residents speak Spanish at home 2,669 78.8% Speak English very well720 21.2% Speak English less than very well3.6% of residents speak other language at home 786 73.5% Speak English very well284 26.5% Speak English less than very well
English speakers - Born in the United States 85.8% of residents of Clearfield speak English at home.
12.2% of residents speak Spanish at home 1,270 91.7% Speak English very well115 8.3% Speak English less than very well2.4% of residents speak other language at home 238 86.5% Speak English very well37 13.5% Speak English less than very well
English speakers - Native, born elsewhere 75.7% of residents of Clearfield speak English at home.
14.5% of residents speak Spanish at home 57 76.0% Speak English very well18 24.0% Speak English less than very well3.5% of residents speak other language at home 18 100.0% Speak English very well
English speakers - Foreign-born 13.7% of residents of Clearfield speak English at home.
55.5% of residents speak Spanish at home 639 57.3% Speak English very well476 42.7% Speak English less than very well30.0% of residents speak other language at home 386 63.9% Speak English very well218 36.1% Speak English less than very well
White (Caucasian) - Speak only English Native:
94.4% (21,010)Foreign-born:
13.3% (52)
White (Caucasian) - Speak another language Native:
5.7% (1,264)Foreign-born:
93.3% (362)
Black or African American - Speak only English Native:
83.7% (746)Foreign-born:
86.7% (38)
Black or African American - Speak another language Native:
13.4% (120)Foreign-born:
23.1% (10)
American Indian / Alaska Native - Speak only English Native:
73.3% (128)Foreign-born:
100.0% (47)
Asian - Speak only English Native:
68.2% (129)Foreign-born:
16.1% (99)
Asian - Speak another language Native:
27.7% (53)Foreign-born:
73.8% (455)
Native Hawaiian / Pacific Islander - Speak another language Native:
26.3% (109)Foreign-born:
100.0% (137)
Other race - Speak only English Native:
56.1% (990)Foreign-born:
3.8% (26)
Other race - Speak another language Native:
43.5% (767)Foreign-born:
88.9% (607)
Two or more races - Speak only English Native:
74.9% (1,713)Foreign-born:
14.6% (42)
Two or more races - Speak another language Native:
25.5% (582)Foreign-born:
84.5% (243)
White alone - Speak only English Native:
97.2% (20,002)Foreign-born:
48.2% (61)
White alone - Speak another language Native:
2.6% (531)Foreign-born:
52.0% (66)
Hispanic or Latino - Speak only English Native:
58.8% (2,638)Foreign-born:
1.5% (18)
Hispanic or Latino - Speak another language Native:
40.8% (1,830)Foreign-born:
100.0% (1,167)
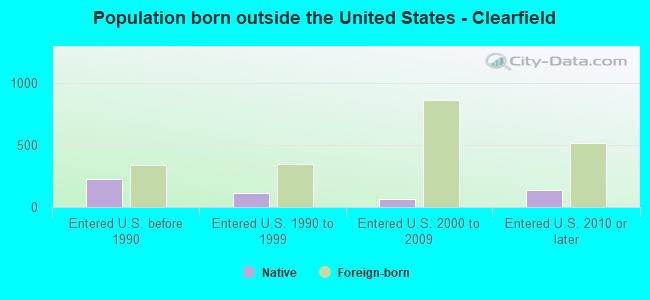
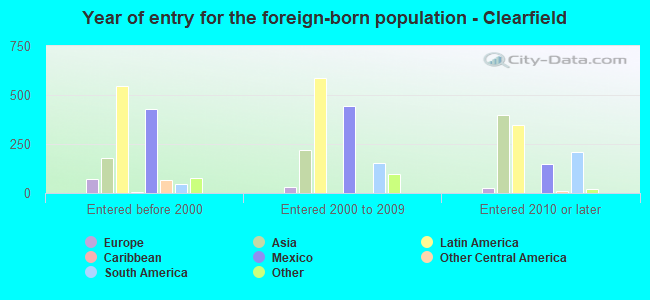
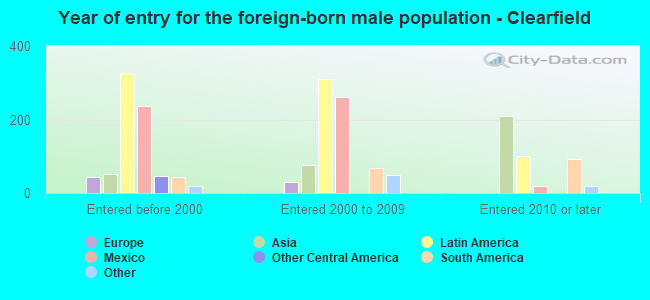
Foreign-born residents in Clearfield 2,596 residents are foreign born (4.4% Latin America , 2.3% Asia ).
Marital status for residents in Clearfield Marital status - White (Caucasian) population 15 years and over
Males 29.4% Never married54.3% Now married1.6% Separated1.8% Widowed12.9% DivorcedFemales 26.2% Never married51.9% Now married2.2% Separated4.5% Widowed15.2% DivorcedWomen who gave birth in the past 12 months Now married:
83.3% (632)Unmarried:
16.7% (127)
Women who did not give birth in the past 12 months Now married:
51.2% (3,152)Unmarried:
48.8% (3,004)
Marital status - Black or African American population 15 years and over
Males 56.6% Never married32.2% Now married2.8% Separated1.5% Widowed6.9% DivorcedFemales 55.1% Never married34.4% Now married0.0% Separated0.0% Widowed10.5% DivorcedWomen who did not give birth in the past 12 months Now married:
24.2% (53)Unmarried:
75.8% (166)
Marital status - American Indian / Alaska Native population 15 years and over
Males 42.9% Never married57.1% Now married0.0% Separated0.0% Widowed0.0% DivorcedFemales 0.0% Never married95.1% Now married0.0% Separated0.0% Widowed4.9% DivorcedWomen who did not give birth in the past 12 months Now married:
93.3% (105)Unmarried:
6.7% (8)
Marital status - Asian population 15 years and over
Males 41.8% Never married45.8% Now married0.0% Separated0.0% Widowed12.4% DivorcedFemales 20.8% Never married47.9% Now married0.0% Separated3.9% Widowed27.4% DivorcedWomen who gave birth in the past 12 months Now married:
100.0% (27)Unmarried:
0.0% (0)
Women who did not give birth in the past 12 months Now married:
52.3% (152)Unmarried:
47.7% (139)
Marital status - Native Hawaiian / Pacific Islander population 15 years and over
Males 67.5% Never married24.1% Now married0.0% Separated0.0% Widowed8.4% DivorcedFemales 36.7% Never married63.3% Now married0.0% Separated0.0% Widowed0.0% DivorcedWomen who did not give birth in the past 12 months Now married:
57.1% (84)Unmarried:
42.9% (63)
Marital status - Other race population 15 years and over
Males 33.3% Never married51.0% Now married4.2% Separated0.6% Widowed10.9% DivorcedFemales 48.3% Never married38.2% Now married0.0% Separated0.0% Widowed13.5% DivorcedWomen who gave birth in the past 12 months Now married:
0.0% (0)Unmarried:
100.0% (12)
Women who did not give birth in the past 12 months Now married:
33.4% (181)Unmarried:
66.6% (361)
Marital status - Two or more races population 15 years and over
Males 35.1% Never married52.5% Now married1.3% Separated0.0% Widowed11.2% DivorcedFemales 40.8% Never married42.2% Now married5.4% Separated0.0% Widowed11.6% DivorcedWomen who did not give birth in the past 12 months Now married:
38.6% (255)Unmarried:
61.4% (407)
Marital status - White alone, not Hispanic / Latino population 15 years and over
Males 28.5% Never married54.8% Now married1.7% Separated2.0% Widowed13.0% DivorcedFemales 25.8% Never married52.7% Now married1.9% Separated4.9% Widowed14.7% DivorcedWomen who gave birth in the past 12 months Now married:
82.6% (605)Unmarried:
17.4% (127)
Women who did not give birth in the past 12 months Now married:
51.4% (2,808)Unmarried:
48.6% (2,650)
Marital status - Hispanic or Latino population 15 years and over
Males 38.5% Never married51.5% Now married1.9% Separated0.2% Widowed7.9% DivorcedFemales 39.5% Never married44.7% Now married2.5% Separated0.4% Widowed12.9% DivorcedWomen who gave birth in the past 12 months Now married:
72.5% (30)Unmarried:
27.5% (11)
Women who did not give birth in the past 12 months Now married:
42.6% (689)Unmarried:
57.4% (929)
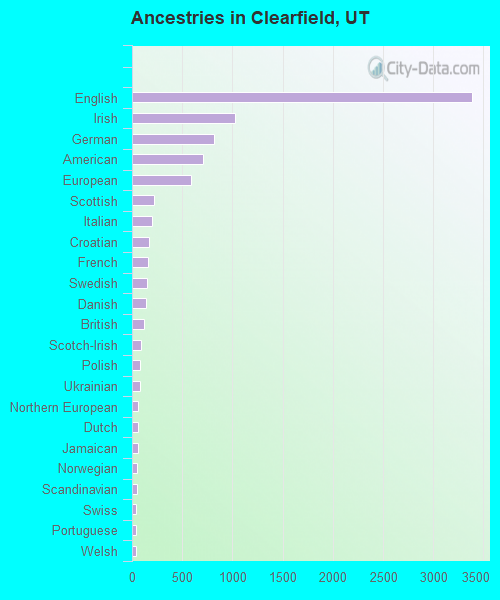
Ancestries in Clearfield
3,386 23.2% English1,028 7.0% Irish813 5.6% German705 4.8% American583 4.0% European224 1.5% Scottish199 1.4% Italian171 1.2% Croatian160 1.1% French154 1.1% Swedish140 1.0% Danish122 0.8% British86 0.6% Scotch-Irish82 0.6% Polish76 0.5% Ukrainian64 0.4% Northern European63 0.4% Dutch60 0.4% Jamaican47 0.3% Norwegian45 0.3% Scandinavian38 0.3% Swiss36 0.2% Portuguese35 0.2% Welsh14 0.10% African9 0.06% Brazilian8 0.05% Greek8 0.05% Russian4 0.03% Czech3 0.02% Lithuanian1 0.01% Hungarian
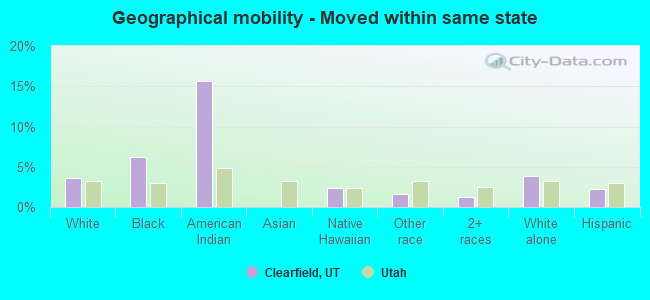
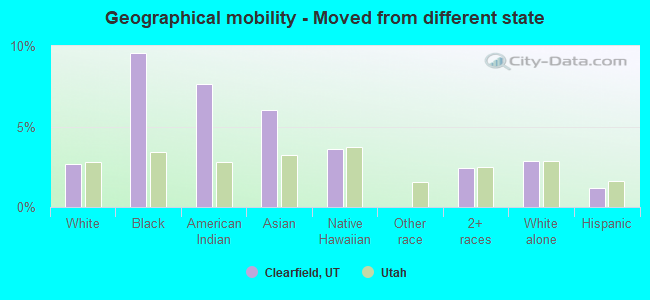
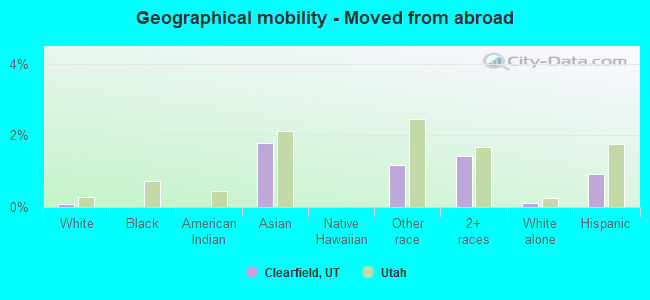
Geographical mobility in Clearfield Same house 1 year ago 21,389 86.1% White (Caucasian)819 78.8% Black or African American177 82.2% American Indian / Alaska Native764 89.8% Asian473 87.1% Native Hawaiian / Pacific Islander2,371 91.6% Other race2,678 93.7% Two or more races19,459 86.4% White alone, not Hispanic / Latino5,505 90.0% Hispanic or LatinoMoved within same county 1,768 7.1% White / Caucasian56 5.4% Black or African American22 2.5% Asian94 3.6% Other race26 0.9% Two or more races1,459 6.5% White alone, not Hispanic / Latino359 5.9% Hispanic or LatinoMoved within same state 902 3.6% White / Caucasian64 6.2% Black or African American34 15.6% American Indian / Alaska Native13 2.4% Native Hawaiian / Pacific Islander40 1.6% Other race34 1.2% Two or more races875 3.9% White alone, not Hispanic / Latino135 2.2% Hispanic or LatinoMoved from different state 670 2.7% White / Caucasian99 9.6% Black or African American16 7.7% American Indian / Alaska Native52 6.0% Asian19 3.6% Native Hawaiian / Pacific Islander70 2.4% Two or more races637 2.8% White alone, not Hispanic / Latino72 1.2% Hispanic or LatinoMoved from abroad 24 0.1% White15 1.8% Asian30 1.2% Other race41 1.4% Two or more races25 0.1% White alone, not Hispanic / Latino57 0.9% Hispanic or Latino
Children Nativity (place of birth) in Clearfield
Children under 6 years - Living with two parents Both parents native 2,469 100.0% NativeBoth parents foreign-born 69 100.0% NativeOne native, one foreign-born parent 100 100.0% NativeChildren under 6 years - Living with one parent Native parent 961 100.0% NativeForeign-born parent 37 100.0% NativeChildren 6 to 17 years - Living with two parents Both parents native 2,909 100.0% NativeBoth parents foreign-born 164 80.5% Native40 19.5% Foreign-bornOne native, one foreign-born parent 242 100.0% NativeChildren 6 to 17 years - Living with one parent Native parent 1,641 100.0% NativeForeign-born parent 93 50.2% Native92 49.8% Foreign-born
Grandparents responsible for own grandchildren in Clearfield
Grandparents (30 to 59 years) White / Caucasian 70 27.4% Responsible for grandchildren186 72.6% Not responsible for grandchildrenOther race 17 100.0% Not responsible for grandchildrenWhite alone, not Hispanic / Latino 18 9.4% Responsible for grandchildren173 90.6% Not responsible for grandchildrenHispanic or Latino 45 70.6% Responsible for grandchildren19 29.4% Not responsible for grandchildrenGrandparents (60 years and over) White / Caucasian 51 8.0% Responsible for grandchildren586 92.0% Not responsible for grandchildrenOther race 11 100.0% Not responsible for grandchildrenWhite alone, not Hispanic / Latino 51 8.4% Responsible for grandchildren557 91.6% Not responsible for grandchildrenHispanic or Latino 50 100.0% Not responsible for grandchildren