Races in Clayton, North Carolina (NC) Detailed Stats
Data:
Races - White alone (%)
Races - White alone (% change since 2000)
Races - Black alone (%)
Races - Black alone (% change since 2000)
Races - American Indian alone (%)
Races - American Indian alone (% change since 2000)
Races - Asian alone (%)
Races - Asian alone (% change since 2000)
Races - Hispanic (%)
Races - Hispanic (% change since 2000)
Races - Native Hawaiian and Other Pacific Islander alone (%)
Races - Native Hawaiian and Other Pacific Islander alone (% change since 2000)
Races - Two or more races(%)
Races - Two or more races(% change since 2000)
Races - Other race alone (%)
Races - Other race alone (% change since 2000)
Racial diversity
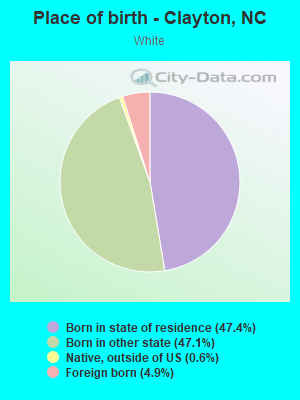
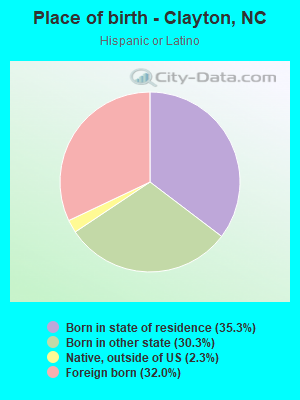
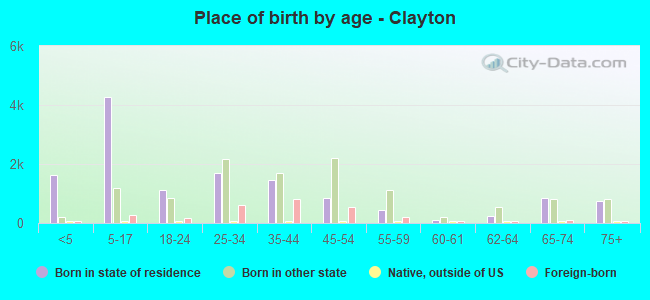
Place of birth - Born in state of residence (%)
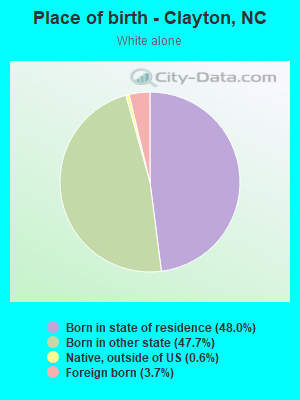
Place of birth - Born in state of residence (%) - White
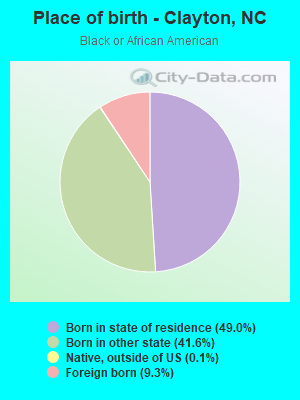
Place of birth - Born in state of residence (%) - Black or African American
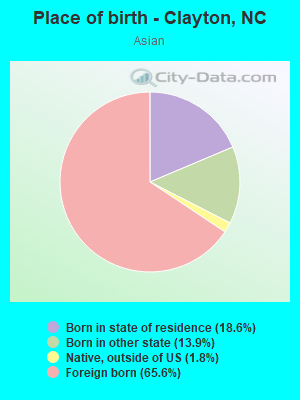
Place of birth - Born in state of residence (%) - Asian
Place of birth - Born in state of residence (%) - Hispanic or Latino
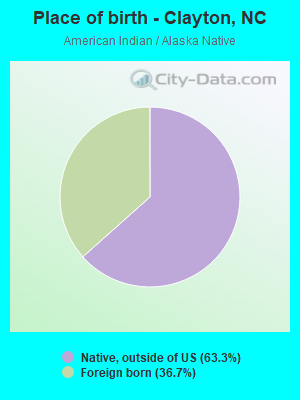
Place of birth - Born in state of residence (%) - American Indian and Alaska Native
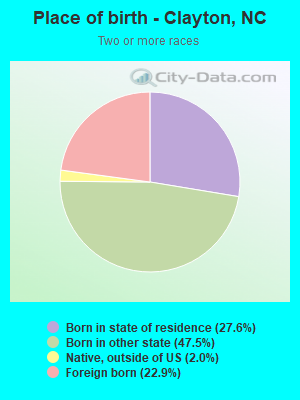
Place of birth - Born in state of residence (%) - Multirace
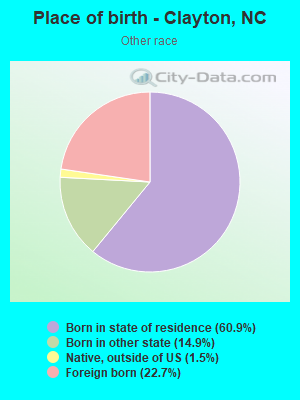
Place of birth - Born in state of residence (%) - Other Race
Place of birth - Born in other state (%)
Place of birth - Born in other state (%) - White
Place of birth - Born in other state (%) - Black or African American
Place of birth - Born in other state (%) - Asian
Place of birth - Born in other state (%) - Hispanic or Latino
Place of birth - Born in other state (%) - American Indian and Alaska Native
Place of birth - Born in other state (%) - Multirace
Place of birth - Born in other state (%) - Other Race
Place of birth - Native, outside of US (%)
Place of birth - Native, outside of US (%) - White
Place of birth - Native, outside of US (%) - Black or African American
Place of birth - Native, outside of US (%) - Asian
Place of birth - Native, outside of US (%) - Hispanic or Latino
Place of birth - Native, outside of US (%) - American Indian and Alaska Native
Place of birth - Native, outside of US (%) - Multirace
Place of birth - Native, outside of US (%) - Other Race
Place of birth - Foreign born (%)
Place of birth - Foreign born (%) - White
Place of birth - Foreign born (%) - Black or African American
Place of birth - Foreign born (%) - Asian
Place of birth - Foreign born (%) - Hispanic or Latino
Place of birth - Foreign born (%) - American Indian and Alaska Native
Place of birth - Foreign born (%) - Multirace
Place of birth - Foreign born (%) - Other Race
Residents speaking English at home (%)
Residents speaking English at home - Born in the United States (%)
Residents speaking English at home - Native, born elsewhere (%)
Residents speaking English at home - Foreign born (%)
Residents speaking Spanish at home (%)
Residents speaking Spanish at home - Born in the United States (%)
Residents speaking Spanish at home - Native, born elsewhere (%)
Residents speaking Spanish at home - Foreign born (%)
Residents speaking other language at home (%)
Residents speaking other language at home - Born in the United States (%)
Residents speaking other language at home - Native, born elsewhere (%)
Residents speaking other language at home - Foreign born (%)
Marital status - Never married (%)
Marital status - Now married (%)
Marital status - Separated (%)
Marital status - Widowed (%)
Marital status - Divorced (%)
Ancestries Reported - Arab (%)
Ancestries Reported - Czech (%)
Ancestries Reported - Danish (%)
Ancestries Reported - Dutch (%)
Ancestries Reported - English (%)
Ancestries Reported - French (%)
Ancestries Reported - French Canadian (%)
Ancestries Reported - German (%)
Ancestries Reported - Greek (%)
Ancestries Reported - Hungarian (%)
Ancestries Reported - Irish (%)
Ancestries Reported - Italian (%)
Ancestries Reported - Lithuanian (%)
Ancestries Reported - Norwegian (%)
Ancestries Reported - Polish (%)
Ancestries Reported - Portuguese (%)
Ancestries Reported - Russian (%)
Ancestries Reported - Scotch-Irish (%)
Ancestries Reported - Scottish (%)
Ancestries Reported - Slovak (%)
Ancestries Reported - Subsaharan African (%)
Ancestries Reported - Swedish (%)
Ancestries Reported - Swiss (%)
Ancestries Reported - Ukrainian (%)
Ancestries Reported - United States (%)
Ancestries Reported - Welsh (%)
Ancestries Reported - West Indian (%)
Ancestries Reported - Other (%)
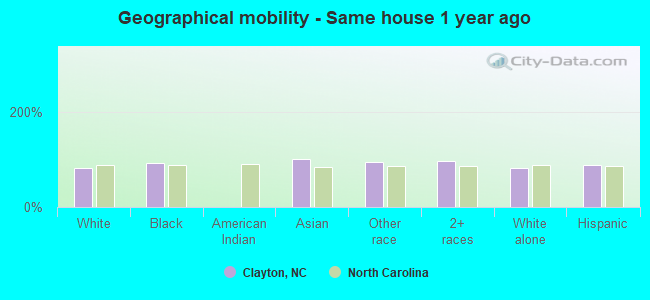
Geographical mobility - Same house 1 year ago (%)
Geographical mobility - Same house 1 year ago (%) - White
Geographical mobility - Same house 1 year ago (%) - Black or African American
Geographical mobility - Same house 1 year ago (%) - Asian
Geographical mobility - Same house 1 year ago (%) - Hispanic or Latino
Geographical mobility - Same house 1 year ago (%) - American Indian and Alaska Native
Geographical mobility - Same house 1 year ago (%) - Multirace
Geographical mobility - Same house 1 year ago (%) - Other Race
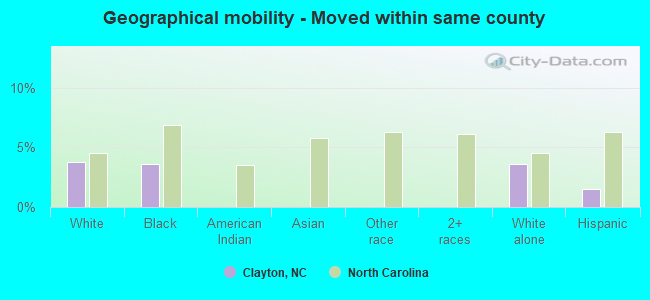
Geographical mobility - Moved within same county (%)
Geographical mobility - Moved within same county (%) - White
Geographical mobility - Moved within same county (%) - Black or African American
Geographical mobility - Moved within same county (%) - Asian
Geographical mobility - Moved within same county (%) - Hispanic or Latino
Geographical mobility - Moved within same county (%) - American Indian and Alaska Native
Geographical mobility - Moved within same county (%) - Multirace
Geographical mobility - Moved within same county (%) - Other Race
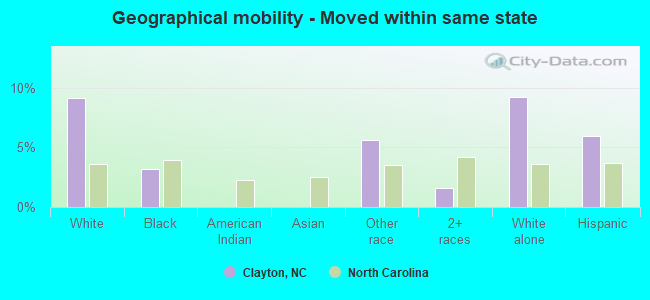
Geographical mobility - Moved from different county within same state (%)
Geographical mobility - Moved from different county within same state (%) - White
Geographical mobility - Moved from different county within same state (%) - Black or African American
Geographical mobility - Moved from different county within same state (%) - Asian
Geographical mobility - Moved from different county within same state (%) - Hispanic or Latino
Geographical mobility - Moved from different county within same state (%) - American Indian and Alaska Native
Geographical mobility - Moved from different county within same state (%) - Multirace
Geographical mobility - Moved from different county within same state (%) - Other Race
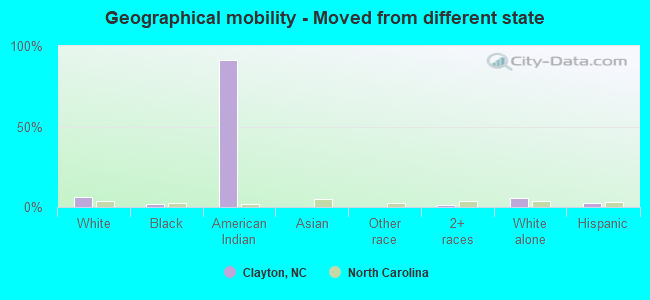
Geographical mobility - Moved from different state (%)
Geographical mobility - Moved from different state (%) - White
Geographical mobility - Moved from different state (%) - Black or African American
Geographical mobility - Moved from different state (%) - Asian
Geographical mobility - Moved from different state (%) - Hispanic or Latino
Geographical mobility - Moved from different state (%) - American Indian and Alaska Native
Geographical mobility - Moved from different state (%) - Multirace
Geographical mobility - Moved from different state (%) - Other Race
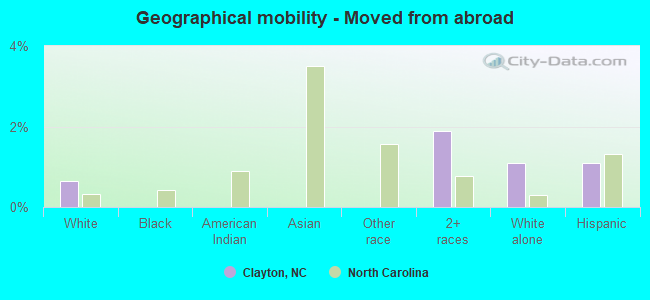
Geographical mobility - Moved from abroad (%)
Geographical mobility - Moved from abroad (%) - White
Geographical mobility - Moved from abroad (%) - Black or African American
Geographical mobility - Moved from abroad (%) - Asian
Geographical mobility - Moved from abroad (%) - Hispanic or Latino
Geographical mobility - Moved from abroad (%) - American Indian and Alaska Native
Geographical mobility - Moved from abroad (%) - Multirace
Geographical mobility - Moved from abroad (%) - Other Race
Place of birth for the foreign-born population - Ireland (%)
Place of birth for the foreign-born population - Denmark (%)
Place of birth for the foreign-born population - Norway (%)
Place of birth for the foreign-born population - Sweden (%)
Place of birth for the foreign-born population - United Kingdom (%)
Place of birth for the foreign-born population - England (%)
Place of birth for the foreign-born population - Scotland (%)
Place of birth for the foreign-born population - Other Northern Europe (%)
Place of birth for the foreign-born population - Austria (%)
Place of birth for the foreign-born population - Belgium (%)
Place of birth for the foreign-born population - France (%)
Place of birth for the foreign-born population - Germany (%)
Place of birth for the foreign-born population - Netherlands (%)
Place of birth for the foreign-born population - Switzerland (%)
Place of birth for the foreign-born population - Other Western Europe (%)
Place of birth for the foreign-born population - Greece (%)
Place of birth for the foreign-born population - Italy (%)
Place of birth for the foreign-born population - Portugal (%)
Place of birth for the foreign-born population - Spain (%)
Place of birth for the foreign-born population - Other Southern Europe (%)
Place of birth for the foreign-born population - Albania (%)
Place of birth for the foreign-born population - Belarus (%)
Place of birth for the foreign-born population - Bosnia and Herzegovina (%)
Place of birth for the foreign-born population - Bulgaria (%)
Place of birth for the foreign-born population - Croatia (%)
Place of birth for the foreign-born population - Czechoslovakia (%)
Place of birth for the foreign-born population - Hungary (%)
Place of birth for the foreign-born population - Latvia (%)
Place of birth for the foreign-born population - Lithuania (%)
Place of birth for the foreign-born population - North Macedonia (Macedonia) (%)
Place of birth for the foreign-born population - Moldova (%)
Place of birth for the foreign-born population - Poland (%)
Place of birth for the foreign-born population - Romania (%)
Place of birth for the foreign-born population - Russia (%)
Place of birth for the foreign-born population - Serbia (%)
Place of birth for the foreign-born population - Ukraine (%)
Place of birth for the foreign-born population - Other Eastern Europe (%)
Place of birth for the foreign-born population - China (%)
Place of birth for the foreign-born population - Hong Kong (%)
Place of birth for the foreign-born population - Taiwan (%)
Place of birth for the foreign-born population - Japan (%)
Place of birth for the foreign-born population - Korea (%)
Place of birth for the foreign-born population - Other Eastern Asia (%)
Place of birth for the foreign-born population - Afghanistan (%)
Place of birth for the foreign-born population - Bangladesh (%)
Place of birth for the foreign-born population - India (%)
Place of birth for the foreign-born population - Iran (%)
Place of birth for the foreign-born population - Kazakhstan (%)
Place of birth for the foreign-born population - Nepal (%)
Place of birth for the foreign-born population - Pakistan (%)
Place of birth for the foreign-born population - Sri Lanka (%)
Place of birth for the foreign-born population - Uzbekistan (%)
Place of birth for the foreign-born population - Other South Central Asia (%)
Place of birth for the foreign-born population - Burma (%)
Place of birth for the foreign-born population - Cambodia (%)
Place of birth for the foreign-born population - Indonesia (%)
Place of birth for the foreign-born population - Laos (%)
Place of birth for the foreign-born population - Malaysia (%)
Place of birth for the foreign-born population - Philippines (%)
Place of birth for the foreign-born population - Singapore (%)
Place of birth for the foreign-born population - Thailand (%)
Place of birth for the foreign-born population - Vietnam (%)
Place of birth for the foreign-born population - Other South Eastern Asia (%)
Place of birth for the foreign-born population - Armenia (%)
Place of birth for the foreign-born population - Iraq (%)
Place of birth for the foreign-born population - Israel (%)
Place of birth for the foreign-born population - Jordan (%)
Place of birth for the foreign-born population - Kuwait (%)
Place of birth for the foreign-born population - Lebanon (%)
Place of birth for the foreign-born population - Saudi Arabia (%)
Place of birth for the foreign-born population - Syria (%)
Place of birth for the foreign-born population - Turkey (%)
Place of birth for the foreign-born population - Yemen (%)
Place of birth for the foreign-born population - Other Western Asia (%)
Place of birth for the foreign-born population - Eritrea (%)
Place of birth for the foreign-born population - Ethiopia (%)
Place of birth for the foreign-born population - Kenya (%)
Place of birth for the foreign-born population - Somalia (%)
Place of birth for the foreign-born population - Uganda (%)
Place of birth for the foreign-born population - Zimbabwe (%)
Place of birth for the foreign-born population - Other Eastern Africa (%)
Place of birth for the foreign-born population - Cameroon (%)
Place of birth for the foreign-born population - Congo (%)
Place of birth for the foreign-born population - Democratic Republic of Congo (Zaire) (%)
Place of birth for the foreign-born population - Other Middle Africa (%)
Place of birth for the foreign-born population - Egypt (%)
Place of birth for the foreign-born population - Morocco (%)
Place of birth for the foreign-born population - Sudan (%)
Place of birth for the foreign-born population - Other Northern Africa (%)
Place of birth for the foreign-born population - South Africa (%)
Place of birth for the foreign-born population - Other Southern Africa (%)
Place of birth for the foreign-born population - Cabo Verde (%)
Place of birth for the foreign-born population - Ghana (%)
Place of birth for the foreign-born population - Liberia (%)
Place of birth for the foreign-born population - Nigeria (%)
Place of birth for the foreign-born population - Senegal (%)
Place of birth for the foreign-born population - Sierra Leone (%)
Place of birth for the foreign-born population - Other Western Africa (%)
Place of birth for the foreign-born population - Australia (%)
Place of birth for the foreign-born population - New Zealand (%)
Place of birth for the foreign-born population - Fiji (%)
Place of birth for the foreign-born population - Micronesia (%)
Place of birth for the foreign-born population - Bahamas (%)
Place of birth for the foreign-born population - Barbados (%)
Place of birth for the foreign-born population - Cuba (%)
Place of birth for the foreign-born population - Dominica (%)
Place of birth for the foreign-born population - Dominican Republic (%)
Place of birth for the foreign-born population - Grenada (%)
Place of birth for the foreign-born population - Haiti (%)
Place of birth for the foreign-born population - Jamaica (%)
Place of birth for the foreign-born population - St. Vincent and the Grenadines (%)
Place of birth for the foreign-born population - Trinidad and Tobago (%)
Place of birth for the foreign-born population - West Indies (%)
Place of birth for the foreign-born population - Other Caribbean (%)
Place of birth for the foreign-born population - Belize (%)
Place of birth for the foreign-born population - Costa Rica (%)
Place of birth for the foreign-born population - El Salvador (%)
Place of birth for the foreign-born population - Guatemala (%)
Place of birth for the foreign-born population - Honduras (%)
Place of birth for the foreign-born population - Mexico (%)
Place of birth for the foreign-born population - Nicaragua (%)
Place of birth for the foreign-born population - Panama (%)
Place of birth for the foreign-born population - Other Central America (%)
Place of birth for the foreign-born population - Argentina (%)
Place of birth for the foreign-born population - Bolivia (%)
Place of birth for the foreign-born population - Brazil (%)
Place of birth for the foreign-born population - Chile (%)
Place of birth for the foreign-born population - Colombia (%)
Place of birth for the foreign-born population - Ecuador (%)
Place of birth for the foreign-born population - Guyana (%)
Place of birth for the foreign-born population - Peru (%)
Place of birth for the foreign-born population - Uruguay (%)
Place of birth for the foreign-born population - Venezuela (%)
Place of birth for the foreign-born population - Other South America (%)
Place of birth for the foreign-born population - Canada (%)
Place of birth for the foreign-born population - Other Northern America (%)
Place of birth for the foreign-born population - Other (%)
Latest news about races in Clayton, NC collected exclusively by city-data.com from local newspapers, TV, and radio stations
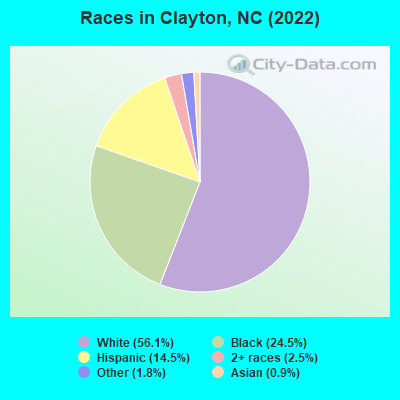
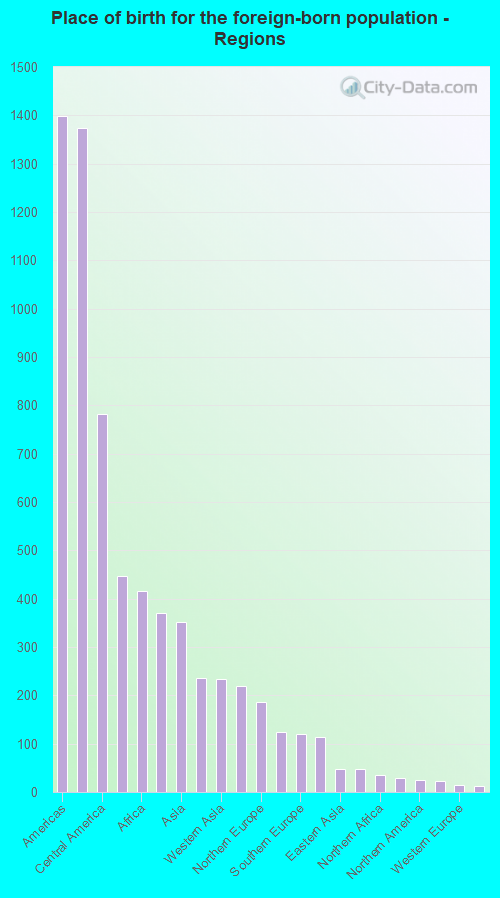
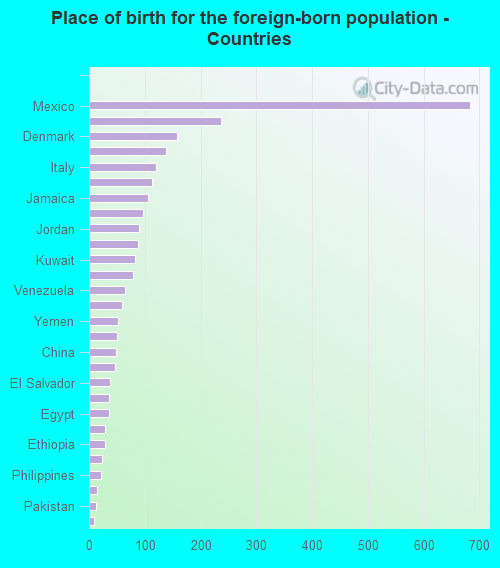
According to 2022 data, the most numerous races in Clayton, NC are White alone (16,137 residents), Black alone (7,046 residents), and Hispanic (4,170 residents). 85.1% of Clayton residents speak English at home. 9.1% of Clayton, NC residents are foreign-born (4.8% born in Latin America, 1.6% born in Europe, 1.5% born in Africa, 1.2% born in Asia), which is 12.0% greater than the foreign-born rate of 8.0% across the entire state of North Carolina.
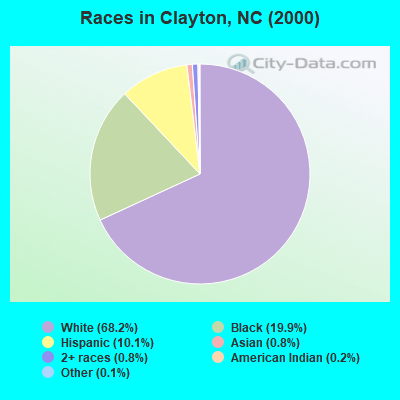
Race distribution in Clayton
2000 2022
5,647,155 70.2% White alone 1,723,301 21.4% Black alone 378,963 4.7% Hispanic 112,416 1.4% Asian alone 95,333 1.2% American Indian alone 79,965 1.0% Two or more races 9,015 0.1% Other race alone 3,165 0.04% Native Hawaiian and Other
6,497,519 60.7% White alone 2,155,650 20.1% Black alone 1,114,799 10.4% Hispanic 438,061 4.1% Two or more races 341,052 3.2% Asian alone 91,758 0.9% American Indian alone 50,180 0.5% Other race alone 9,954 0.09% Native Hawaiian and Other
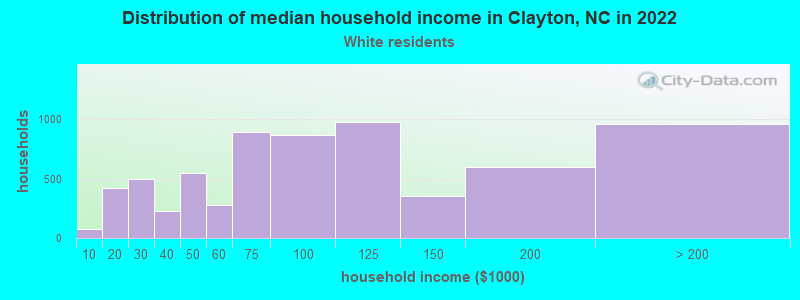
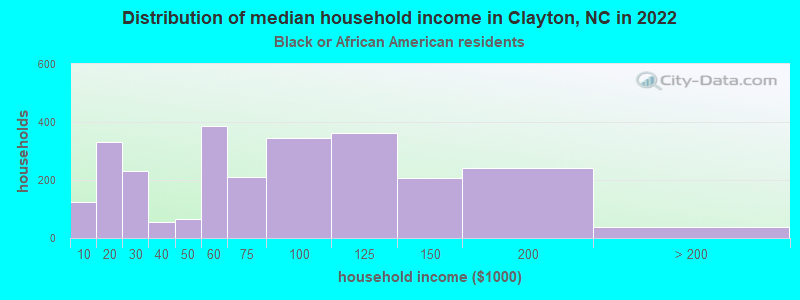
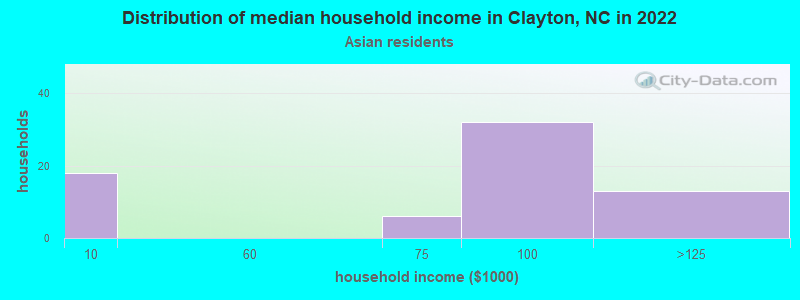
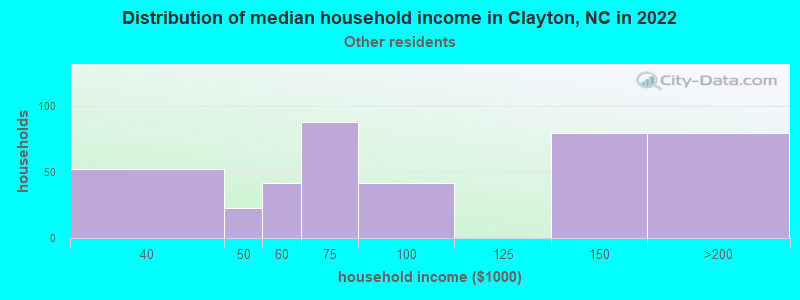
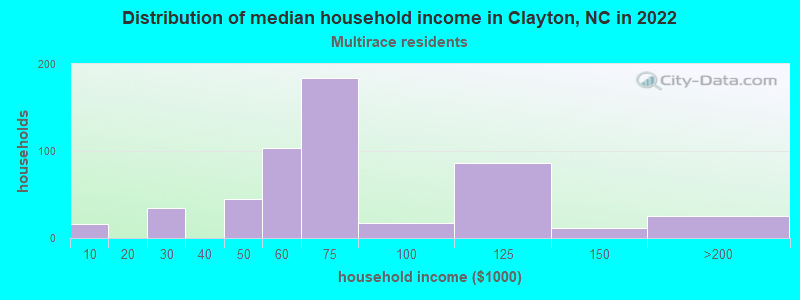
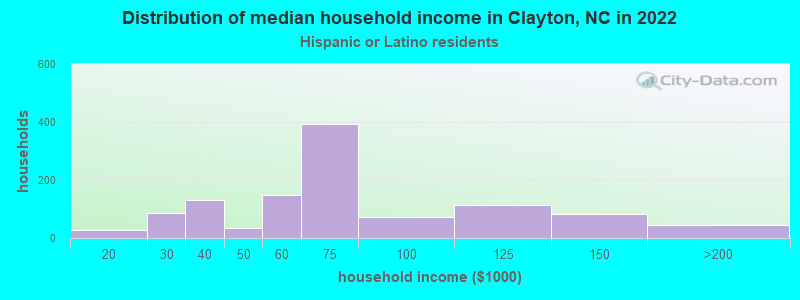
Income and house value in Clayton Median household income in 2022 $86,668 White non-Hispanic householders$72,267 Black householders$76,744 Asian householders$73,913 Some other race householders$82,869 Two or more races householders$76,338 Hispanic or Latino race householdersMedian 2022 house value $349,521 White Non-Hispanic householders$258,961 Black or African American householders$378,598 Hispanic or Latino householders
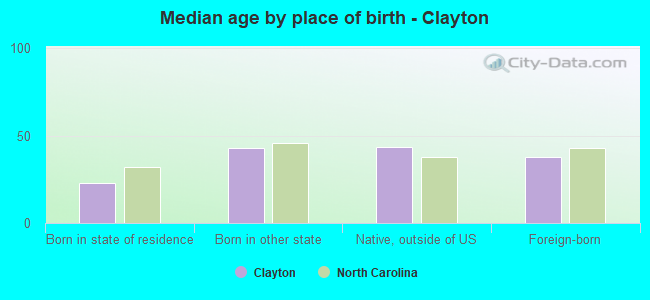
Median age by race in Clayton
37.6 Median age for White residents34.4 39.6 31.4 Median age for Black or African American residents29.3 40.0 -583,668,004.8 Median age for American Indian / Alaska Native residents-413,333,332.9 -828,729,280.9 48.2 Median age for Asian residents48.3 50.7 -609,884,331.7 Median age for Native Hawaiian / Pacific Islander residents-611,708,482.1 -666,666,666.0 27.4 Median age for Other race residents26.7 30.0 22.1 Median age for Two or more races residents18.1 26.4 38.8 Median age for White alone residents34.1 41.8 27.2 Median age for Hispanic or Latino residents28.2 26.6
Owner/renter occupied households by race in Clayton
House owners and renters - White residents 4,642 72.0% Owner occupied1,808 28.0% Renter occupiedHouse owners and renters - Black or African American residents 1,900 67.3% Owner occupied923 32.7% Renter occupiedHouse owners and renters - American Indian / Alaska Native residents 5 100.0% Owner occupiedHouse owners and renters - Asian residents 53 76.2% Owner occupied17 23.8% Renter occupiedHouse owners and renters - Other race residents 421 79.7% Owner occupied107 20.3% Renter occupiedHouse owners and renters - Two or more races residents 296 69.1% Owner occupied133 30.9% Renter occupiedHouse owners and renters - White alone residents 4,387 71.0% Owner occupied1,790 29.0% Renter occupiedHouse owners and renters - Hispanic or Latino residents 858 76.4% Owner occupied265 23.6% Renter occupied
Language usage in Clayton
English speakers - Total 85.1% of residents of Clayton speak English at home.
10.3% of residents speak Spanish at home 1,586 57.2% Speak English very well1,189 42.8% Speak English less than very well3.4% of residents speak other language at home 684 75.1% Speak English very well227 24.9% Speak English less than very well
English speakers - Born in the United States 91.6% of residents of Clayton speak English at home.
5.5% of residents speak Spanish at home 659 100.0% Speak English very well1.7% of residents speak other language at home 199 100.0% Speak English very well
English speakers - Native, born elsewhere 61.6% of residents of Clayton speak English at home.
26.4% of residents speak Spanish at home 57 100.0% Speak English very well13.0% of residents speak other language at home 28 100.0% Speak English very well
English speakers - Foreign-born 24.7% of residents of Clayton speak English at home.
43.8% of residents speak Spanish at home 606 47.8% Speak English very well662 52.2% Speak English less than very well23.4% of residents speak other language at home 415 61.2% Speak English very well263 38.8% Speak English less than very well
White (Caucasian) - Speak only English Native:
94.8% (14,539)Foreign-born:
28.6% (239)
White (Caucasian) - Speak another language Native:
5.7% (868)Foreign-born:
66.3% (554)
Black or African American - Speak only English Native:
99.5% (5,401)Foreign-born:
36.5% (237)
Black or African American - Speak another language Native:
0.6% (32)Foreign-born:
63.4% (412)
American Indian / Alaska Native - Speak another language Native:
100.0% (9)Foreign-born:
100.0% (9)
Asian - Speak only English Native:
49.7% (25)Foreign-born:
45.9% (72)
Asian - Speak another language Native:
50.3% (25)Foreign-born:
53.5% (84)
Other race - Speak only English Native:
40.7% (559)Foreign-born:
2.7% (15)
Other race - Speak another language Native:
43.0% (590)Foreign-born:
97.4% (543)
Two or more races - Speak only English Native:
73.1% (1,061)Foreign-born:
1.8% (8)
Two or more races - Speak another language Native:
26.9% (391)Foreign-born:
99.6% (430)
White alone - Speak only English Native:
96.9% (14,164)Foreign-born:
19.8% (117)
White alone - Speak another language Native:
2.4% (344)Foreign-born:
56.5% (335)
Hispanic or Latino - Speak only English Native:
46.2% (1,087)Foreign-born:
9.7% (126)
Hispanic or Latino - Speak another language Native:
55.9% (1,316)Foreign-born:
86.9% (1,125)
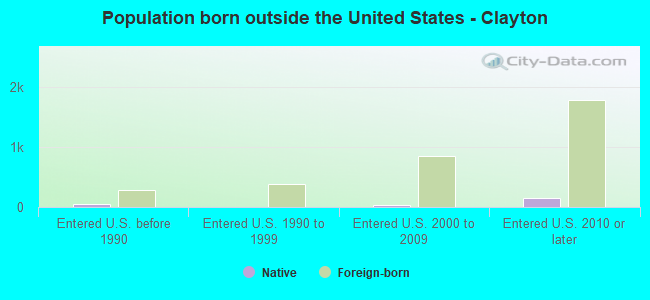
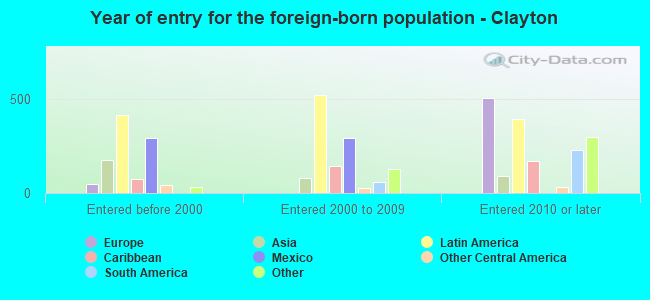
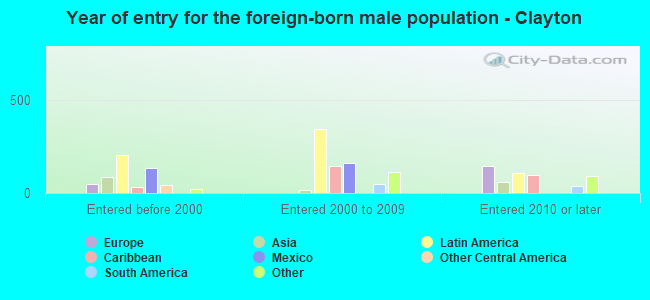
Foreign-born residents in Clayton 2,614 residents are foreign born (4.8% Latin America , 1.6% Europe , 1.5% Africa , 1.2% Asia ).
This city:
9.1%North Carolina:
8.3%
Marital status for residents in Clayton Marital status - White (Caucasian) population 15 years and over
Males 30.6% Never married57.3% Now married4.0% Separated1.5% Widowed6.5% DivorcedFemales 24.8% Never married48.9% Now married0.8% Separated9.3% Widowed16.2% DivorcedWomen who gave birth in the past 12 months Now married:
94.1% (107)Unmarried:
5.9% (7)
Women who did not give birth in the past 12 months Now married:
45.2% (1,884)Unmarried:
54.8% (2,280)
Marital status - Black or African American population 15 years and over
Males 53.2% Never married37.6% Now married0.8% Separated1.1% Widowed7.2% DivorcedFemales 39.9% Never married32.7% Now married3.4% Separated4.0% Widowed20.0% DivorcedWomen who gave birth in the past 12 months Now married:
78.0% (92)Unmarried:
22.0% (26)
Women who did not give birth in the past 12 months Now married:
32.4% (604)Unmarried:
67.6% (1,260)
Marital status - American Indian / Alaska Native population 15 years and over
Males 100.0% Never married0.0% Now married0.0% Separated0.0% Widowed0.0% DivorcedFemales 0.0% Never married100.0% Now married0.0% Separated0.0% Widowed0.0% DivorcedWomen who did not give birth in the past 12 months Now married:
100.0% (10)Unmarried:
0.0% (0)
Marital status - Asian population 15 years and over
Males 17.1% Never married82.9% Now married0.0% Separated0.0% Widowed0.0% DivorcedFemales 7.4% Never married92.6% Now married0.0% Separated0.0% Widowed0.0% DivorcedWomen who did not give birth in the past 12 months Now married:
90.9% (52)Unmarried:
9.1% (5)
Marital status - Other race population 15 years and over
Males 28.3% Never married67.8% Now married0.0% Separated1.7% Widowed2.2% DivorcedFemales 10.4% Never married85.1% Now married0.0% Separated0.0% Widowed4.5% DivorcedWomen who gave birth in the past 12 months Now married:
100.0% (55)Unmarried:
0.0% (0)
Women who did not give birth in the past 12 months Now married:
74.4% (331)Unmarried:
25.6% (114)
Marital status - Two or more races population 15 years and over
Males 54.5% Never married36.4% Now married0.0% Separated0.0% Widowed9.2% DivorcedFemales 34.8% Never married48.9% Now married2.0% Separated6.1% Widowed8.2% DivorcedWomen who gave birth in the past 12 months Now married:
100.0% (8)Unmarried:
0.0% (0)
Women who did not give birth in the past 12 months Now married:
44.8% (260)Unmarried:
55.2% (320)
Marital status - White alone, not Hispanic / Latino population 15 years and over
Males 27.1% Never married60.1% Now married4.6% Separated1.7% Widowed6.4% DivorcedFemales 22.5% Never married49.7% Now married0.8% Separated9.7% Widowed17.3% DivorcedWomen who gave birth in the past 12 months Now married:
92.3% (87)Unmarried:
7.7% (7)
Women who did not give birth in the past 12 months Now married:
46.9% (1,912)Unmarried:
53.1% (2,168)
Marital status - Hispanic or Latino population 15 years and over
Males 43.3% Never married51.8% Now married0.0% Separated0.7% Widowed4.2% DivorcedFemales 35.8% Never married59.5% Now married0.0% Separated3.1% Widowed1.5% DivorcedWomen who gave birth in the past 12 months Now married:
100.0% (84)Unmarried:
0.0% (0)
Women who did not give birth in the past 12 months Now married:
49.5% (519)Unmarried:
50.5% (530)
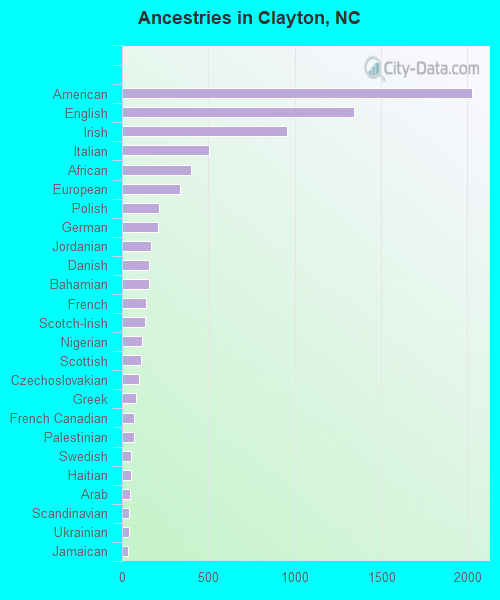
Ancestries in Clayton
2,024 12.6% American1,346 8.4% English957 5.9% Irish505 3.1% Italian402 2.5% African333 2.1% European215 1.3% Polish208 1.3% German168 1.0% Jordanian158 1.0% Danish156 1.0% Bahamian137 0.9% French136 0.8% Scotch-Irish113 0.7% Nigerian111 0.7% Scottish99 0.6% Czechoslovakian83 0.5% Greek72 0.4% French Canadian71 0.4% Palestinian55 0.3% Swedish54 0.3% Haitian49 0.3% Arab40 0.2% Scandinavian39 0.2% Ukrainian36 0.2% Jamaican31 0.2% Swiss23 0.1% Croatian21 0.1% British21 0.1% Belgian21 0.1% Welsh19 0.1% Northern European18 0.1% Ethiopian16 0.10% Canadian15 0.09% Slovak8 0.05% Dutch8 0.05% Lithuanian7 0.04% Austrian
Geographical mobility in Clayton Same house 1 year ago 13,887 82.0% White (Caucasian)6,531 92.0% Black or African American245 100.0% Asian2,329 95.3% Other race1,802 95.9% Two or more races13,262 82.2% White alone, not Hispanic / Latino3,553 87.0% Hispanic or LatinoMoved within same county 644 3.8% White / Caucasian257 3.6% Black or African American584 3.6% White alone, not Hispanic / Latino63 1.5% Hispanic or LatinoMoved within same state 1,549 9.2% White / Caucasian229 3.2% Black or African American138 5.6% Other race30 1.6% Two or more races1,484 9.2% White alone, not Hispanic / Latino242 5.9% Hispanic or LatinoMoved from different state 1,007 6.0% White / Caucasian125 1.8% Black or African American15 91.2% American Indian / Alaska Native23 1.2% Two or more races882 5.5% White alone, not Hispanic / Latino96 2.3% Hispanic or LatinoMoved from abroad 108 0.6% White35 1.9% Two or more races175 1.1% White alone, not Hispanic / Latino45 1.1% Hispanic or Latino
Children Nativity (place of birth) in Clayton
Children under 6 years - Living with two parents Both parents native 806 100.0% NativeBoth parents foreign-born 132 86.8% Native20 13.2% Foreign-bornOne native, one foreign-born parent 253 100.0% NativeChildren under 6 years - Living with one parent Native parent 1,283 100.0% NativeChildren 6 to 17 years - Living with two parents Both parents native 1,355 100.0% NativeBoth parents foreign-born 366 66.2% Native187 33.8% Foreign-bornOne native, one foreign-born parent 351 100.0% NativeChildren 6 to 17 years - Living with one parent Native parent 3,242 100.0% NativeForeign-born parent 239 55.6% Native191 44.4% Foreign-born
Grandparents responsible for own grandchildren in Clayton
Grandparents (30 to 59 years) White / Caucasian 72 57.1% Responsible for grandchildren54 42.9% Not responsible for grandchildrenBlack or African American 54 100.0% Responsible for grandchildrenOther race 115 45.2% Responsible for grandchildren139 54.8% Not responsible for grandchildrenWhite alone, not Hispanic / Latino 76 57.9% Responsible for grandchildren55 42.1% Not responsible for grandchildrenHispanic or Latino 124 100.0% Not responsible for grandchildrenGrandparents (60 years and over) White / Caucasian 89 100.0% Not responsible for grandchildrenBlack or African American 124 74.6% Responsible for grandchildren42 25.4% Not responsible for grandchildrenWhite alone, not Hispanic / Latino 91 100.0% Not responsible for grandchildren