Races in Claymont, Delaware (DE) Detailed Stats
Data:
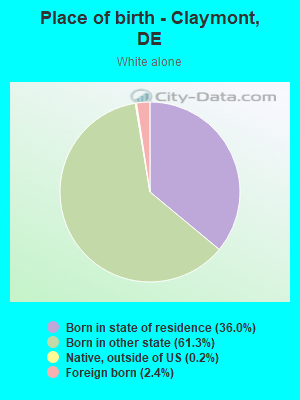
Races - White alone (%)
Races - White alone (% change since 2000)
Races - Black alone (%)
Races - Black alone (% change since 2000)
Races - American Indian alone (%)
Races - American Indian alone (% change since 2000)
Races - Asian alone (%)
Races - Asian alone (% change since 2000)
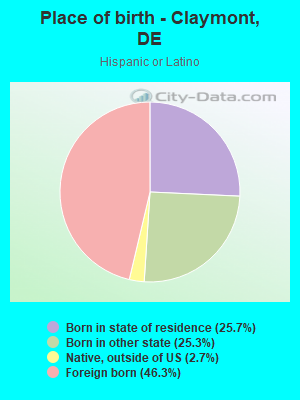
Races - Hispanic (%)
Races - Hispanic (% change since 2000)
Races - Native Hawaiian and Other Pacific Islander alone (%)
Races - Native Hawaiian and Other Pacific Islander alone (% change since 2000)
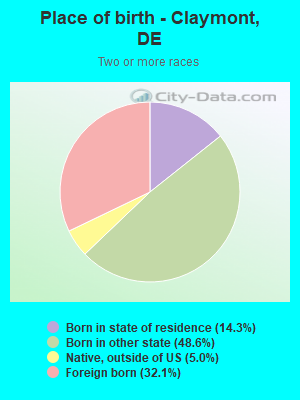
Races - Two or more races(%)
Races - Two or more races(% change since 2000)
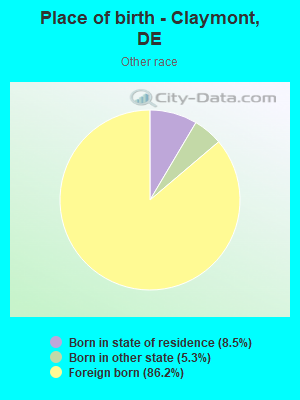
Races - Other race alone (%)
Races - Other race alone (% change since 2000)
Racial diversity
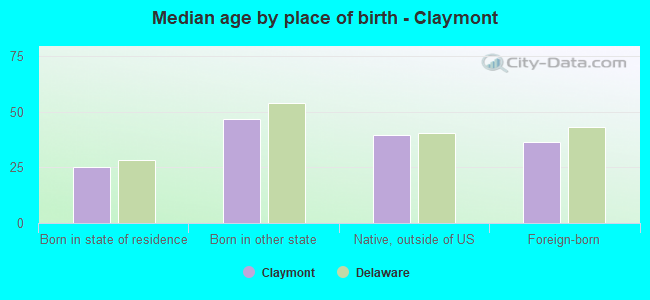
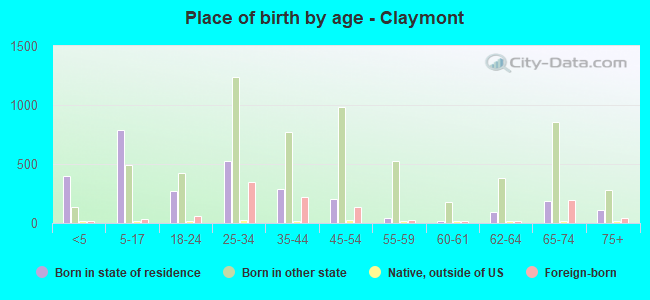
Place of birth - Born in state of residence (%)
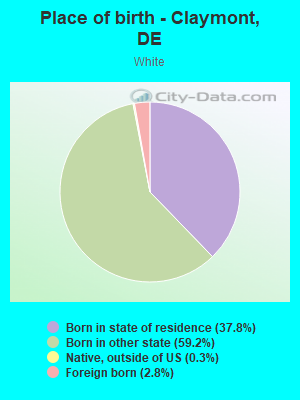
Place of birth - Born in state of residence (%) - White
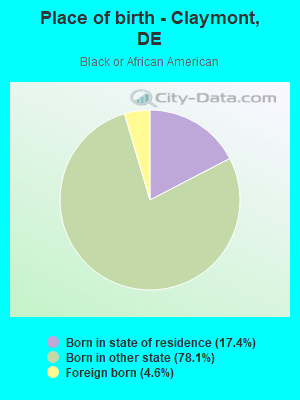
Place of birth - Born in state of residence (%) - Black or African American
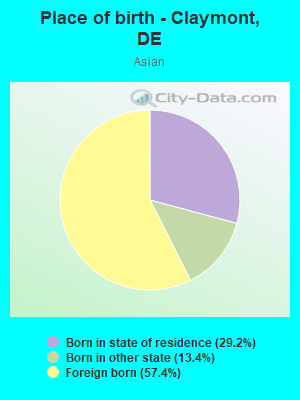
Place of birth - Born in state of residence (%) - Asian
Place of birth - Born in state of residence (%) - Hispanic or Latino
Place of birth - Born in state of residence (%) - American Indian and Alaska Native
Place of birth - Born in state of residence (%) - Multirace
Place of birth - Born in state of residence (%) - Other Race
Place of birth - Born in other state (%)
Place of birth - Born in other state (%) - White
Place of birth - Born in other state (%) - Black or African American
Place of birth - Born in other state (%) - Asian
Place of birth - Born in other state (%) - Hispanic or Latino
Place of birth - Born in other state (%) - American Indian and Alaska Native
Place of birth - Born in other state (%) - Multirace
Place of birth - Born in other state (%) - Other Race
Place of birth - Native, outside of US (%)
Place of birth - Native, outside of US (%) - White
Place of birth - Native, outside of US (%) - Black or African American
Place of birth - Native, outside of US (%) - Asian
Place of birth - Native, outside of US (%) - Hispanic or Latino
Place of birth - Native, outside of US (%) - American Indian and Alaska Native
Place of birth - Native, outside of US (%) - Multirace
Place of birth - Native, outside of US (%) - Other Race
Place of birth - Foreign born (%)
Place of birth - Foreign born (%) - White
Place of birth - Foreign born (%) - Black or African American
Place of birth - Foreign born (%) - Asian
Place of birth - Foreign born (%) - Hispanic or Latino
Place of birth - Foreign born (%) - American Indian and Alaska Native
Place of birth - Foreign born (%) - Multirace
Place of birth - Foreign born (%) - Other Race
Residents speaking English at home (%)
Residents speaking English at home - Born in the United States (%)
Residents speaking English at home - Native, born elsewhere (%)
Residents speaking English at home - Foreign born (%)
Residents speaking Spanish at home (%)
Residents speaking Spanish at home - Born in the United States (%)
Residents speaking Spanish at home - Native, born elsewhere (%)
Residents speaking Spanish at home - Foreign born (%)
Residents speaking other language at home (%)
Residents speaking other language at home - Born in the United States (%)
Residents speaking other language at home - Native, born elsewhere (%)
Residents speaking other language at home - Foreign born (%)
Marital status - Never married (%)
Marital status - Now married (%)
Marital status - Separated (%)
Marital status - Widowed (%)
Marital status - Divorced (%)
Ancestries Reported - Arab (%)
Ancestries Reported - Czech (%)
Ancestries Reported - Danish (%)
Ancestries Reported - Dutch (%)
Ancestries Reported - English (%)
Ancestries Reported - French (%)
Ancestries Reported - French Canadian (%)
Ancestries Reported - German (%)
Ancestries Reported - Greek (%)
Ancestries Reported - Hungarian (%)
Ancestries Reported - Irish (%)
Ancestries Reported - Italian (%)
Ancestries Reported - Lithuanian (%)
Ancestries Reported - Norwegian (%)
Ancestries Reported - Polish (%)
Ancestries Reported - Portuguese (%)
Ancestries Reported - Russian (%)
Ancestries Reported - Scotch-Irish (%)
Ancestries Reported - Scottish (%)
Ancestries Reported - Slovak (%)
Ancestries Reported - Subsaharan African (%)
Ancestries Reported - Swedish (%)
Ancestries Reported - Swiss (%)
Ancestries Reported - Ukrainian (%)
Ancestries Reported - United States (%)
Ancestries Reported - Welsh (%)
Ancestries Reported - West Indian (%)
Ancestries Reported - Other (%)
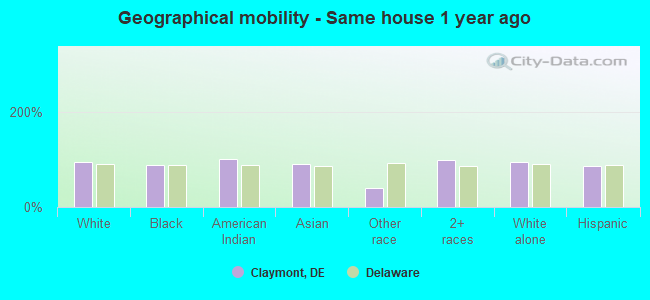
Geographical mobility - Same house 1 year ago (%)
Geographical mobility - Same house 1 year ago (%) - White
Geographical mobility - Same house 1 year ago (%) - Black or African American
Geographical mobility - Same house 1 year ago (%) - Asian
Geographical mobility - Same house 1 year ago (%) - Hispanic or Latino
Geographical mobility - Same house 1 year ago (%) - American Indian and Alaska Native
Geographical mobility - Same house 1 year ago (%) - Multirace
Geographical mobility - Same house 1 year ago (%) - Other Race
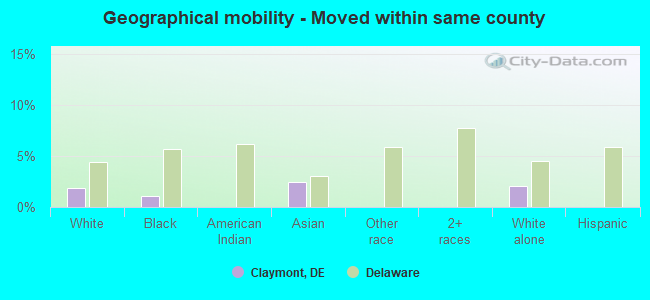
Geographical mobility - Moved within same county (%)
Geographical mobility - Moved within same county (%) - White
Geographical mobility - Moved within same county (%) - Black or African American
Geographical mobility - Moved within same county (%) - Asian
Geographical mobility - Moved within same county (%) - Hispanic or Latino
Geographical mobility - Moved within same county (%) - American Indian and Alaska Native
Geographical mobility - Moved within same county (%) - Multirace
Geographical mobility - Moved within same county (%) - Other Race
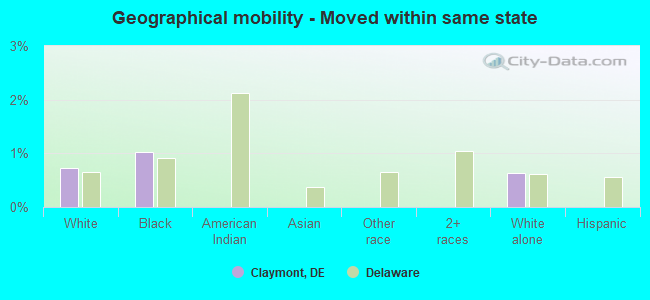
Geographical mobility - Moved from different county within same state (%)
Geographical mobility - Moved from different county within same state (%) - White
Geographical mobility - Moved from different county within same state (%) - Black or African American
Geographical mobility - Moved from different county within same state (%) - Asian
Geographical mobility - Moved from different county within same state (%) - Hispanic or Latino
Geographical mobility - Moved from different county within same state (%) - American Indian and Alaska Native
Geographical mobility - Moved from different county within same state (%) - Multirace
Geographical mobility - Moved from different county within same state (%) - Other Race
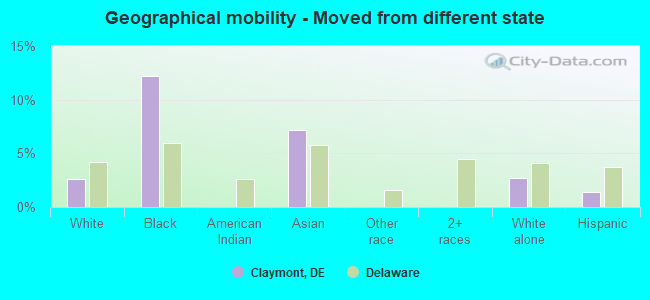
Geographical mobility - Moved from different state (%)
Geographical mobility - Moved from different state (%) - White
Geographical mobility - Moved from different state (%) - Black or African American
Geographical mobility - Moved from different state (%) - Asian
Geographical mobility - Moved from different state (%) - Hispanic or Latino
Geographical mobility - Moved from different state (%) - American Indian and Alaska Native
Geographical mobility - Moved from different state (%) - Multirace
Geographical mobility - Moved from different state (%) - Other Race
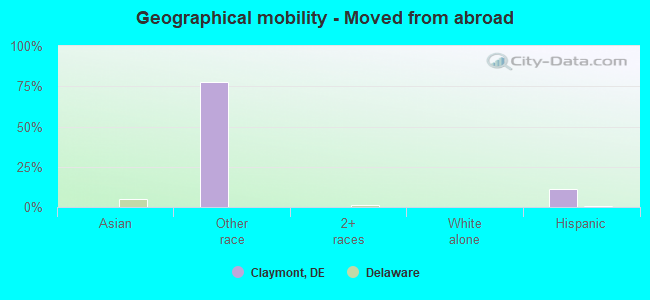
Geographical mobility - Moved from abroad (%)
Geographical mobility - Moved from abroad (%) - White
Geographical mobility - Moved from abroad (%) - Black or African American
Geographical mobility - Moved from abroad (%) - Asian
Geographical mobility - Moved from abroad (%) - Hispanic or Latino
Geographical mobility - Moved from abroad (%) - American Indian and Alaska Native
Geographical mobility - Moved from abroad (%) - Multirace
Geographical mobility - Moved from abroad (%) - Other Race
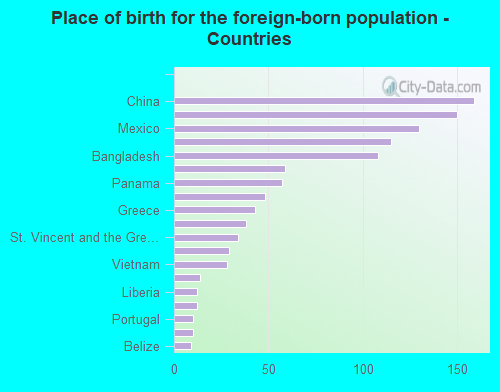
Place of birth for the foreign-born population - Ireland (%)
Place of birth for the foreign-born population - Denmark (%)
Place of birth for the foreign-born population - Norway (%)
Place of birth for the foreign-born population - Sweden (%)
Place of birth for the foreign-born population - United Kingdom (%)
Place of birth for the foreign-born population - England (%)
Place of birth for the foreign-born population - Scotland (%)
Place of birth for the foreign-born population - Other Northern Europe (%)
Place of birth for the foreign-born population - Austria (%)
Place of birth for the foreign-born population - Belgium (%)
Place of birth for the foreign-born population - France (%)
Place of birth for the foreign-born population - Germany (%)
Place of birth for the foreign-born population - Netherlands (%)
Place of birth for the foreign-born population - Switzerland (%)
Place of birth for the foreign-born population - Other Western Europe (%)
Place of birth for the foreign-born population - Greece (%)
Place of birth for the foreign-born population - Italy (%)
Place of birth for the foreign-born population - Portugal (%)
Place of birth for the foreign-born population - Spain (%)
Place of birth for the foreign-born population - Other Southern Europe (%)
Place of birth for the foreign-born population - Albania (%)
Place of birth for the foreign-born population - Belarus (%)
Place of birth for the foreign-born population - Bosnia and Herzegovina (%)
Place of birth for the foreign-born population - Bulgaria (%)
Place of birth for the foreign-born population - Croatia (%)
Place of birth for the foreign-born population - Czechoslovakia (%)
Place of birth for the foreign-born population - Hungary (%)
Place of birth for the foreign-born population - Latvia (%)
Place of birth for the foreign-born population - Lithuania (%)
Place of birth for the foreign-born population - North Macedonia (Macedonia) (%)
Place of birth for the foreign-born population - Moldova (%)
Place of birth for the foreign-born population - Poland (%)
Place of birth for the foreign-born population - Romania (%)
Place of birth for the foreign-born population - Russia (%)
Place of birth for the foreign-born population - Serbia (%)
Place of birth for the foreign-born population - Ukraine (%)
Place of birth for the foreign-born population - Other Eastern Europe (%)
Place of birth for the foreign-born population - China (%)
Place of birth for the foreign-born population - Hong Kong (%)
Place of birth for the foreign-born population - Taiwan (%)
Place of birth for the foreign-born population - Japan (%)
Place of birth for the foreign-born population - Korea (%)
Place of birth for the foreign-born population - Other Eastern Asia (%)
Place of birth for the foreign-born population - Afghanistan (%)
Place of birth for the foreign-born population - Bangladesh (%)
Place of birth for the foreign-born population - India (%)
Place of birth for the foreign-born population - Iran (%)
Place of birth for the foreign-born population - Kazakhstan (%)
Place of birth for the foreign-born population - Nepal (%)
Place of birth for the foreign-born population - Pakistan (%)
Place of birth for the foreign-born population - Sri Lanka (%)
Place of birth for the foreign-born population - Uzbekistan (%)
Place of birth for the foreign-born population - Other South Central Asia (%)
Place of birth for the foreign-born population - Burma (%)
Place of birth for the foreign-born population - Cambodia (%)
Place of birth for the foreign-born population - Indonesia (%)
Place of birth for the foreign-born population - Laos (%)
Place of birth for the foreign-born population - Malaysia (%)
Place of birth for the foreign-born population - Philippines (%)
Place of birth for the foreign-born population - Singapore (%)
Place of birth for the foreign-born population - Thailand (%)
Place of birth for the foreign-born population - Vietnam (%)
Place of birth for the foreign-born population - Other South Eastern Asia (%)
Place of birth for the foreign-born population - Armenia (%)
Place of birth for the foreign-born population - Iraq (%)
Place of birth for the foreign-born population - Israel (%)
Place of birth for the foreign-born population - Jordan (%)
Place of birth for the foreign-born population - Kuwait (%)
Place of birth for the foreign-born population - Lebanon (%)
Place of birth for the foreign-born population - Saudi Arabia (%)
Place of birth for the foreign-born population - Syria (%)
Place of birth for the foreign-born population - Turkey (%)
Place of birth for the foreign-born population - Yemen (%)
Place of birth for the foreign-born population - Other Western Asia (%)
Place of birth for the foreign-born population - Eritrea (%)
Place of birth for the foreign-born population - Ethiopia (%)
Place of birth for the foreign-born population - Kenya (%)
Place of birth for the foreign-born population - Somalia (%)
Place of birth for the foreign-born population - Uganda (%)
Place of birth for the foreign-born population - Zimbabwe (%)
Place of birth for the foreign-born population - Other Eastern Africa (%)
Place of birth for the foreign-born population - Cameroon (%)
Place of birth for the foreign-born population - Congo (%)
Place of birth for the foreign-born population - Democratic Republic of Congo (Zaire) (%)
Place of birth for the foreign-born population - Other Middle Africa (%)
Place of birth for the foreign-born population - Egypt (%)
Place of birth for the foreign-born population - Morocco (%)
Place of birth for the foreign-born population - Sudan (%)
Place of birth for the foreign-born population - Other Northern Africa (%)
Place of birth for the foreign-born population - South Africa (%)
Place of birth for the foreign-born population - Other Southern Africa (%)
Place of birth for the foreign-born population - Cabo Verde (%)
Place of birth for the foreign-born population - Ghana (%)
Place of birth for the foreign-born population - Liberia (%)
Place of birth for the foreign-born population - Nigeria (%)
Place of birth for the foreign-born population - Senegal (%)
Place of birth for the foreign-born population - Sierra Leone (%)
Place of birth for the foreign-born population - Other Western Africa (%)
Place of birth for the foreign-born population - Australia (%)
Place of birth for the foreign-born population - New Zealand (%)
Place of birth for the foreign-born population - Fiji (%)
Place of birth for the foreign-born population - Micronesia (%)
Place of birth for the foreign-born population - Bahamas (%)
Place of birth for the foreign-born population - Barbados (%)
Place of birth for the foreign-born population - Cuba (%)
Place of birth for the foreign-born population - Dominica (%)
Place of birth for the foreign-born population - Dominican Republic (%)
Place of birth for the foreign-born population - Grenada (%)
Place of birth for the foreign-born population - Haiti (%)
Place of birth for the foreign-born population - Jamaica (%)
Place of birth for the foreign-born population - St. Vincent and the Grenadines (%)
Place of birth for the foreign-born population - Trinidad and Tobago (%)
Place of birth for the foreign-born population - West Indies (%)
Place of birth for the foreign-born population - Other Caribbean (%)
Place of birth for the foreign-born population - Belize (%)
Place of birth for the foreign-born population - Costa Rica (%)
Place of birth for the foreign-born population - El Salvador (%)
Place of birth for the foreign-born population - Guatemala (%)
Place of birth for the foreign-born population - Honduras (%)
Place of birth for the foreign-born population - Mexico (%)
Place of birth for the foreign-born population - Nicaragua (%)
Place of birth for the foreign-born population - Panama (%)
Place of birth for the foreign-born population - Other Central America (%)
Place of birth for the foreign-born population - Argentina (%)
Place of birth for the foreign-born population - Bolivia (%)
Place of birth for the foreign-born population - Brazil (%)
Place of birth for the foreign-born population - Chile (%)
Place of birth for the foreign-born population - Colombia (%)
Place of birth for the foreign-born population - Ecuador (%)
Place of birth for the foreign-born population - Guyana (%)
Place of birth for the foreign-born population - Peru (%)
Place of birth for the foreign-born population - Uruguay (%)
Place of birth for the foreign-born population - Venezuela (%)
Place of birth for the foreign-born population - Other South America (%)
Place of birth for the foreign-born population - Canada (%)
Place of birth for the foreign-born population - Other Northern America (%)
Place of birth for the foreign-born population - Other (%)
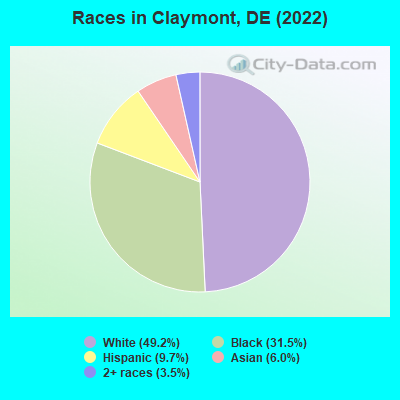
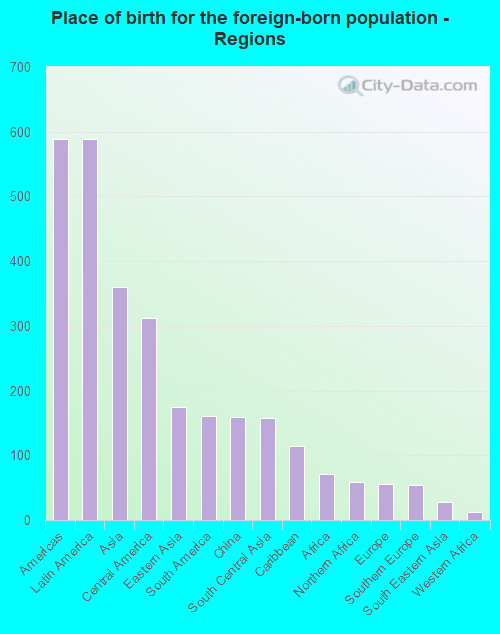
According to 2022 data, the most numerous races in Claymont, DE are White alone (5,054 residents), Black alone (3,236 residents), and Hispanic (995 residents). 85.7% of Claymont residents speak English at home. 10.4% of Claymont, DE residents are foreign-born (5.7% born in Latin America, 3.5% born in Asia), which is 13.9% greater than the foreign-born rate of 9.0% across the entire state of Delaware.
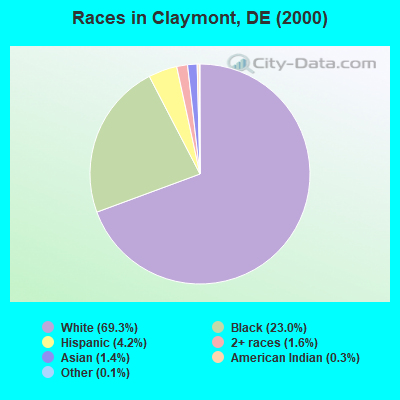
Race distribution in Claymont
2000 2022
567,973 72.5% White alone 148,435 18.9% Black alone 37,277 4.8% Hispanic 16,110 2.1% Asian alone 10,222 1.3% Two or more races 2,324 0.3% American Indian alone 1,025 0.1% Other race alone 234 0.03% Native Hawaiian and Other
599,347 58.9% White alone 220,010 21.6% Black alone 105,300 10.3% Hispanic 46,016 4.5% Two or more races 41,350 4.1% Asian alone 5,097 0.5% Other race alone 1,276 0.1% American Indian alone
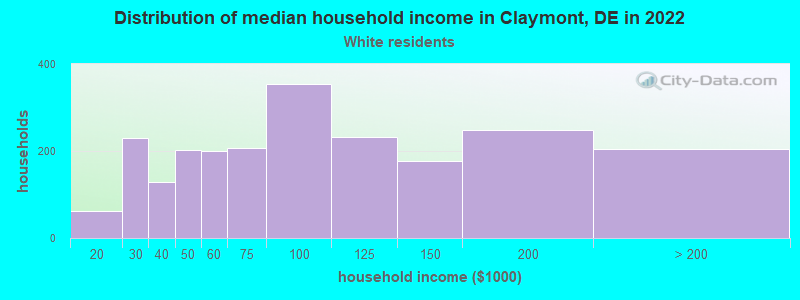
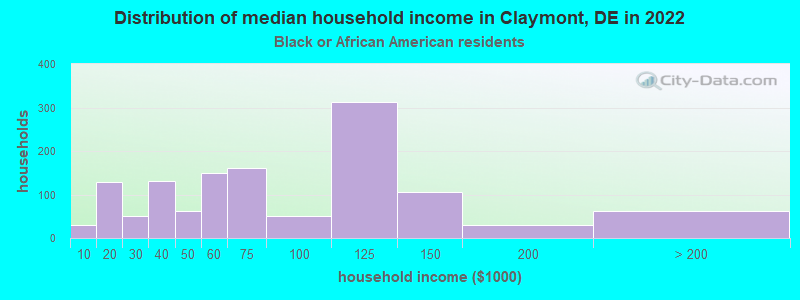
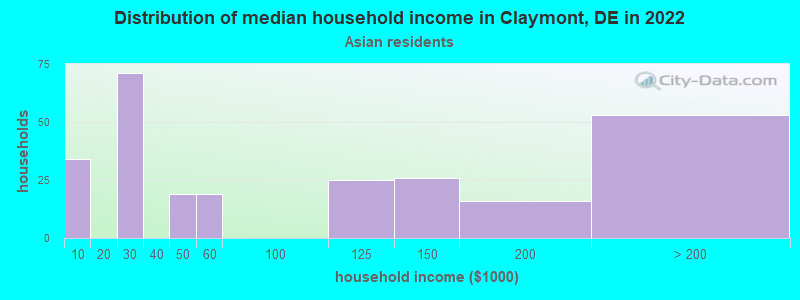
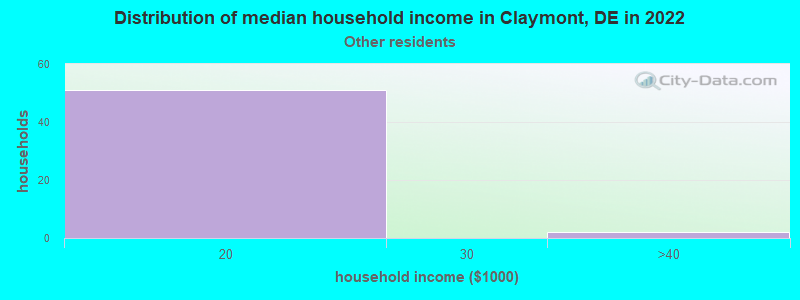
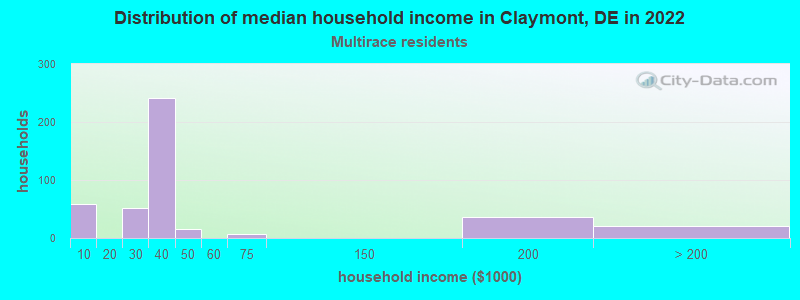
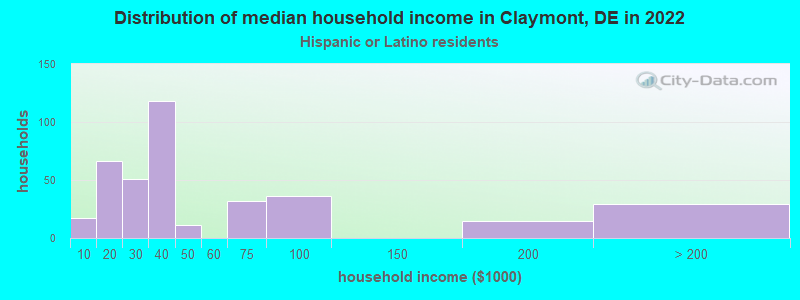
Income and house value in Claymont Median household income in 2022 $76,771 White non-Hispanic householders$71,242 Black householders$13,069 Some other race householders$29,924 Two or more races householders$33,689 Hispanic or Latino race householdersMedian 2022 house value $267,337 White Non-Hispanic householders$254,118 Black or African American householders $370,352 Asian householders$212,183 Two or more races householders$317,477 Hispanic or Latino householders
Median age by race in Claymont
44.5 Median age for White residents42.3 49.1 35.8 Median age for Black or African American residents32.0 35.8 -592,964,823.5 Median age for American Indian / Alaska Native residents-639,393,938.8 -659,673,659.0 30.6 Median age for Asian residents30.2 31.6 -666,666,666.0 Median age for Native Hawaiian / Pacific Islander residents-668,724,279.2 -670,599,802.7 26.0 Median age for Other race residents27.8 23.3 41.1 Median age for Two or more races residents20.4 50.7 46.7 Median age for White alone residents42.9 48.0 27.8 Median age for Hispanic or Latino residents27.3 31.4
Owner/renter occupied households by race in Claymont
House owners and renters - White residents 1,441 65.3% Owner occupied765 34.7% Renter occupiedHouse owners and renters - Black or African American residents 481 37.8% Owner occupied792 62.2% Renter occupiedHouse owners and renters - American Indian / Alaska Native residents 18 100.0% Owner occupiedHouse owners and renters - Asian residents 125 57.2% Owner occupied94 42.8% Renter occupiedHouse owners and renters - Other race residents 11 24.0% Owner occupied36 76.0% Renter occupiedHouse owners and renters - Two or more races residents 335 75.5% Owner occupied109 24.5% Renter occupiedHouse owners and renters - White alone residents 1,448 64.7% Owner occupied791 35.3% Renter occupiedHouse owners and renters - Hispanic or Latino residents 269 67.1% Owner occupied132 32.9% Renter occupied
Language usage in Claymont
English speakers - Total 85.7% of residents of Claymont speak English at home.
7.0% of residents speak Spanish at home 266 38.9% Speak English very well417 61.1% Speak English less than very well7.1% of residents speak other language at home 406 58.8% Speak English very well285 41.2% Speak English less than very well
English speakers - Born in the United States 96.4% of residents of Claymont speak English at home.
2.1% of residents speak Spanish at home 52 39.7% Speak English very well79 60.3% Speak English less than very well1.6% of residents speak other language at home 73 76.8% Speak English very well22 23.2% Speak English less than very well
English speakers - Native, born elsewhere 50.9% of residents of Claymont speak English at home.
45.3% of residents speak Spanish at home 24 100.0% Speak English very well
English speakers - Foreign-born 13.5% of residents of Claymont speak English at home.
36.8% of residents speak Spanish at home 83 20.8% Speak English very well317 79.2% Speak English less than very well46.2% of residents speak other language at home 286 56.9% Speak English very well217 43.1% Speak English less than very well
White (Caucasian) - Speak only English Native:
97.5% (4,655)Foreign-born:
0.6% (1)
White (Caucasian) - Speak another language Native:
2.3% (110)Foreign-born:
84.6% (123)
Black or African American - Speak only English Native:
99.3% (3,123)Foreign-born:
56.2% (88)
Black or African American - Speak another language Native:
0.9% (28)Foreign-born:
38.3% (60)
Asian - Speak only English Native:
15.4% (29)Foreign-born:
9.3% (34)
Asian - Speak another language Native:
97.5% (182)Foreign-born:
88.3% (318)
Other race - Speak another language Native:
43.3% (8)Foreign-born:
91.5% (177)
Two or more races - Speak only English Native:
74.6% (371)Foreign-born:
5.7% (17)
Two or more races - Speak another language Native:
23.4% (116)Foreign-born:
93.4% (272)
White alone - Speak only English Native:
98.5% (4,618)Foreign-born:
0.8% (1)
White alone - Speak another language Native:
1.5% (68)Foreign-born:
97.3% (118)
Hispanic or Latino - Speak only English Native:
50.9% (243)Foreign-born:
10.8% (50)
Hispanic or Latino - Speak another language Native:
49.8% (238)Foreign-born:
88.1% (406)
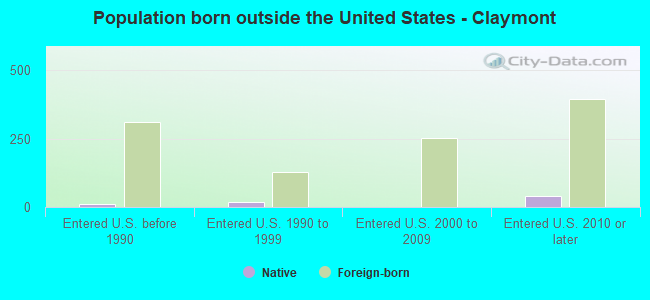
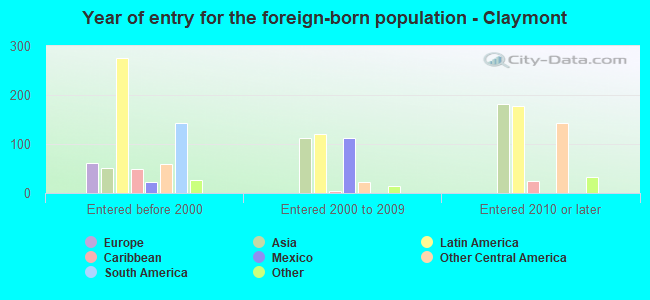
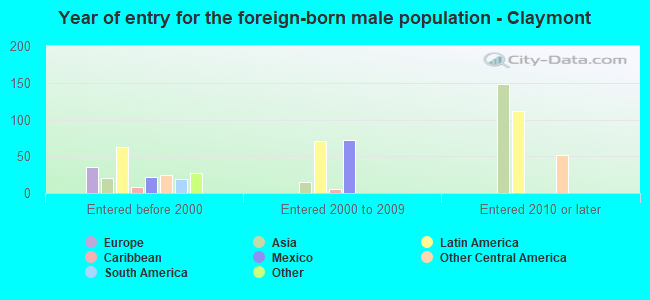
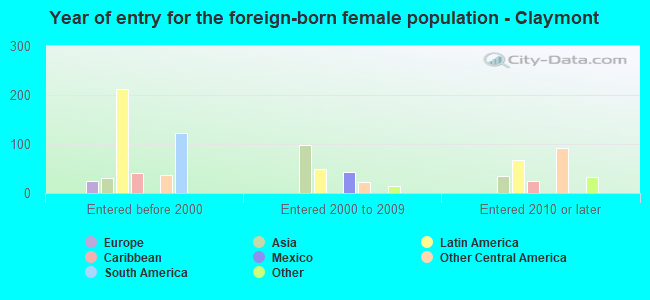
Foreign-born residents in Claymont 1,074 residents are foreign born (5.7% Latin America , 3.5% Asia ).
This city:
10.4%Delaware:
9.8%
Marital status for residents in Claymont Marital status - White (Caucasian) population 15 years and over
Males 43.0% Never married44.7% Now married0.0% Separated2.3% Widowed10.0% DivorcedFemales 31.4% Never married44.5% Now married2.3% Separated7.4% Widowed14.4% DivorcedWomen who gave birth in the past 12 months Now married:
83.7% (65)Unmarried:
16.3% (13)
Women who did not give birth in the past 12 months Now married:
36.9% (357)Unmarried:
63.1% (611)
Marital status - Black or African American population 15 years and over
Males 51.2% Never married43.0% Now married1.3% Separated0.0% Widowed4.5% DivorcedFemales 46.9% Never married33.1% Now married0.9% Separated6.8% Widowed12.4% DivorcedWomen who gave birth in the past 12 months Now married:
100.0% (13)Unmarried:
0.0% (0)
Women who did not give birth in the past 12 months Now married:
25.7% (236)Unmarried:
74.3% (685)
Marital status - Asian population 15 years and over
Males 34.2% Never married60.0% Now married0.0% Separated0.0% Widowed5.8% DivorcedFemales 22.1% Never married71.6% Now married0.0% Separated6.3% Widowed0.0% DivorcedWomen who did not give birth in the past 12 months Now married:
74.8% (124)Unmarried:
25.2% (42)
Marital status - Other race population 15 years and over
Males 40.0% Never married60.0% Now married0.0% Separated0.0% Widowed0.0% DivorcedFemales 20.0% Never married80.0% Now married0.0% Separated0.0% Widowed0.0% DivorcedWomen who gave birth in the past 12 months Now married:
0.0% (0)Unmarried:
100.0% (1)
Women who did not give birth in the past 12 months Now married:
100.0% (47)Unmarried:
0.0% (0)
Marital status - Two or more races population 15 years and over
Males 81.6% Never married18.4% Now married0.0% Separated0.0% Widowed0.0% DivorcedFemales 41.9% Never married13.7% Now married0.0% Separated41.3% Widowed3.1% DivorcedWomen who did not give birth in the past 12 months Now married:
13.8% (32)Unmarried:
86.2% (202)
Marital status - White alone, not Hispanic / Latino population 15 years and over
Males 42.8% Never married44.7% Now married0.0% Separated2.4% Widowed10.1% DivorcedFemales 31.3% Never married43.8% Now married2.3% Separated7.6% Widowed15.0% DivorcedWomen who gave birth in the past 12 months Now married:
100.0% (43)Unmarried:
0.0% (0)
Women who did not give birth in the past 12 months Now married:
35.8% (357)Unmarried:
64.2% (639)
Marital status - Hispanic or Latino population 15 years and over
Males 50.6% Never married45.6% Now married0.0% Separated0.0% Widowed3.8% DivorcedFemales 41.3% Never married21.9% Now married0.0% Separated33.4% Widowed3.4% DivorcedWomen who gave birth in the past 12 months Now married:
64.3% (29)Unmarried:
35.7% (16)
Women who did not give birth in the past 12 months Now married:
30.4% (74)Unmarried:
69.6% (169)
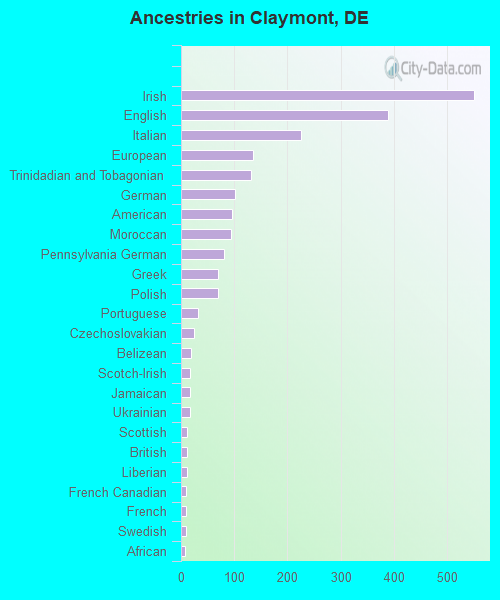
Ancestries in Claymont
551 10.3% Irish388 7.3% English226 4.2% Italian135 2.5% European131 2.4% Trinidadian and Tobagonian101 1.9% German95 1.8% American94 1.8% Moroccan80 1.5% Pennsylvania German69 1.3% Greek69 1.3% Polish32 0.6% Portuguese25 0.5% Czechoslovakian18 0.3% Belizean17 0.3% Scotch-Irish17 0.3% Jamaican16 0.3% Ukrainian12 0.2% Scottish11 0.2% British11 0.2% Liberian10 0.2% French Canadian9 0.2% French9 0.2% Swedish8 0.1% African
Children Nativity (place of birth) in Claymont
Children under 6 years - Living with two parents Both parents native 351 100.0% NativeBoth parents foreign-born 89 70.4% Native38 29.6% Foreign-bornChildren under 6 years - Living with one parent Native parent 195 100.0% NativeForeign-born parent 60 100.0% NativeChildren 6 to 17 years - Living with two parents Both parents native 440 100.0% NativeBoth parents foreign-born 159 100.0% NativeOne native, one foreign-born parent 61 100.0% NativeChildren 6 to 17 years - Living with one parent Native parent 324 100.0% NativeForeign-born parent 54 53.6% Native47 46.4% Foreign-born
Grandparents responsible for own grandchildren in Claymont
Grandparents (30 to 59 years) White / Caucasian 7 100.0% Not responsible for grandchildrenWhite alone, not Hispanic / Latino 5 100.0% Not responsible for grandchildrenGrandparents (60 years and over) White / Caucasian 20 65.7% Responsible for grandchildren11 34.3% Not responsible for grandchildrenWhite alone, not Hispanic / Latino 21 65.7% Responsible for grandchildren11 34.3% Not responsible for grandchildren