Races in Circle Pines, Minnesota (MN) Detailed Stats
Data:
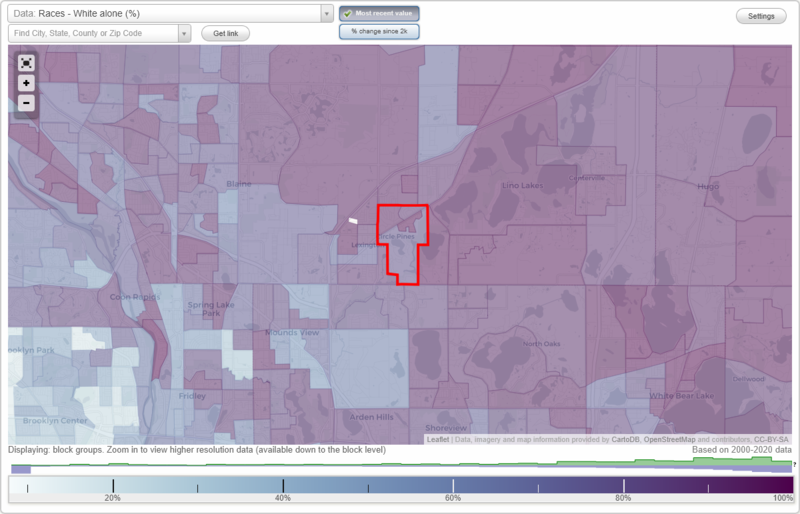
Races - White alone (%)
Races - White alone (% change since 2000)
Races - Black alone (%)
Races - Black alone (% change since 2000)
Races - American Indian alone (%)
Races - American Indian alone (% change since 2000)
Races - Asian alone (%)
Races - Asian alone (% change since 2000)
Races - Hispanic (%)
Races - Hispanic (% change since 2000)
Races - Native Hawaiian and Other Pacific Islander alone (%)
Races - Native Hawaiian and Other Pacific Islander alone (% change since 2000)
Races - Two or more races(%)
Races - Two or more races(% change since 2000)
Races - Other race alone (%)
Races - Other race alone (% change since 2000)
Racial diversity
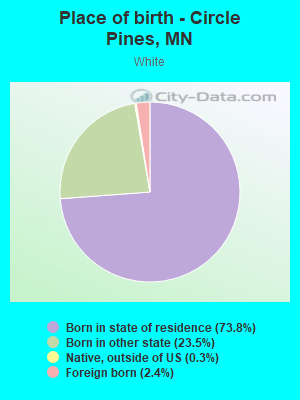
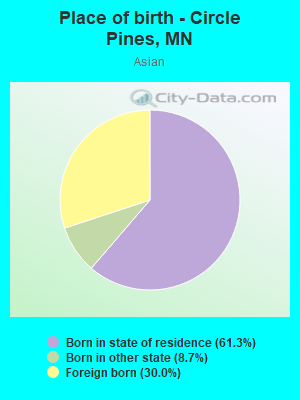
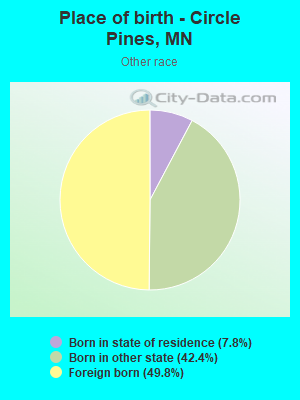
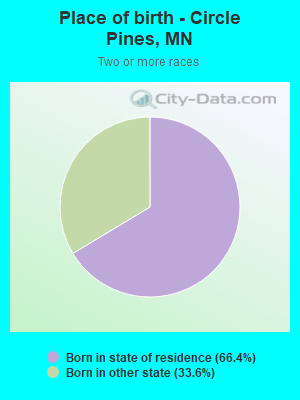
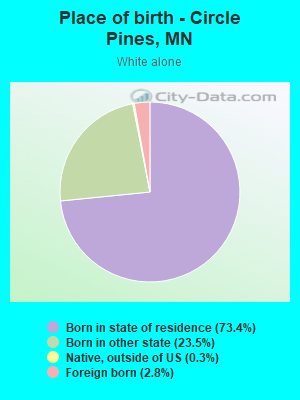
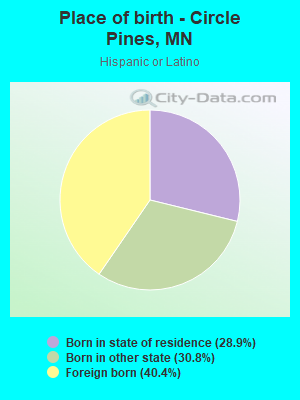
Place of birth - Born in state of residence (%)
Place of birth - Born in state of residence (%) - White
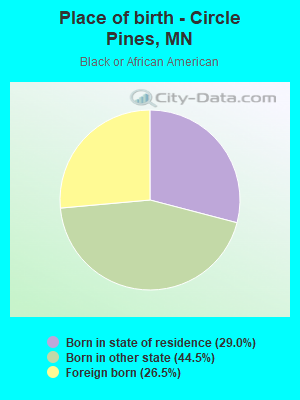
Place of birth - Born in state of residence (%) - Black or African American
Place of birth - Born in state of residence (%) - Asian
Place of birth - Born in state of residence (%) - Hispanic or Latino
Place of birth - Born in state of residence (%) - American Indian and Alaska Native
Place of birth - Born in state of residence (%) - Multirace
Place of birth - Born in state of residence (%) - Other Race
Place of birth - Born in other state (%)
Place of birth - Born in other state (%) - White
Place of birth - Born in other state (%) - Black or African American
Place of birth - Born in other state (%) - Asian
Place of birth - Born in other state (%) - Hispanic or Latino
Place of birth - Born in other state (%) - American Indian and Alaska Native
Place of birth - Born in other state (%) - Multirace
Place of birth - Born in other state (%) - Other Race
Place of birth - Native, outside of US (%)
Place of birth - Native, outside of US (%) - White
Place of birth - Native, outside of US (%) - Black or African American
Place of birth - Native, outside of US (%) - Asian
Place of birth - Native, outside of US (%) - Hispanic or Latino
Place of birth - Native, outside of US (%) - American Indian and Alaska Native
Place of birth - Native, outside of US (%) - Multirace
Place of birth - Native, outside of US (%) - Other Race
Place of birth - Foreign born (%)
Place of birth - Foreign born (%) - White
Place of birth - Foreign born (%) - Black or African American
Place of birth - Foreign born (%) - Asian
Place of birth - Foreign born (%) - Hispanic or Latino
Place of birth - Foreign born (%) - American Indian and Alaska Native
Place of birth - Foreign born (%) - Multirace
Place of birth - Foreign born (%) - Other Race
Residents speaking English at home (%)
Residents speaking English at home - Born in the United States (%)
Residents speaking English at home - Native, born elsewhere (%)
Residents speaking English at home - Foreign born (%)
Residents speaking Spanish at home (%)
Residents speaking Spanish at home - Born in the United States (%)
Residents speaking Spanish at home - Native, born elsewhere (%)
Residents speaking Spanish at home - Foreign born (%)
Residents speaking other language at home (%)
Residents speaking other language at home - Born in the United States (%)
Residents speaking other language at home - Native, born elsewhere (%)
Residents speaking other language at home - Foreign born (%)
Marital status - Never married (%)
Marital status - Now married (%)
Marital status - Separated (%)
Marital status - Widowed (%)
Marital status - Divorced (%)
Ancestries Reported - Arab (%)
Ancestries Reported - Czech (%)
Ancestries Reported - Danish (%)
Ancestries Reported - Dutch (%)
Ancestries Reported - English (%)
Ancestries Reported - French (%)
Ancestries Reported - French Canadian (%)
Ancestries Reported - German (%)
Ancestries Reported - Greek (%)
Ancestries Reported - Hungarian (%)
Ancestries Reported - Irish (%)
Ancestries Reported - Italian (%)
Ancestries Reported - Lithuanian (%)
Ancestries Reported - Norwegian (%)
Ancestries Reported - Polish (%)
Ancestries Reported - Portuguese (%)
Ancestries Reported - Russian (%)
Ancestries Reported - Scotch-Irish (%)
Ancestries Reported - Scottish (%)
Ancestries Reported - Slovak (%)
Ancestries Reported - Subsaharan African (%)
Ancestries Reported - Swedish (%)
Ancestries Reported - Swiss (%)
Ancestries Reported - Ukrainian (%)
Ancestries Reported - United States (%)
Ancestries Reported - Welsh (%)
Ancestries Reported - West Indian (%)
Ancestries Reported - Other (%)
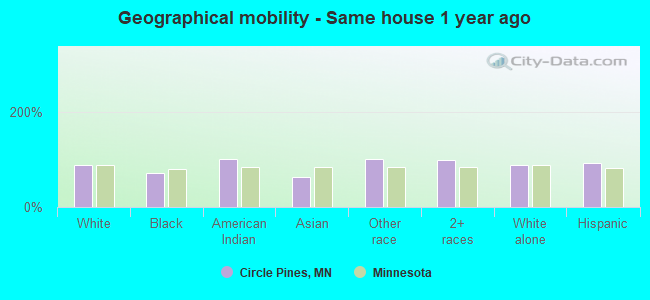
Geographical mobility - Same house 1 year ago (%)
Geographical mobility - Same house 1 year ago (%) - White
Geographical mobility - Same house 1 year ago (%) - Black or African American
Geographical mobility - Same house 1 year ago (%) - Asian
Geographical mobility - Same house 1 year ago (%) - Hispanic or Latino
Geographical mobility - Same house 1 year ago (%) - American Indian and Alaska Native
Geographical mobility - Same house 1 year ago (%) - Multirace
Geographical mobility - Same house 1 year ago (%) - Other Race
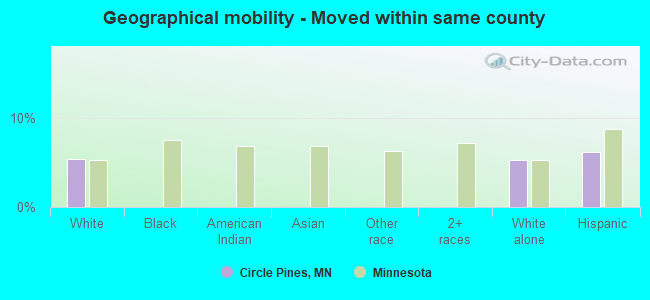
Geographical mobility - Moved within same county (%)
Geographical mobility - Moved within same county (%) - White
Geographical mobility - Moved within same county (%) - Black or African American
Geographical mobility - Moved within same county (%) - Asian
Geographical mobility - Moved within same county (%) - Hispanic or Latino
Geographical mobility - Moved within same county (%) - American Indian and Alaska Native
Geographical mobility - Moved within same county (%) - Multirace
Geographical mobility - Moved within same county (%) - Other Race
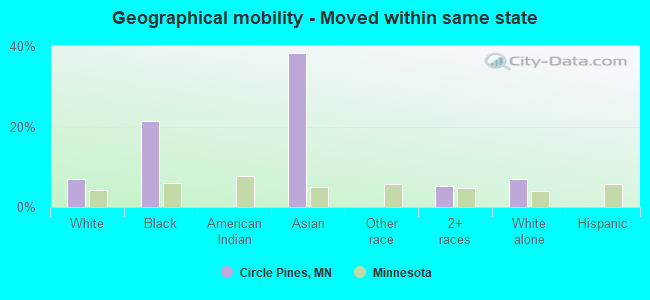
Geographical mobility - Moved from different county within same state (%)
Geographical mobility - Moved from different county within same state (%) - White
Geographical mobility - Moved from different county within same state (%) - Black or African American
Geographical mobility - Moved from different county within same state (%) - Asian
Geographical mobility - Moved from different county within same state (%) - Hispanic or Latino
Geographical mobility - Moved from different county within same state (%) - American Indian and Alaska Native
Geographical mobility - Moved from different county within same state (%) - Multirace
Geographical mobility - Moved from different county within same state (%) - Other Race
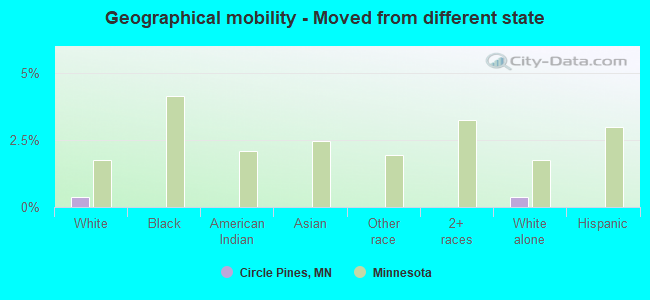
Geographical mobility - Moved from different state (%)
Geographical mobility - Moved from different state (%) - White
Geographical mobility - Moved from different state (%) - Black or African American
Geographical mobility - Moved from different state (%) - Asian
Geographical mobility - Moved from different state (%) - Hispanic or Latino
Geographical mobility - Moved from different state (%) - American Indian and Alaska Native
Geographical mobility - Moved from different state (%) - Multirace
Geographical mobility - Moved from different state (%) - Other Race
Geographical mobility - Moved from abroad (%)
Geographical mobility - Moved from abroad (%) - White
Geographical mobility - Moved from abroad (%) - Black or African American
Geographical mobility - Moved from abroad (%) - Asian
Geographical mobility - Moved from abroad (%) - Hispanic or Latino
Geographical mobility - Moved from abroad (%) - American Indian and Alaska Native
Geographical mobility - Moved from abroad (%) - Multirace
Geographical mobility - Moved from abroad (%) - Other Race
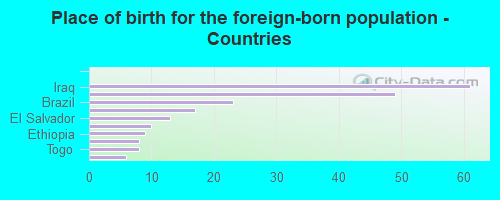
Place of birth for the foreign-born population - Ireland (%)
Place of birth for the foreign-born population - Denmark (%)
Place of birth for the foreign-born population - Norway (%)
Place of birth for the foreign-born population - Sweden (%)
Place of birth for the foreign-born population - United Kingdom (%)
Place of birth for the foreign-born population - England (%)
Place of birth for the foreign-born population - Scotland (%)
Place of birth for the foreign-born population - Other Northern Europe (%)
Place of birth for the foreign-born population - Austria (%)
Place of birth for the foreign-born population - Belgium (%)
Place of birth for the foreign-born population - France (%)
Place of birth for the foreign-born population - Germany (%)
Place of birth for the foreign-born population - Netherlands (%)
Place of birth for the foreign-born population - Switzerland (%)
Place of birth for the foreign-born population - Other Western Europe (%)
Place of birth for the foreign-born population - Greece (%)
Place of birth for the foreign-born population - Italy (%)
Place of birth for the foreign-born population - Portugal (%)
Place of birth for the foreign-born population - Spain (%)
Place of birth for the foreign-born population - Other Southern Europe (%)
Place of birth for the foreign-born population - Albania (%)
Place of birth for the foreign-born population - Belarus (%)
Place of birth for the foreign-born population - Bosnia and Herzegovina (%)
Place of birth for the foreign-born population - Bulgaria (%)
Place of birth for the foreign-born population - Croatia (%)
Place of birth for the foreign-born population - Czechoslovakia (%)
Place of birth for the foreign-born population - Hungary (%)
Place of birth for the foreign-born population - Latvia (%)
Place of birth for the foreign-born population - Lithuania (%)
Place of birth for the foreign-born population - North Macedonia (Macedonia) (%)
Place of birth for the foreign-born population - Moldova (%)
Place of birth for the foreign-born population - Poland (%)
Place of birth for the foreign-born population - Romania (%)
Place of birth for the foreign-born population - Russia (%)
Place of birth for the foreign-born population - Serbia (%)
Place of birth for the foreign-born population - Ukraine (%)
Place of birth for the foreign-born population - Other Eastern Europe (%)
Place of birth for the foreign-born population - China (%)
Place of birth for the foreign-born population - Hong Kong (%)
Place of birth for the foreign-born population - Taiwan (%)
Place of birth for the foreign-born population - Japan (%)
Place of birth for the foreign-born population - Korea (%)
Place of birth for the foreign-born population - Other Eastern Asia (%)
Place of birth for the foreign-born population - Afghanistan (%)
Place of birth for the foreign-born population - Bangladesh (%)
Place of birth for the foreign-born population - India (%)
Place of birth for the foreign-born population - Iran (%)
Place of birth for the foreign-born population - Kazakhstan (%)
Place of birth for the foreign-born population - Nepal (%)
Place of birth for the foreign-born population - Pakistan (%)
Place of birth for the foreign-born population - Sri Lanka (%)
Place of birth for the foreign-born population - Uzbekistan (%)
Place of birth for the foreign-born population - Other South Central Asia (%)
Place of birth for the foreign-born population - Burma (%)
Place of birth for the foreign-born population - Cambodia (%)
Place of birth for the foreign-born population - Indonesia (%)
Place of birth for the foreign-born population - Laos (%)
Place of birth for the foreign-born population - Malaysia (%)
Place of birth for the foreign-born population - Philippines (%)
Place of birth for the foreign-born population - Singapore (%)
Place of birth for the foreign-born population - Thailand (%)
Place of birth for the foreign-born population - Vietnam (%)
Place of birth for the foreign-born population - Other South Eastern Asia (%)
Place of birth for the foreign-born population - Armenia (%)
Place of birth for the foreign-born population - Iraq (%)
Place of birth for the foreign-born population - Israel (%)
Place of birth for the foreign-born population - Jordan (%)
Place of birth for the foreign-born population - Kuwait (%)
Place of birth for the foreign-born population - Lebanon (%)
Place of birth for the foreign-born population - Saudi Arabia (%)
Place of birth for the foreign-born population - Syria (%)
Place of birth for the foreign-born population - Turkey (%)
Place of birth for the foreign-born population - Yemen (%)
Place of birth for the foreign-born population - Other Western Asia (%)
Place of birth for the foreign-born population - Eritrea (%)
Place of birth for the foreign-born population - Ethiopia (%)
Place of birth for the foreign-born population - Kenya (%)
Place of birth for the foreign-born population - Somalia (%)
Place of birth for the foreign-born population - Uganda (%)
Place of birth for the foreign-born population - Zimbabwe (%)
Place of birth for the foreign-born population - Other Eastern Africa (%)
Place of birth for the foreign-born population - Cameroon (%)
Place of birth for the foreign-born population - Congo (%)
Place of birth for the foreign-born population - Democratic Republic of Congo (Zaire) (%)
Place of birth for the foreign-born population - Other Middle Africa (%)
Place of birth for the foreign-born population - Egypt (%)
Place of birth for the foreign-born population - Morocco (%)
Place of birth for the foreign-born population - Sudan (%)
Place of birth for the foreign-born population - Other Northern Africa (%)
Place of birth for the foreign-born population - South Africa (%)
Place of birth for the foreign-born population - Other Southern Africa (%)
Place of birth for the foreign-born population - Cabo Verde (%)
Place of birth for the foreign-born population - Ghana (%)
Place of birth for the foreign-born population - Liberia (%)
Place of birth for the foreign-born population - Nigeria (%)
Place of birth for the foreign-born population - Senegal (%)
Place of birth for the foreign-born population - Sierra Leone (%)
Place of birth for the foreign-born population - Other Western Africa (%)
Place of birth for the foreign-born population - Australia (%)
Place of birth for the foreign-born population - New Zealand (%)
Place of birth for the foreign-born population - Fiji (%)
Place of birth for the foreign-born population - Micronesia (%)
Place of birth for the foreign-born population - Bahamas (%)
Place of birth for the foreign-born population - Barbados (%)
Place of birth for the foreign-born population - Cuba (%)
Place of birth for the foreign-born population - Dominica (%)
Place of birth for the foreign-born population - Dominican Republic (%)
Place of birth for the foreign-born population - Grenada (%)
Place of birth for the foreign-born population - Haiti (%)
Place of birth for the foreign-born population - Jamaica (%)
Place of birth for the foreign-born population - St. Vincent and the Grenadines (%)
Place of birth for the foreign-born population - Trinidad and Tobago (%)
Place of birth for the foreign-born population - West Indies (%)
Place of birth for the foreign-born population - Other Caribbean (%)
Place of birth for the foreign-born population - Belize (%)
Place of birth for the foreign-born population - Costa Rica (%)
Place of birth for the foreign-born population - El Salvador (%)
Place of birth for the foreign-born population - Guatemala (%)
Place of birth for the foreign-born population - Honduras (%)
Place of birth for the foreign-born population - Mexico (%)
Place of birth for the foreign-born population - Nicaragua (%)
Place of birth for the foreign-born population - Panama (%)
Place of birth for the foreign-born population - Other Central America (%)
Place of birth for the foreign-born population - Argentina (%)
Place of birth for the foreign-born population - Bolivia (%)
Place of birth for the foreign-born population - Brazil (%)
Place of birth for the foreign-born population - Chile (%)
Place of birth for the foreign-born population - Colombia (%)
Place of birth for the foreign-born population - Ecuador (%)
Place of birth for the foreign-born population - Guyana (%)
Place of birth for the foreign-born population - Peru (%)
Place of birth for the foreign-born population - Uruguay (%)
Place of birth for the foreign-born population - Venezuela (%)
Place of birth for the foreign-born population - Other South America (%)
Place of birth for the foreign-born population - Canada (%)
Place of birth for the foreign-born population - Other Northern America (%)
Place of birth for the foreign-born population - Other (%)
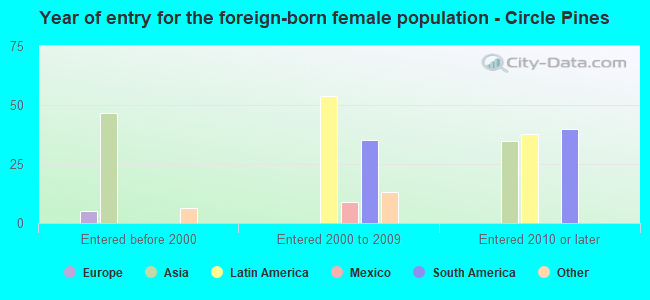
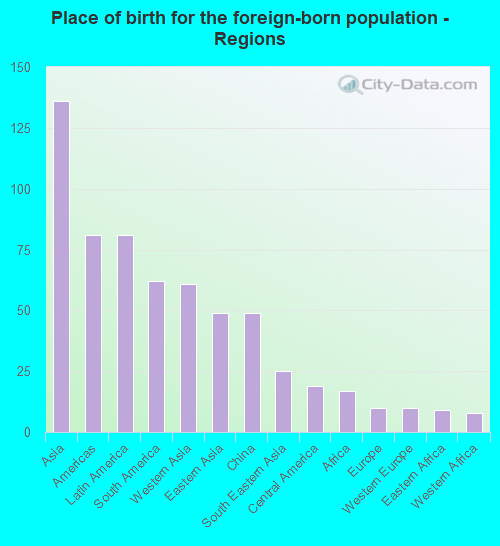
According to 2022 data, the most numerous races in Circle Pines, MN are White alone (4,325 residents), Black alone (67 residents), and Hispanic (175 residents). 90.1% of Circle Pines residents speak English at home. 4.9% of Circle Pines, MN residents are foreign-born (2.6% born in Asia, 1.6% born in Latin America), which is 64.7% less than the foreign-born rate of 8.0% across the entire state of Minnesota.
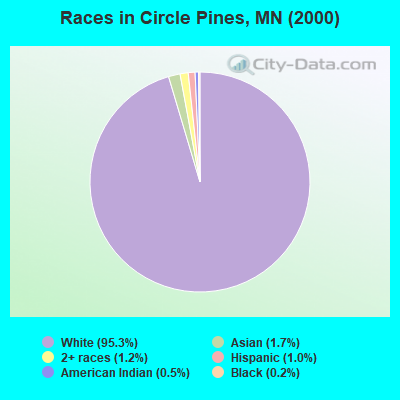
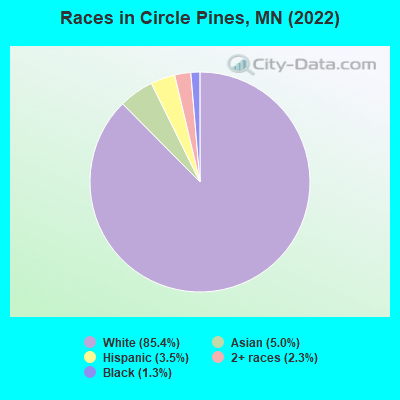
Race distribution in Circle Pines
2000 2022
4,337,143 88.2% White alone 168,813 3.4% Black alone 143,382 2.9% Hispanic 141,083 2.9% Asian alone 70,304 1.4% Two or more races 52,009 1.1% American Indian alone 5,031 0.1% Other race alone 1,714 0.03% Native Hawaiian and Other
4,356,347 76.2% White alone 395,179 6.9% Black alone 333,830 5.8% Hispanic 294,800 5.2% Asian alone 259,649 4.5% Two or more races 42,125 0.7% American Indian alone 32,976 0.6% Other race alone 2,278 0.04% Native Hawaiian and Other
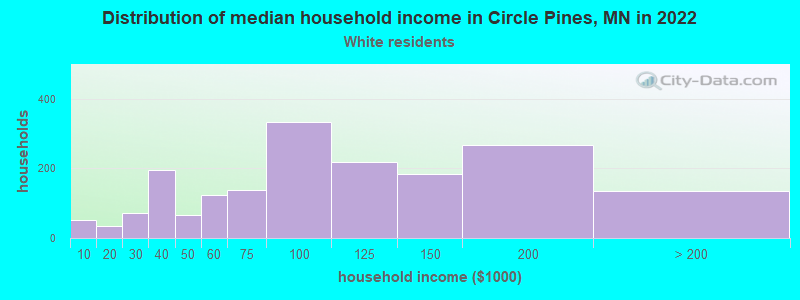
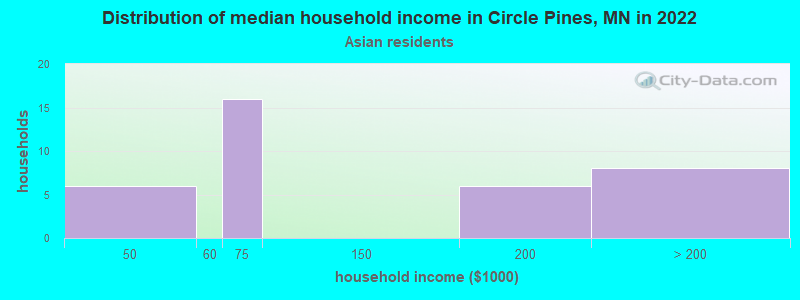
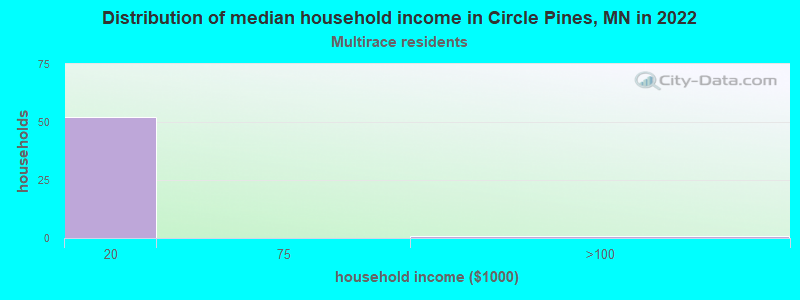
Income and house value in Circle Pines Median household income in 2022 $95,101 White non-Hispanic householdersMedian 2022 house value $277,660 White Non-Hispanic householders$179,987 Black or African American householders$389,972 American Indian or Alaska Native householders $539,961 Asian householders$839,940 Hispanic or Latino householders
Median age by race in Circle Pines
40.0 Median age for White residents37.6 42.3 31.5 Median age for Black or African American residents32.2 24.1 -915,392,455.8 Median age for American Indian / Alaska Native residents-783,968,718.7 -1,037,974,682.5 14.8 Median age for Asian residents14.1 26.5 -670,553,935.2 Median age for Native Hawaiian / Pacific Islander residents-670,553,935.2 -534,959,349.1 52.8 Median age for Other race residents49.2 36.5 23.2 Median age for Two or more races residents20.4 60.8 39.8 Median age for White alone residents37.7 41.8 29.4 Median age for Hispanic or Latino residents39.9 29.3
Owner/renter occupied households by race in Circle Pines
House owners and renters - White residents 1,451 79.8% Owner occupied368 20.2% Renter occupiedHouse owners and renters - Black or African American residents 11 100.0% Owner occupiedHouse owners and renters - American Indian / Alaska Native residents 4 100.0% Owner occupiedHouse owners and renters - Asian residents 33 79.3% Owner occupied9 20.7% Renter occupiedHouse owners and renters - Two or more races residents 2 4.5% Owner occupied37 95.5% Renter occupiedHouse owners and renters - White alone residents 1,462 79.7% Owner occupied373 20.3% Renter occupied
Language usage in Circle Pines
English speakers - Total 90.1% of residents of Circle Pines speak English at home.
1.7% of residents speak Spanish at home 26 32.5% Speak English very well54 67.5% Speak English less than very well6.8% of residents speak other language at home 179 54.9% Speak English very well147 45.1% Speak English less than very well
English speakers - Born in the United States 95.4% of residents of Circle Pines speak English at home.
1.7% of residents speak other language at home 21 100.0% Speak English very well
English speakers - Native, born elsewhere 88.2% of residents of Circle Pines speak English at home.
English speakers - Foreign-born 3.7% of residents of Circle Pines speak English at home.
23.1% of residents speak Spanish at home 24 38.1% Speak English very well39 61.9% Speak English less than very well74.0% of residents speak other language at home 94 46.5% Speak English very well108 53.5% Speak English less than very well
White (Caucasian) - Speak only English Native:
99.1% (3,901)Foreign-born:
9.9% (10)
White (Caucasian) - Speak another language Native:
0.5% (21)Foreign-born:
91.3% (94)
Asian - Speak another language Native:
85.3% (117)Foreign-born:
100.0% (77)
White alone - Speak only English Native:
99.0% (3,914)Foreign-born:
9.4% (11)
White alone - Speak another language Native:
0.6% (23)Foreign-born:
92.7% (111)
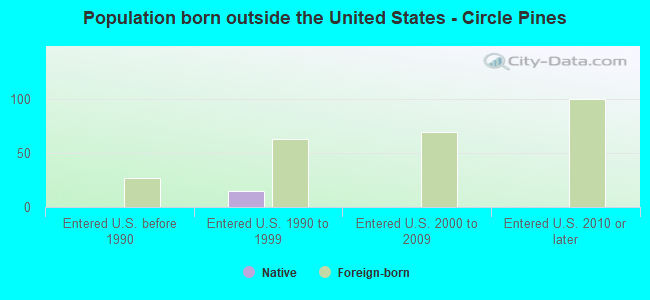
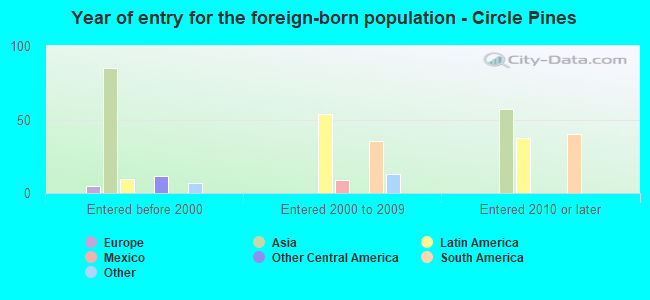
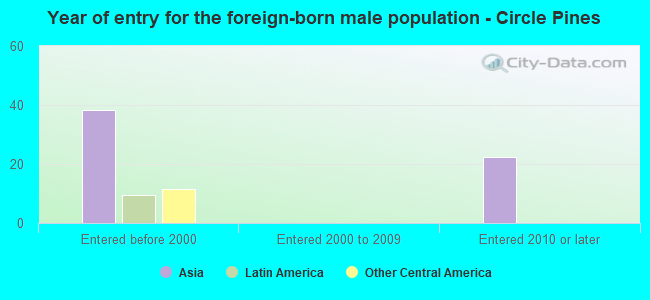
Foreign-born residents in Circle Pines 246 residents are foreign born (2.6% Asia , 1.6% Latin America ).
This city:
4.9%Minnesota:
8.5%
Marital status for residents in Circle Pines Marital status - White (Caucasian) population 15 years and over
Males 30.2% Never married56.3% Now married0.0% Separated2.5% Widowed11.1% DivorcedFemales 19.7% Never married55.8% Now married0.7% Separated10.4% Widowed13.4% DivorcedWomen who gave birth in the past 12 months Now married:
100.0% (47)Unmarried:
0.0% (0)
Women who did not give birth in the past 12 months Now married:
52.4% (445)Unmarried:
47.6% (405)
Marital status - Black or African American population 15 years and over
Males 100.0% Never married0.0% Now married0.0% Separated0.0% Widowed0.0% DivorcedFemales 63.6% Never married36.4% Now married0.0% Separated0.0% Widowed0.0% DivorcedWomen who did not give birth in the past 12 months Now married:
36.4% (9)Unmarried:
63.6% (15)
Marital status - American Indian / Alaska Native population 15 years and over
Males 0.0% Never married100.0% Now married0.0% Separated0.0% Widowed0.0% DivorcedFemales 100.0% Never married0.0% Now married0.0% Separated0.0% Widowed0.0% DivorcedWomen who did not give birth in the past 12 months Now married:
0.0% (0)Unmarried:
100.0% (1)
Marital status - Asian population 15 years and over
Males 54.8% Never married45.2% Now married0.0% Separated0.0% Widowed0.0% DivorcedFemales 11.1% Never married34.7% Now married0.0% Separated0.0% Widowed54.2% DivorcedWomen who gave birth in the past 12 months Now married:
0.0% (0)Unmarried:
100.0% (10)
Women who did not give birth in the past 12 months Now married:
61.3% (23)Unmarried:
38.7% (15)
Marital status - Other race population 15 years and over
Males 0.0% Never married0.0% Now married0.0% Separated0.0% Widowed100.0% DivorcedFemales 47.8% Never married52.2% Now married0.0% Separated0.0% Widowed0.0% DivorcedWomen who did not give birth in the past 12 months Now married:
12.2% (11)Unmarried:
87.8% (77)
Marital status - Two or more races population 15 years and over
Males 62.5% Never married37.5% Now married0.0% Separated0.0% Widowed0.0% DivorcedFemales 22.2% Never married0.0% Now married18.5% Separated1.9% Widowed57.4% DivorcedWomen who did not give birth in the past 12 months Now married:
0.0% (0)Unmarried:
100.0% (17)
Marital status - White alone, not Hispanic / Latino population 15 years and over
Males 30.2% Never married56.3% Now married0.0% Separated2.5% Widowed11.1% DivorcedFemales 19.7% Never married55.8% Now married0.7% Separated10.4% Widowed13.4% DivorcedWomen who gave birth in the past 12 months Now married:
100.0% (48)Unmarried:
0.0% (0)
Women who did not give birth in the past 12 months Now married:
52.4% (453)Unmarried:
47.6% (412)
Marital status - Hispanic or Latino population 15 years and over
Males 0.0% Never married58.1% Now married0.0% Separated0.0% Widowed41.9% DivorcedFemales 53.9% Never married46.1% Now married0.0% Separated0.0% Widowed0.0% DivorcedWomen who did not give birth in the past 12 months Now married:
9.8% (7)Unmarried:
90.2% (61)
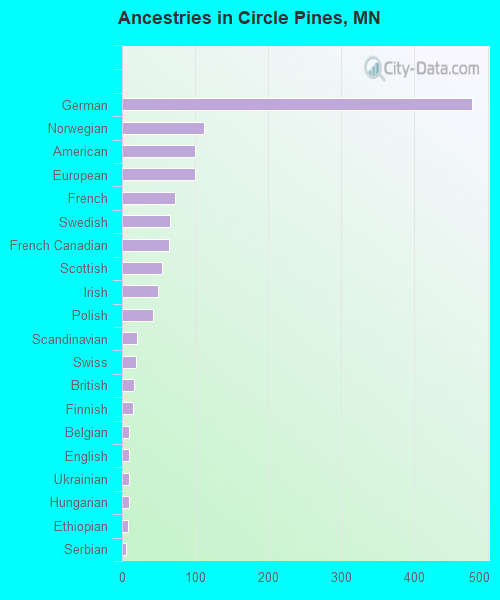
Ancestries in Circle Pines
478 25.5% German112 6.0% Norwegian100 5.3% American100 5.3% European72 3.8% French65 3.5% Swedish64 3.4% French Canadian55 2.9% Scottish49 2.6% Irish43 2.3% Polish21 1.1% Scandinavian19 1.0% Swiss17 0.9% British15 0.8% Finnish10 0.5% Belgian10 0.5% English10 0.5% Ukrainian9 0.5% Hungarian8 0.4% Ethiopian6 0.3% Serbian
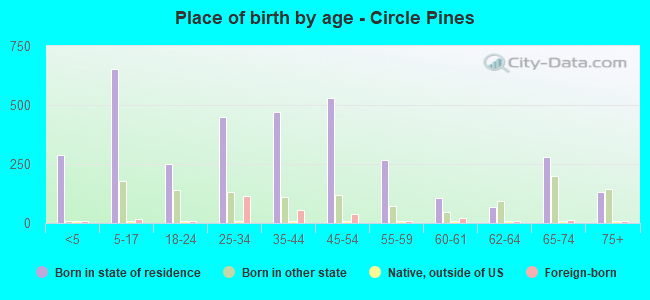
Children Nativity (place of birth) in Circle Pines
Children under 6 years - Living with two parents Both parents native 253 100.0% NativeBoth parents foreign-born 38 100.0% NativeOne native, one foreign-born parent 1 100.0% NativeChildren under 6 years - Living with one parent Native parent 115 100.0% NativeChildren 6 to 17 years - Living with two parents Both parents native 406 100.0% NativeBoth parents foreign-born 12 100.0% NativeOne native, one foreign-born parent 29 100.0% NativeChildren 6 to 17 years - Living with one parent Native parent 174 93.0% Native13 7.0% Foreign-bornForeign-born parent 19 100.0% Native
Grandparents responsible for own grandchildren in Circle Pines
Grandparents (30 to 59 years) White / Caucasian 25 100.0% Not responsible for grandchildrenWhite alone, not Hispanic / Latino 27 100.0% Not responsible for grandchildrenGrandparents (60 years and over) White / Caucasian 27 41.8% Responsible for grandchildren38 58.2% Not responsible for grandchildrenWhite alone, not Hispanic / Latino 27 41.8% Responsible for grandchildren38 58.2% Not responsible for grandchildren