Races in Chula Vista, Florida (FL) Detailed Stats
Ancestries, Foreign-born residents, place of birth

Recent posts about races in Chula Vista, Florida on our local forum with over 2,400,000 registered users:
 | Chula Vista, Ft. Lauderdale, anyone know the neighborhood? (6 replies) |
| Is Miami the new mecca of Latin American Culture? (61 replies) |
| Very detailed map of Miami-Dade neighborhoods - please give your feedback! (111 replies) |
| Interesting demographic shift... (48 replies) |
| Man sought in home invasion, robbery in Weston (40 replies) |
37.2% of Chula Vista, FL residents are foreign-born (37.2% born in Latin America), which is 43.5% greater than the foreign-born rate of 21.0% across the entire state of Florida.
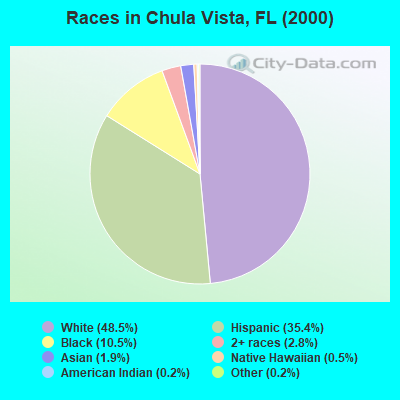
Race distribution in Chula Vista

- 27848.5%White alone
- 20335.4%Hispanic
- 6010.5%Black alone
- 162.8%Two or more races
- 111.9%Asian alone
- 30.5%Native Hawaiian and Other
Pacific Islander alone - 10.2%Other race alone
- 10.2%American Indian alone
2000
2022
-
- 10,458,50965.4%White alone
- 2,682,71516.8%Hispanic
- 2,264,26814.2%Black alone
- 261,6931.6%Asian alone
- 236,9541.5%Two or more races
- 42,3580.3%American Indian alone
- 28,9940.2%Other race alone
- 6,8870.04%Native Hawaiian and Other
Pacific Islander alone

-
- 11,309,40350.8%White alone
- 6,025,03927.1%Hispanic
- 3,241,01514.6%Black alone
- 861,6303.9%Two or more races
- 623,6922.8%Asian alone
- 152,0540.7%Other race alone
- 22,5040.1%American Indian alone
- 9,4860.04%Native Hawaiian and Other
Pacific Islander alone

Income and house value in Chula Vista
- Median household income in 2022
- $68,391White non-Hispanic householders
- $88,542American Indian and Alaska Native householders
- $70,507Some other race householders
- $45,113Two or more races householders
- $35,911Hispanic or Latino race householders
- Median 2022 house value
- $384,703White Non-Hispanic householders
- $287,378American Indian or Alaska Native householders
- $301,172Some other race householders
- $335,274Hispanic or Latino householders
Household income for White non-Hispanic householders

Household income for American Indian and Alaska Native householders

Household income for Two or more races householders

Household income for Hispanic or Latino race householders

Foreign-born residents in Chula Vista
213 residents are foreign born (37.2% Latin America).
| This city: | 37.2% |
| Florida: | 16.7% |
Ancestries in Chula Vista

- 18440.0%Other
- 7416.1%German
- 5311.5%Irish
- 255.4%French
- 204.3%United States
- 204.3%West Indian
- 163.5%English
- 163.5%Norwegian
- 153.3%Scotch-Irish
- 102.2%Portuguese
- 92.0%Arab
- 71.5%Italian
- 61.3%Russian
- 51.1%Czech

Zip codes: 33312.