Races in Christiansburg, Virginia (VA) Detailed Stats
Data:
Races - White alone (%)
Races - White alone (% change since 2000)
Races - Black alone (%)
Races - Black alone (% change since 2000)
Races - American Indian alone (%)
Races - American Indian alone (% change since 2000)
Races - Asian alone (%)
Races - Asian alone (% change since 2000)
Races - Hispanic (%)
Races - Hispanic (% change since 2000)
Races - Native Hawaiian and Other Pacific Islander alone (%)
Races - Native Hawaiian and Other Pacific Islander alone (% change since 2000)
Races - Two or more races(%)
Races - Two or more races(% change since 2000)
Races - Other race alone (%)
Races - Other race alone (% change since 2000)
Racial diversity
Place of birth - Born in state of residence (%)
Place of birth - Born in state of residence (%) - White
Place of birth - Born in state of residence (%) - Black or African American
Place of birth - Born in state of residence (%) - Asian
Place of birth - Born in state of residence (%) - Hispanic or Latino
Place of birth - Born in state of residence (%) - American Indian and Alaska Native
Place of birth - Born in state of residence (%) - Multirace
Place of birth - Born in state of residence (%) - Other Race
Place of birth - Born in other state (%)
Place of birth - Born in other state (%) - White
Place of birth - Born in other state (%) - Black or African American
Place of birth - Born in other state (%) - Asian
Place of birth - Born in other state (%) - Hispanic or Latino
Place of birth - Born in other state (%) - American Indian and Alaska Native
Place of birth - Born in other state (%) - Multirace
Place of birth - Born in other state (%) - Other Race
Place of birth - Native, outside of US (%)
Place of birth - Native, outside of US (%) - White
Place of birth - Native, outside of US (%) - Black or African American
Place of birth - Native, outside of US (%) - Asian
Place of birth - Native, outside of US (%) - Hispanic or Latino
Place of birth - Native, outside of US (%) - American Indian and Alaska Native
Place of birth - Native, outside of US (%) - Multirace
Place of birth - Native, outside of US (%) - Other Race
Place of birth - Foreign born (%)
Place of birth - Foreign born (%) - White
Place of birth - Foreign born (%) - Black or African American
Place of birth - Foreign born (%) - Asian
Place of birth - Foreign born (%) - Hispanic or Latino
Place of birth - Foreign born (%) - American Indian and Alaska Native
Place of birth - Foreign born (%) - Multirace
Place of birth - Foreign born (%) - Other Race
Residents speaking English at home (%)
Residents speaking English at home - Born in the United States (%)
Residents speaking English at home - Native, born elsewhere (%)
Residents speaking English at home - Foreign born (%)
Residents speaking Spanish at home (%)
Residents speaking Spanish at home - Born in the United States (%)
Residents speaking Spanish at home - Native, born elsewhere (%)
Residents speaking Spanish at home - Foreign born (%)
Residents speaking other language at home (%)
Residents speaking other language at home - Born in the United States (%)
Residents speaking other language at home - Native, born elsewhere (%)
Residents speaking other language at home - Foreign born (%)
Marital status - Never married (%)
Marital status - Now married (%)
Marital status - Separated (%)
Marital status - Widowed (%)
Marital status - Divorced (%)
Ancestries Reported - Arab (%)
Ancestries Reported - Czech (%)
Ancestries Reported - Danish (%)
Ancestries Reported - Dutch (%)
Ancestries Reported - English (%)
Ancestries Reported - French (%)
Ancestries Reported - French Canadian (%)
Ancestries Reported - German (%)
Ancestries Reported - Greek (%)
Ancestries Reported - Hungarian (%)
Ancestries Reported - Irish (%)
Ancestries Reported - Italian (%)
Ancestries Reported - Lithuanian (%)
Ancestries Reported - Norwegian (%)
Ancestries Reported - Polish (%)
Ancestries Reported - Portuguese (%)
Ancestries Reported - Russian (%)
Ancestries Reported - Scotch-Irish (%)
Ancestries Reported - Scottish (%)
Ancestries Reported - Slovak (%)
Ancestries Reported - Subsaharan African (%)
Ancestries Reported - Swedish (%)
Ancestries Reported - Swiss (%)
Ancestries Reported - Ukrainian (%)
Ancestries Reported - United States (%)
Ancestries Reported - Welsh (%)
Ancestries Reported - West Indian (%)
Ancestries Reported - Other (%)
Geographical mobility - Same house 1 year ago (%)
Geographical mobility - Same house 1 year ago (%) - White
Geographical mobility - Same house 1 year ago (%) - Black or African American
Geographical mobility - Same house 1 year ago (%) - Asian
Geographical mobility - Same house 1 year ago (%) - Hispanic or Latino
Geographical mobility - Same house 1 year ago (%) - American Indian and Alaska Native
Geographical mobility - Same house 1 year ago (%) - Multirace
Geographical mobility - Same house 1 year ago (%) - Other Race
Geographical mobility - Moved within same county (%)
Geographical mobility - Moved within same county (%) - White
Geographical mobility - Moved within same county (%) - Black or African American
Geographical mobility - Moved within same county (%) - Asian
Geographical mobility - Moved within same county (%) - Hispanic or Latino
Geographical mobility - Moved within same county (%) - American Indian and Alaska Native
Geographical mobility - Moved within same county (%) - Multirace
Geographical mobility - Moved within same county (%) - Other Race
Geographical mobility - Moved from different county within same state (%)
Geographical mobility - Moved from different county within same state (%) - White
Geographical mobility - Moved from different county within same state (%) - Black or African American
Geographical mobility - Moved from different county within same state (%) - Asian
Geographical mobility - Moved from different county within same state (%) - Hispanic or Latino
Geographical mobility - Moved from different county within same state (%) - American Indian and Alaska Native
Geographical mobility - Moved from different county within same state (%) - Multirace
Geographical mobility - Moved from different county within same state (%) - Other Race
Geographical mobility - Moved from different state (%)
Geographical mobility - Moved from different state (%) - White
Geographical mobility - Moved from different state (%) - Black or African American
Geographical mobility - Moved from different state (%) - Asian
Geographical mobility - Moved from different state (%) - Hispanic or Latino
Geographical mobility - Moved from different state (%) - American Indian and Alaska Native
Geographical mobility - Moved from different state (%) - Multirace
Geographical mobility - Moved from different state (%) - Other Race
Geographical mobility - Moved from abroad (%)
Geographical mobility - Moved from abroad (%) - White
Geographical mobility - Moved from abroad (%) - Black or African American
Geographical mobility - Moved from abroad (%) - Asian
Geographical mobility - Moved from abroad (%) - Hispanic or Latino
Geographical mobility - Moved from abroad (%) - American Indian and Alaska Native
Geographical mobility - Moved from abroad (%) - Multirace
Geographical mobility - Moved from abroad (%) - Other Race
Place of birth for the foreign-born population - Ireland (%)
Place of birth for the foreign-born population - Denmark (%)
Place of birth for the foreign-born population - Norway (%)
Place of birth for the foreign-born population - Sweden (%)
Place of birth for the foreign-born population - United Kingdom (%)
Place of birth for the foreign-born population - England (%)
Place of birth for the foreign-born population - Scotland (%)
Place of birth for the foreign-born population - Other Northern Europe (%)
Place of birth for the foreign-born population - Austria (%)
Place of birth for the foreign-born population - Belgium (%)
Place of birth for the foreign-born population - France (%)
Place of birth for the foreign-born population - Germany (%)
Place of birth for the foreign-born population - Netherlands (%)
Place of birth for the foreign-born population - Switzerland (%)
Place of birth for the foreign-born population - Other Western Europe (%)
Place of birth for the foreign-born population - Greece (%)
Place of birth for the foreign-born population - Italy (%)
Place of birth for the foreign-born population - Portugal (%)
Place of birth for the foreign-born population - Spain (%)
Place of birth for the foreign-born population - Other Southern Europe (%)
Place of birth for the foreign-born population - Albania (%)
Place of birth for the foreign-born population - Belarus (%)
Place of birth for the foreign-born population - Bosnia and Herzegovina (%)
Place of birth for the foreign-born population - Bulgaria (%)
Place of birth for the foreign-born population - Croatia (%)
Place of birth for the foreign-born population - Czechoslovakia (%)
Place of birth for the foreign-born population - Hungary (%)
Place of birth for the foreign-born population - Latvia (%)
Place of birth for the foreign-born population - Lithuania (%)
Place of birth for the foreign-born population - North Macedonia (Macedonia) (%)
Place of birth for the foreign-born population - Moldova (%)
Place of birth for the foreign-born population - Poland (%)
Place of birth for the foreign-born population - Romania (%)
Place of birth for the foreign-born population - Russia (%)
Place of birth for the foreign-born population - Serbia (%)
Place of birth for the foreign-born population - Ukraine (%)
Place of birth for the foreign-born population - Other Eastern Europe (%)
Place of birth for the foreign-born population - China (%)
Place of birth for the foreign-born population - Hong Kong (%)
Place of birth for the foreign-born population - Taiwan (%)
Place of birth for the foreign-born population - Japan (%)
Place of birth for the foreign-born population - Korea (%)
Place of birth for the foreign-born population - Other Eastern Asia (%)
Place of birth for the foreign-born population - Afghanistan (%)
Place of birth for the foreign-born population - Bangladesh (%)
Place of birth for the foreign-born population - India (%)
Place of birth for the foreign-born population - Iran (%)
Place of birth for the foreign-born population - Kazakhstan (%)
Place of birth for the foreign-born population - Nepal (%)
Place of birth for the foreign-born population - Pakistan (%)
Place of birth for the foreign-born population - Sri Lanka (%)
Place of birth for the foreign-born population - Uzbekistan (%)
Place of birth for the foreign-born population - Other South Central Asia (%)
Place of birth for the foreign-born population - Burma (%)
Place of birth for the foreign-born population - Cambodia (%)
Place of birth for the foreign-born population - Indonesia (%)
Place of birth for the foreign-born population - Laos (%)
Place of birth for the foreign-born population - Malaysia (%)
Place of birth for the foreign-born population - Philippines (%)
Place of birth for the foreign-born population - Singapore (%)
Place of birth for the foreign-born population - Thailand (%)
Place of birth for the foreign-born population - Vietnam (%)
Place of birth for the foreign-born population - Other South Eastern Asia (%)
Place of birth for the foreign-born population - Armenia (%)
Place of birth for the foreign-born population - Iraq (%)
Place of birth for the foreign-born population - Israel (%)
Place of birth for the foreign-born population - Jordan (%)
Place of birth for the foreign-born population - Kuwait (%)
Place of birth for the foreign-born population - Lebanon (%)
Place of birth for the foreign-born population - Saudi Arabia (%)
Place of birth for the foreign-born population - Syria (%)
Place of birth for the foreign-born population - Turkey (%)
Place of birth for the foreign-born population - Yemen (%)
Place of birth for the foreign-born population - Other Western Asia (%)
Place of birth for the foreign-born population - Eritrea (%)
Place of birth for the foreign-born population - Ethiopia (%)
Place of birth for the foreign-born population - Kenya (%)
Place of birth for the foreign-born population - Somalia (%)
Place of birth for the foreign-born population - Uganda (%)
Place of birth for the foreign-born population - Zimbabwe (%)
Place of birth for the foreign-born population - Other Eastern Africa (%)
Place of birth for the foreign-born population - Cameroon (%)
Place of birth for the foreign-born population - Congo (%)
Place of birth for the foreign-born population - Democratic Republic of Congo (Zaire) (%)
Place of birth for the foreign-born population - Other Middle Africa (%)
Place of birth for the foreign-born population - Egypt (%)
Place of birth for the foreign-born population - Morocco (%)
Place of birth for the foreign-born population - Sudan (%)
Place of birth for the foreign-born population - Other Northern Africa (%)
Place of birth for the foreign-born population - South Africa (%)
Place of birth for the foreign-born population - Other Southern Africa (%)
Place of birth for the foreign-born population - Cabo Verde (%)
Place of birth for the foreign-born population - Ghana (%)
Place of birth for the foreign-born population - Liberia (%)
Place of birth for the foreign-born population - Nigeria (%)
Place of birth for the foreign-born population - Senegal (%)
Place of birth for the foreign-born population - Sierra Leone (%)
Place of birth for the foreign-born population - Other Western Africa (%)
Place of birth for the foreign-born population - Australia (%)
Place of birth for the foreign-born population - New Zealand (%)
Place of birth for the foreign-born population - Fiji (%)
Place of birth for the foreign-born population - Micronesia (%)
Place of birth for the foreign-born population - Bahamas (%)
Place of birth for the foreign-born population - Barbados (%)
Place of birth for the foreign-born population - Cuba (%)
Place of birth for the foreign-born population - Dominica (%)
Place of birth for the foreign-born population - Dominican Republic (%)
Place of birth for the foreign-born population - Grenada (%)
Place of birth for the foreign-born population - Haiti (%)
Place of birth for the foreign-born population - Jamaica (%)
Place of birth for the foreign-born population - St. Vincent and the Grenadines (%)
Place of birth for the foreign-born population - Trinidad and Tobago (%)
Place of birth for the foreign-born population - West Indies (%)
Place of birth for the foreign-born population - Other Caribbean (%)
Place of birth for the foreign-born population - Belize (%)
Place of birth for the foreign-born population - Costa Rica (%)
Place of birth for the foreign-born population - El Salvador (%)
Place of birth for the foreign-born population - Guatemala (%)
Place of birth for the foreign-born population - Honduras (%)
Place of birth for the foreign-born population - Mexico (%)
Place of birth for the foreign-born population - Nicaragua (%)
Place of birth for the foreign-born population - Panama (%)
Place of birth for the foreign-born population - Other Central America (%)
Place of birth for the foreign-born population - Argentina (%)
Place of birth for the foreign-born population - Bolivia (%)
Place of birth for the foreign-born population - Brazil (%)
Place of birth for the foreign-born population - Chile (%)
Place of birth for the foreign-born population - Colombia (%)
Place of birth for the foreign-born population - Ecuador (%)
Place of birth for the foreign-born population - Guyana (%)
Place of birth for the foreign-born population - Peru (%)
Place of birth for the foreign-born population - Uruguay (%)
Place of birth for the foreign-born population - Venezuela (%)
Place of birth for the foreign-born population - Other South America (%)
Place of birth for the foreign-born population - Canada (%)
Place of birth for the foreign-born population - Other Northern America (%)
Place of birth for the foreign-born population - Other (%)
Latest news about races in Christiansburg, VA collected exclusively by city-data.com from local newspapers, TV, and radio stations
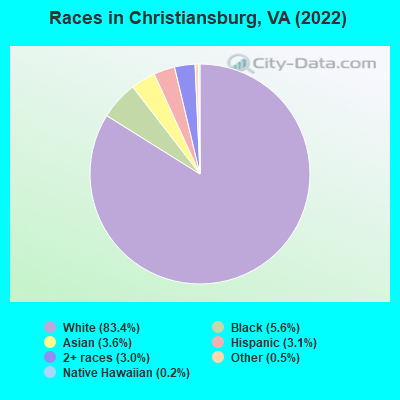
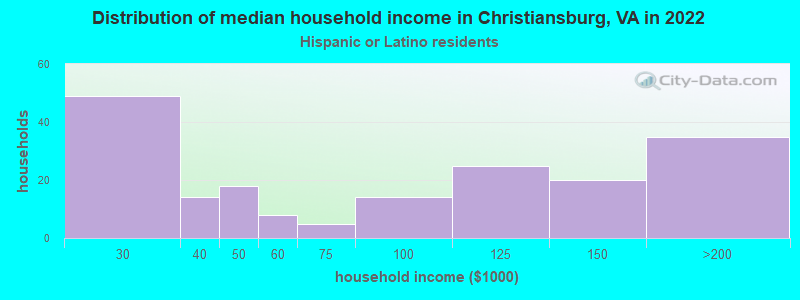
According to 2022 data, the most numerous races in Christiansburg, VA are White alone (19,055 residents), Black alone (1,287 residents), and Hispanic (712 residents). 91.4% of Christiansburg residents speak English at home. 5.7% of Christiansburg, VA residents are foreign-born (3.1% born in Asia, 1.3% born in Latin America), which is 108.8% less than the foreign-born rate of 12.0% across the entire state of Virginia.
Race distribution in Christiansburg
2000 2022
4,965,637 70.2% White alone 1,376,378 19.4% Black alone 329,540 4.7% Hispanic 259,277 3.7% Asian alone 114,022 1.6% Two or more races 18,596 0.3% American Indian alone 11,685 0.2% Other race alone 3,380 0.05% Native Hawaiian and Other
5,095,130 58.7% White alone 1,594,785 18.4% Black alone 905,750 10.4% Hispanic 602,881 6.9% Asian alone 406,047 4.7% Two or more races 60,419 0.7% Other race alone 11,738 0.1% American Indian alone 6,869 0.08% Native Hawaiian and Other
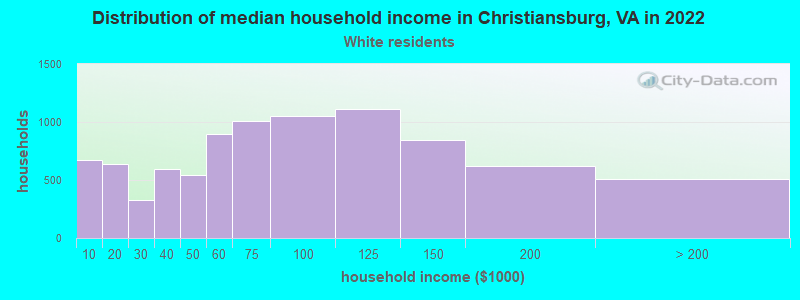
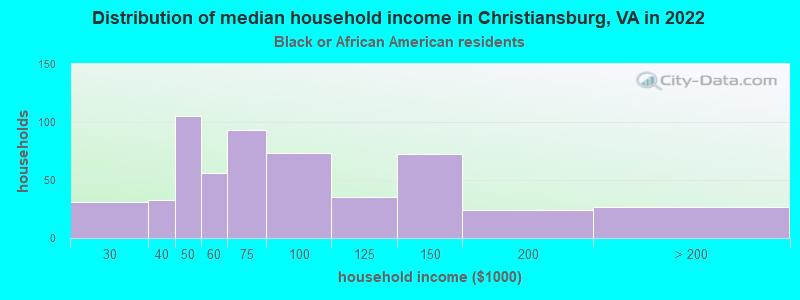
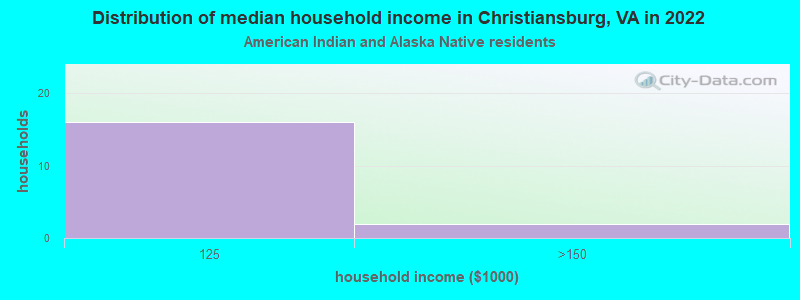
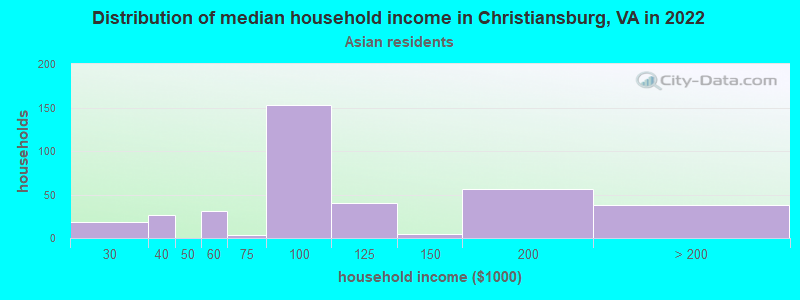
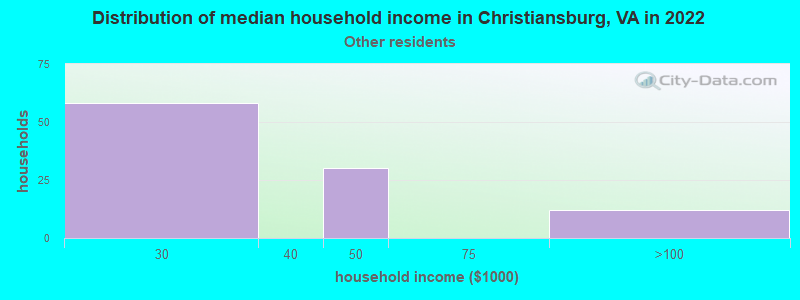
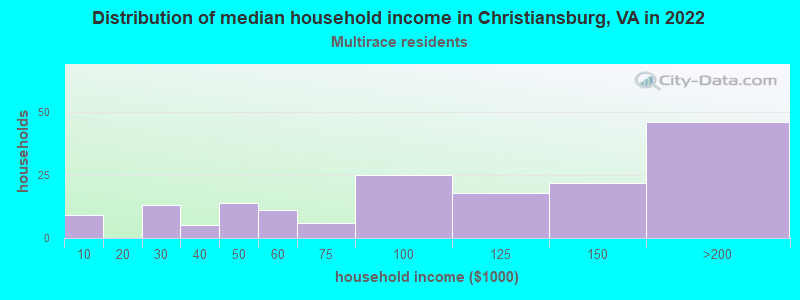
Income and house value in Christiansburg Median household income in 2022 $76,143 White non-Hispanic householders$65,244 Black householders$95,231 Asian householders$56,691 Some other race householders$88,439 Two or more races householdersMedian 2022 house value $283,090 White Non-Hispanic householders$271,399 Black or African American householders $452,332 Asian householders$264,440 Two or more races householders
Median age by race in Christiansburg
40.6 Median age for White residents40.5 40.4 44.0 Median age for Black or African American residents40.9 41.9 39.5 Median age for American Indian / Alaska Native residents-682,352,940.5 34.1 42.8 Median age for Asian residents47.8 40.9 -611,955,419.9 Median age for Native Hawaiian / Pacific Islander residents-666,666,666.0 -714,150,046.8 41.5 Median age for Other race residents42.8 35.2 26.9 Median age for Two or more races residents17.4 32.4 40.8 Median age for White alone residents41.1 40.1 31.2 Median age for Hispanic or Latino residents29.3 32.0
Owner/renter occupied households by race in Christiansburg
House owners and renters - White residents 5,945 67.2% Owner occupied2,904 32.8% Renter occupiedHouse owners and renters - Black or African American residents 137 25.6% Owner occupied399 74.4% Renter occupiedHouse owners and renters - American Indian / Alaska Native residents 12 78.3% Owner occupied3 21.7% Renter occupiedHouse owners and renters - Asian residents 179 67.0% Owner occupied88 33.0% Renter occupiedHouse owners and renters - Other race residents 75 79.3% Owner occupied19 20.7% Renter occupiedHouse owners and renters - Two or more races residents 32 17.9% Owner occupied147 82.1% Renter occupiedHouse owners and renters - White alone residents 5,952 67.3% Owner occupied2,889 32.7% Renter occupiedHouse owners and renters - Hispanic or Latino residents 74 60.2% Owner occupied49 39.8% Renter occupied
Language usage in Christiansburg
English speakers - Total 91.4% of residents of Christiansburg speak English at home.
2.0% of residents speak Spanish at home 212 48.2% Speak English very well228 51.8% Speak English less than very well5.9% of residents speak other language at home 976 75.6% Speak English very well315 24.4% Speak English less than very well
English speakers - Born in the United States 96.1% of residents of Christiansburg speak English at home.
1.1% of residents speak Spanish at home 59 79.7% Speak English very well15 20.3% Speak English less than very well3.0% of residents speak other language at home 156 77.6% Speak English very well45 22.4% Speak English less than very well
English speakers - Native, born elsewhere 92.5% of residents of Christiansburg speak English at home.
11.2% of residents speak Spanish at home 18 100.0% Speak English very well
English speakers - Foreign-born 12.3% of residents of Christiansburg speak English at home.
14.7% of residents speak Spanish at home 71 35.3% Speak English very well130 64.7% Speak English less than very well66.8% of residents speak other language at home 646 70.8% Speak English very well266 29.2% Speak English less than very well
White (Caucasian) - Speak only English Native:
98.4% (17,604)Foreign-born:
23.1% (77)
White (Caucasian) - Speak another language Native:
1.4% (245)Foreign-born:
80.2% (268)
Black or African American - Speak only English Native:
96.8% (1,170)Foreign-born:
89.0% (2)
American Indian / Alaska Native - Speak another language Native:
54.7% (13)Foreign-born:
100.0% (4)
Asian - Speak only English Native:
40.9% (119)Foreign-born:
9.2% (47)
Asian - Speak another language Native:
55.5% (162)Foreign-born:
84.9% (439)
Other race - Speak only English Native:
100.0% (64)Foreign-born:
4.4% (9)
Two or more races - Speak another language Native:
21.2% (188)Foreign-born:
100.0% (207)
White alone - Speak only English Native:
98.5% (17,489)Foreign-born:
21.6% (70)
White alone - Speak another language Native:
1.2% (217)Foreign-born:
83.7% (271)
Hispanic or Latino - Speak only English Native:
72.1% (299)Foreign-born:
2.5% (6)
Hispanic or Latino - Speak another language Native:
28.4% (118)Foreign-born:
100.0% (247)
Foreign-born residents in Christiansburg 1,313 residents are foreign born (3.1% Asia , 1.3% Latin America ).
This city:
5.7%Virginia:
12.6%
Marital status for residents in Christiansburg Marital status - White (Caucasian) population 15 years and over
Males 31.7% Never married55.7% Now married0.9% Separated2.5% Widowed9.1% DivorcedFemales 27.3% Never married48.9% Now married2.1% Separated8.0% Widowed13.7% DivorcedWomen who gave birth in the past 12 months Now married:
91.5% (73)Unmarried:
8.5% (7)
Women who did not give birth in the past 12 months Now married:
49.6% (2,332)Unmarried:
50.4% (2,374)
Marital status - Black or African American population 15 years and over
Males 40.5% Never married51.0% Now married0.0% Separated0.0% Widowed8.5% DivorcedFemales 34.4% Never married36.5% Now married5.2% Separated1.3% Widowed22.7% DivorcedWomen who did not give birth in the past 12 months Now married:
32.7% (63)Unmarried:
67.3% (130)
Marital status - American Indian / Alaska Native population 15 years and over
Males 21.4% Never married78.6% Now married0.0% Separated0.0% Widowed0.0% DivorcedFemales 100.0% Never married0.0% Now married0.0% Separated0.0% Widowed0.0% DivorcedWomen who did not give birth in the past 12 months Now married:
0.0% (0)Unmarried:
100.0% (14)
Marital status - Asian population 15 years and over
Males 13.4% Never married79.9% Now married0.0% Separated6.7% Widowed0.0% DivorcedFemales 12.1% Never married82.5% Now married0.0% Separated0.0% Widowed5.4% DivorcedWomen who gave birth in the past 12 months Now married:
100.0% (36)Unmarried:
0.0% (0)
Women who did not give birth in the past 12 months Now married:
68.9% (87)Unmarried:
31.1% (39)
Marital status - Native Hawaiian / Pacific Islander population 15 years and over
Males 100.0% Never married0.0% Now married0.0% Separated0.0% Widowed0.0% DivorcedFemales 0.0% Never married100.0% Now married0.0% Separated0.0% Widowed0.0% DivorcedWomen who did not give birth in the past 12 months Now married:
100.0% (42)Unmarried:
0.0% (0)
Marital status - Other race population 15 years and over
Males 2.8% Never married95.1% Now married0.0% Separated0.0% Widowed2.1% DivorcedFemales 13.6% Never married86.4% Now married0.0% Separated0.0% Widowed0.0% DivorcedWomen who did not give birth in the past 12 months Now married:
86.4% (75)Unmarried:
13.6% (12)
Marital status - Two or more races population 15 years and over
Males 47.4% Never married50.6% Now married0.0% Separated2.0% Widowed0.0% DivorcedFemales 29.7% Never married47.6% Now married0.0% Separated0.0% Widowed22.6% DivorcedWomen who did not give birth in the past 12 months Now married:
49.4% (172)Unmarried:
50.6% (176)
Marital status - White alone, not Hispanic / Latino population 15 years and over
Males 31.6% Never married55.8% Now married0.9% Separated2.5% Widowed9.1% DivorcedFemales 27.5% Never married49.0% Now married2.1% Separated8.1% Widowed13.3% DivorcedWomen who gave birth in the past 12 months Now married:
91.5% (73)Unmarried:
8.5% (7)
Women who did not give birth in the past 12 months Now married:
49.5% (2,311)Unmarried:
50.5% (2,359)
Marital status - Hispanic or Latino population 15 years and over
Males 30.6% Never married69.4% Now married0.0% Separated0.0% Widowed0.0% DivorcedFemales 13.6% Never married69.6% Now married0.0% Separated0.0% Widowed16.8% DivorcedWomen who did not give birth in the past 12 months Now married:
77.2% (190)Unmarried:
22.8% (56)
Ancestries in Christiansburg
3,432 28.6% American1,642 13.7% English1,309 10.9% German986 8.2% Irish625 5.2% European403 3.4% Italian204 1.7% Scottish126 1.0% Egyptian104 0.9% Scotch-Irish87 0.7% Polish85 0.7% African58 0.5% British52 0.4% Austrian50 0.4% Ukrainian30 0.2% Russian25 0.2% French23 0.2% Hungarian17 0.1% French Canadian16 0.1% Brazilian14 0.1% Dutch10 0.08% Canadian10 0.08% Northern European7 0.06% Norwegian6 0.05% Welsh4 0.03% Arab4 0.03% Iranian1 0.01% Afghan1 0.01% Ethiopian
Children Nativity (place of birth) in Christiansburg
Children under 6 years - Living with two parents Both parents native 914 100.0% NativeBoth parents foreign-born 4 100.0% NativeOne native, one foreign-born parent 62 100.0% NativeChildren under 6 years - Living with one parent Native parent 227 100.0% NativeChildren 6 to 17 years - Living with two parents Both parents native 2,013 100.0% NativeBoth parents foreign-born 166 89.7% Native19 10.3% Foreign-bornOne native, one foreign-born parent 310 100.0% NativeChildren 6 to 17 years - Living with one parent Native parent 695 100.0% Native
Grandparents responsible for own grandchildren in Christiansburg
Grandparents (30 to 59 years) White / Caucasian 57 85.3% Responsible for grandchildren10 14.7% Not responsible for grandchildrenWhite alone, not Hispanic / Latino 58 84.1% Responsible for grandchildren11 15.9% Not responsible for grandchildrenGrandparents (60 years and over) White / Caucasian 107 61.3% Responsible for grandchildren67 38.7% Not responsible for grandchildrenWhite alone, not Hispanic / Latino 109 60.4% Responsible for grandchildren71 39.6% Not responsible for grandchildren