Races in Christiana, Wisconsin (WI) Detailed Stats
Ancestries, Foreign-born residents, place of birth
4.4% of Christiana, WI residents are foreign-born (3.0% born in Latin America, 0.6% born in Europe, 0.5% born in Asia), which is 13.2% less than the foreign-born rate of 5.0% across the entire state of Wisconsin.
Race distribution in Christiana

- 1,25095.2%White alone
- 302.3%Hispanic
- 181.4%Asian alone
- 120.9%Two or more races
- 20.2%Black alone
- 10.08%American Indian alone

2000
2022
-
- 4,681,63087.3%White alone
- 300,2455.6%Black alone
- 192,9213.6%Hispanic
- 87,9951.6%Asian alone
- 51,9211.0%Two or more races
- 43,9800.8%American Indian alone
- 3,6370.07%Other race alone
- 1,3460.03%Native Hawaiian and Other
Pacific Islander alone

-
- 4,654,03179.0%White alone
- 447,0227.6%Hispanic
- 345,6785.9%Black alone
- 217,5323.7%Two or more races
- 172,2422.9%Asian alone
- 33,7620.6%American Indian alone
- 19,6800.3%Other race alone
- 2,5920.04%Native Hawaiian and Other
Pacific Islander alone

Income and house value in Christiana
- Median household income in 2022
- $97,756White non-Hispanic householders
- $85,702Some other race householders
- $110,388Two or more races householders
- $96,534Hispanic or Latino race householders
- Median 2022 house value
- $375,538White Non-Hispanic householders
Household income for White non-Hispanic householders

Household income for Two or more races householders

Household income for Hispanic or Latino race householders

Foreign-born residents in Christiana
58 residents are foreign born (3.0% Latin America, 0.6% Europe, 0.5% Asia).
| This city: | 4.4% |
| Wisconsin: | 3.6% |
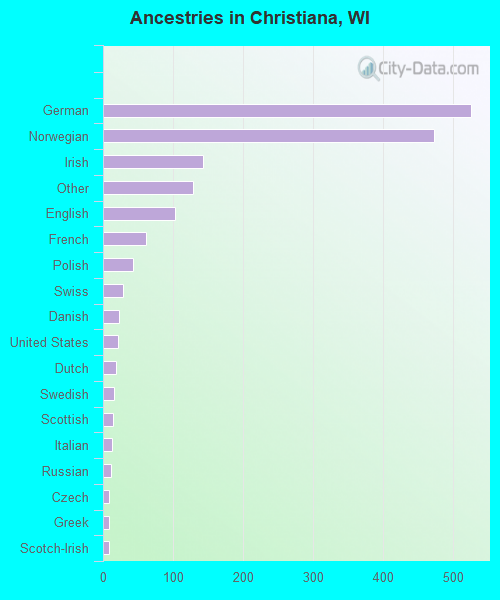
Ancestries in Christiana

- 52531.7%German
- 47228.5%Norwegian
- 1438.6%Irish
- 1297.8%Other
- 1036.2%English
- 623.7%French
- 432.6%Polish
- 281.7%Swiss
- 231.4%Danish
- 221.3%United States
- 191.1%Dutch
- 161.0%Swedish
- 140.8%Scottish
- 130.8%Italian
- 120.7%Russian
- 90.5%Czech
- 80.5%Greek
- 80.5%Scotch-Irish
- 20.1%Lithuanian
- 20.1%Welsh
- 10.06%Portuguese