Races in Chicago Ridge, Illinois (IL) Detailed Stats
Data:
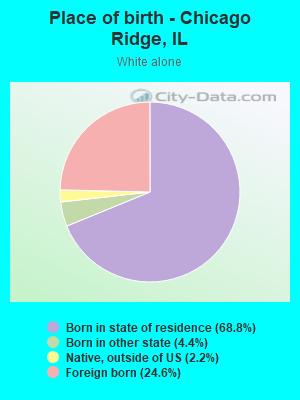
Races - White alone (%)
Races - White alone (% change since 2000)
Races - Black alone (%)
Races - Black alone (% change since 2000)
Races - American Indian alone (%)
Races - American Indian alone (% change since 2000)
Races - Asian alone (%)
Races - Asian alone (% change since 2000)
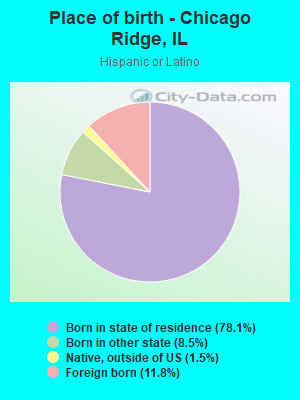
Races - Hispanic (%)
Races - Hispanic (% change since 2000)
Races - Native Hawaiian and Other Pacific Islander alone (%)
Races - Native Hawaiian and Other Pacific Islander alone (% change since 2000)
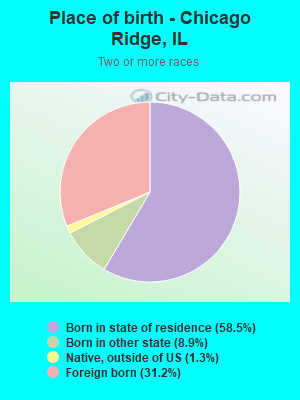
Races - Two or more races(%)
Races - Two or more races(% change since 2000)
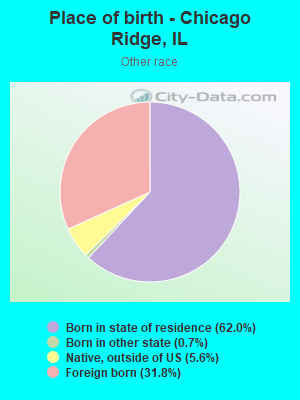
Races - Other race alone (%)
Races - Other race alone (% change since 2000)
Racial diversity
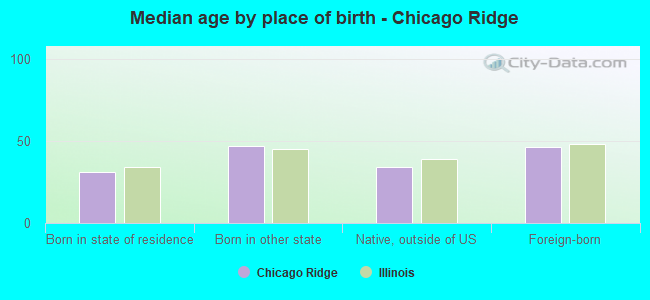
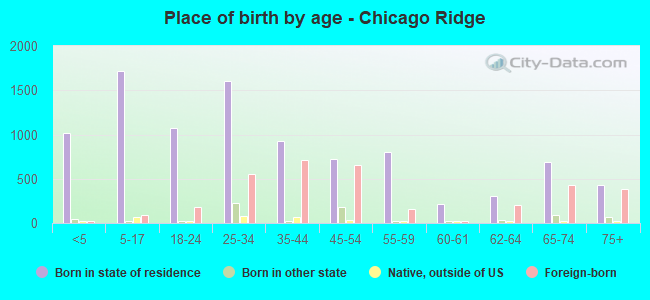
Place of birth - Born in state of residence (%)
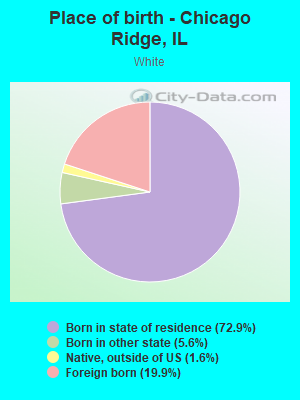
Place of birth - Born in state of residence (%) - White
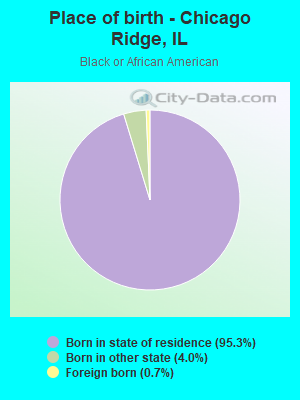
Place of birth - Born in state of residence (%) - Black or African American
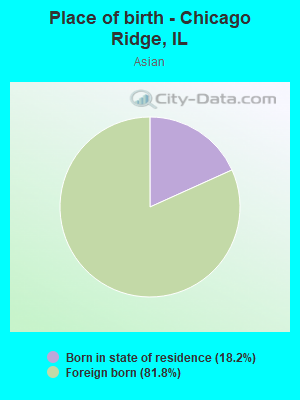
Place of birth - Born in state of residence (%) - Asian
Place of birth - Born in state of residence (%) - Hispanic or Latino
Place of birth - Born in state of residence (%) - American Indian and Alaska Native
Place of birth - Born in state of residence (%) - Multirace
Place of birth - Born in state of residence (%) - Other Race
Place of birth - Born in other state (%)
Place of birth - Born in other state (%) - White
Place of birth - Born in other state (%) - Black or African American
Place of birth - Born in other state (%) - Asian
Place of birth - Born in other state (%) - Hispanic or Latino
Place of birth - Born in other state (%) - American Indian and Alaska Native
Place of birth - Born in other state (%) - Multirace
Place of birth - Born in other state (%) - Other Race
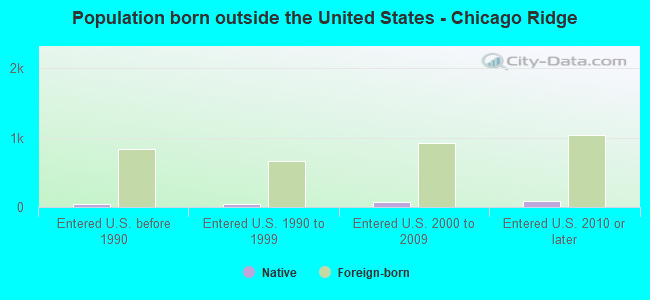
Place of birth - Native, outside of US (%)
Place of birth - Native, outside of US (%) - White
Place of birth - Native, outside of US (%) - Black or African American
Place of birth - Native, outside of US (%) - Asian
Place of birth - Native, outside of US (%) - Hispanic or Latino
Place of birth - Native, outside of US (%) - American Indian and Alaska Native
Place of birth - Native, outside of US (%) - Multirace
Place of birth - Native, outside of US (%) - Other Race
Place of birth - Foreign born (%)
Place of birth - Foreign born (%) - White
Place of birth - Foreign born (%) - Black or African American
Place of birth - Foreign born (%) - Asian
Place of birth - Foreign born (%) - Hispanic or Latino
Place of birth - Foreign born (%) - American Indian and Alaska Native
Place of birth - Foreign born (%) - Multirace
Place of birth - Foreign born (%) - Other Race
Residents speaking English at home (%)
Residents speaking English at home - Born in the United States (%)
Residents speaking English at home - Native, born elsewhere (%)
Residents speaking English at home - Foreign born (%)
Residents speaking Spanish at home (%)
Residents speaking Spanish at home - Born in the United States (%)
Residents speaking Spanish at home - Native, born elsewhere (%)
Residents speaking Spanish at home - Foreign born (%)
Residents speaking other language at home (%)
Residents speaking other language at home - Born in the United States (%)
Residents speaking other language at home - Native, born elsewhere (%)
Residents speaking other language at home - Foreign born (%)
Marital status - Never married (%)
Marital status - Now married (%)
Marital status - Separated (%)
Marital status - Widowed (%)
Marital status - Divorced (%)
Ancestries Reported - Arab (%)
Ancestries Reported - Czech (%)
Ancestries Reported - Danish (%)
Ancestries Reported - Dutch (%)
Ancestries Reported - English (%)
Ancestries Reported - French (%)
Ancestries Reported - French Canadian (%)
Ancestries Reported - German (%)
Ancestries Reported - Greek (%)
Ancestries Reported - Hungarian (%)
Ancestries Reported - Irish (%)
Ancestries Reported - Italian (%)
Ancestries Reported - Lithuanian (%)
Ancestries Reported - Norwegian (%)
Ancestries Reported - Polish (%)
Ancestries Reported - Portuguese (%)
Ancestries Reported - Russian (%)
Ancestries Reported - Scotch-Irish (%)
Ancestries Reported - Scottish (%)
Ancestries Reported - Slovak (%)
Ancestries Reported - Subsaharan African (%)
Ancestries Reported - Swedish (%)
Ancestries Reported - Swiss (%)
Ancestries Reported - Ukrainian (%)
Ancestries Reported - United States (%)
Ancestries Reported - Welsh (%)
Ancestries Reported - West Indian (%)
Ancestries Reported - Other (%)
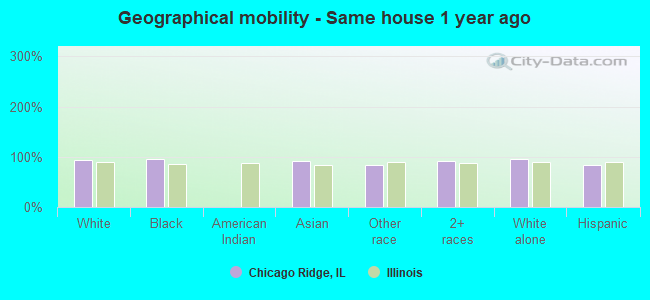
Geographical mobility - Same house 1 year ago (%)
Geographical mobility - Same house 1 year ago (%) - White
Geographical mobility - Same house 1 year ago (%) - Black or African American
Geographical mobility - Same house 1 year ago (%) - Asian
Geographical mobility - Same house 1 year ago (%) - Hispanic or Latino
Geographical mobility - Same house 1 year ago (%) - American Indian and Alaska Native
Geographical mobility - Same house 1 year ago (%) - Multirace
Geographical mobility - Same house 1 year ago (%) - Other Race
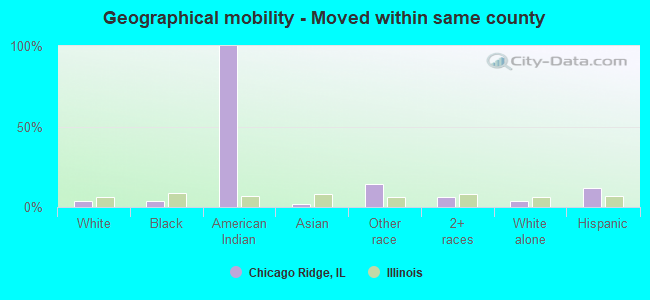
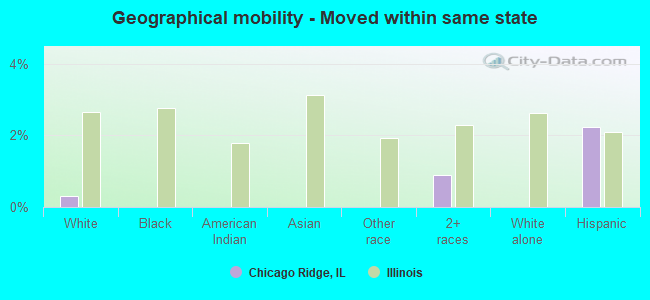
Geographical mobility - Moved within same county (%)
Geographical mobility - Moved within same county (%) - White
Geographical mobility - Moved within same county (%) - Black or African American
Geographical mobility - Moved within same county (%) - Asian
Geographical mobility - Moved within same county (%) - Hispanic or Latino
Geographical mobility - Moved within same county (%) - American Indian and Alaska Native
Geographical mobility - Moved within same county (%) - Multirace
Geographical mobility - Moved within same county (%) - Other Race
Geographical mobility - Moved from different county within same state (%)
Geographical mobility - Moved from different county within same state (%) - White
Geographical mobility - Moved from different county within same state (%) - Black or African American
Geographical mobility - Moved from different county within same state (%) - Asian
Geographical mobility - Moved from different county within same state (%) - Hispanic or Latino
Geographical mobility - Moved from different county within same state (%) - American Indian and Alaska Native
Geographical mobility - Moved from different county within same state (%) - Multirace
Geographical mobility - Moved from different county within same state (%) - Other Race
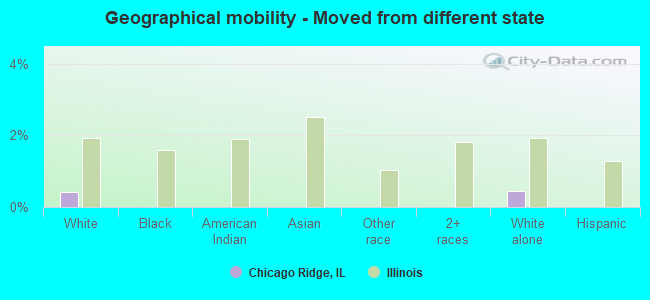
Geographical mobility - Moved from different state (%)
Geographical mobility - Moved from different state (%) - White
Geographical mobility - Moved from different state (%) - Black or African American
Geographical mobility - Moved from different state (%) - Asian
Geographical mobility - Moved from different state (%) - Hispanic or Latino
Geographical mobility - Moved from different state (%) - American Indian and Alaska Native
Geographical mobility - Moved from different state (%) - Multirace
Geographical mobility - Moved from different state (%) - Other Race
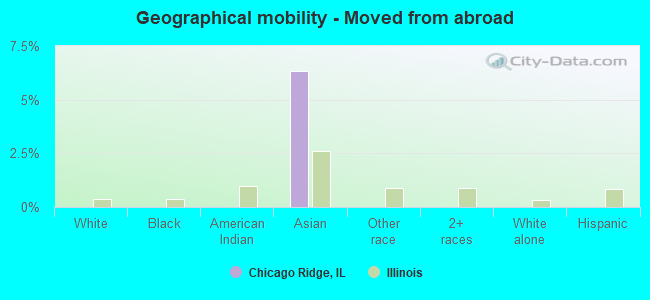
Geographical mobility - Moved from abroad (%)
Geographical mobility - Moved from abroad (%) - White
Geographical mobility - Moved from abroad (%) - Black or African American
Geographical mobility - Moved from abroad (%) - Asian
Geographical mobility - Moved from abroad (%) - Hispanic or Latino
Geographical mobility - Moved from abroad (%) - American Indian and Alaska Native
Geographical mobility - Moved from abroad (%) - Multirace
Geographical mobility - Moved from abroad (%) - Other Race
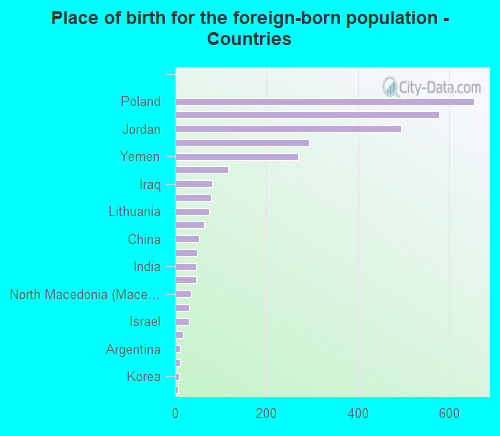
Place of birth for the foreign-born population - Ireland (%)
Place of birth for the foreign-born population - Denmark (%)
Place of birth for the foreign-born population - Norway (%)
Place of birth for the foreign-born population - Sweden (%)
Place of birth for the foreign-born population - United Kingdom (%)
Place of birth for the foreign-born population - England (%)
Place of birth for the foreign-born population - Scotland (%)
Place of birth for the foreign-born population - Other Northern Europe (%)
Place of birth for the foreign-born population - Austria (%)
Place of birth for the foreign-born population - Belgium (%)
Place of birth for the foreign-born population - France (%)
Place of birth for the foreign-born population - Germany (%)
Place of birth for the foreign-born population - Netherlands (%)
Place of birth for the foreign-born population - Switzerland (%)
Place of birth for the foreign-born population - Other Western Europe (%)
Place of birth for the foreign-born population - Greece (%)
Place of birth for the foreign-born population - Italy (%)
Place of birth for the foreign-born population - Portugal (%)
Place of birth for the foreign-born population - Spain (%)
Place of birth for the foreign-born population - Other Southern Europe (%)
Place of birth for the foreign-born population - Albania (%)
Place of birth for the foreign-born population - Belarus (%)
Place of birth for the foreign-born population - Bosnia and Herzegovina (%)
Place of birth for the foreign-born population - Bulgaria (%)
Place of birth for the foreign-born population - Croatia (%)
Place of birth for the foreign-born population - Czechoslovakia (%)
Place of birth for the foreign-born population - Hungary (%)
Place of birth for the foreign-born population - Latvia (%)
Place of birth for the foreign-born population - Lithuania (%)
Place of birth for the foreign-born population - North Macedonia (Macedonia) (%)
Place of birth for the foreign-born population - Moldova (%)
Place of birth for the foreign-born population - Poland (%)
Place of birth for the foreign-born population - Romania (%)
Place of birth for the foreign-born population - Russia (%)
Place of birth for the foreign-born population - Serbia (%)
Place of birth for the foreign-born population - Ukraine (%)
Place of birth for the foreign-born population - Other Eastern Europe (%)
Place of birth for the foreign-born population - China (%)
Place of birth for the foreign-born population - Hong Kong (%)
Place of birth for the foreign-born population - Taiwan (%)
Place of birth for the foreign-born population - Japan (%)
Place of birth for the foreign-born population - Korea (%)
Place of birth for the foreign-born population - Other Eastern Asia (%)
Place of birth for the foreign-born population - Afghanistan (%)
Place of birth for the foreign-born population - Bangladesh (%)
Place of birth for the foreign-born population - India (%)
Place of birth for the foreign-born population - Iran (%)
Place of birth for the foreign-born population - Kazakhstan (%)
Place of birth for the foreign-born population - Nepal (%)
Place of birth for the foreign-born population - Pakistan (%)
Place of birth for the foreign-born population - Sri Lanka (%)
Place of birth for the foreign-born population - Uzbekistan (%)
Place of birth for the foreign-born population - Other South Central Asia (%)
Place of birth for the foreign-born population - Burma (%)
Place of birth for the foreign-born population - Cambodia (%)
Place of birth for the foreign-born population - Indonesia (%)
Place of birth for the foreign-born population - Laos (%)
Place of birth for the foreign-born population - Malaysia (%)
Place of birth for the foreign-born population - Philippines (%)
Place of birth for the foreign-born population - Singapore (%)
Place of birth for the foreign-born population - Thailand (%)
Place of birth for the foreign-born population - Vietnam (%)
Place of birth for the foreign-born population - Other South Eastern Asia (%)
Place of birth for the foreign-born population - Armenia (%)
Place of birth for the foreign-born population - Iraq (%)
Place of birth for the foreign-born population - Israel (%)
Place of birth for the foreign-born population - Jordan (%)
Place of birth for the foreign-born population - Kuwait (%)
Place of birth for the foreign-born population - Lebanon (%)
Place of birth for the foreign-born population - Saudi Arabia (%)
Place of birth for the foreign-born population - Syria (%)
Place of birth for the foreign-born population - Turkey (%)
Place of birth for the foreign-born population - Yemen (%)
Place of birth for the foreign-born population - Other Western Asia (%)
Place of birth for the foreign-born population - Eritrea (%)
Place of birth for the foreign-born population - Ethiopia (%)
Place of birth for the foreign-born population - Kenya (%)
Place of birth for the foreign-born population - Somalia (%)
Place of birth for the foreign-born population - Uganda (%)
Place of birth for the foreign-born population - Zimbabwe (%)
Place of birth for the foreign-born population - Other Eastern Africa (%)
Place of birth for the foreign-born population - Cameroon (%)
Place of birth for the foreign-born population - Congo (%)
Place of birth for the foreign-born population - Democratic Republic of Congo (Zaire) (%)
Place of birth for the foreign-born population - Other Middle Africa (%)
Place of birth for the foreign-born population - Egypt (%)
Place of birth for the foreign-born population - Morocco (%)
Place of birth for the foreign-born population - Sudan (%)
Place of birth for the foreign-born population - Other Northern Africa (%)
Place of birth for the foreign-born population - South Africa (%)
Place of birth for the foreign-born population - Other Southern Africa (%)
Place of birth for the foreign-born population - Cabo Verde (%)
Place of birth for the foreign-born population - Ghana (%)
Place of birth for the foreign-born population - Liberia (%)
Place of birth for the foreign-born population - Nigeria (%)
Place of birth for the foreign-born population - Senegal (%)
Place of birth for the foreign-born population - Sierra Leone (%)
Place of birth for the foreign-born population - Other Western Africa (%)
Place of birth for the foreign-born population - Australia (%)
Place of birth for the foreign-born population - New Zealand (%)
Place of birth for the foreign-born population - Fiji (%)
Place of birth for the foreign-born population - Micronesia (%)
Place of birth for the foreign-born population - Bahamas (%)
Place of birth for the foreign-born population - Barbados (%)
Place of birth for the foreign-born population - Cuba (%)
Place of birth for the foreign-born population - Dominica (%)
Place of birth for the foreign-born population - Dominican Republic (%)
Place of birth for the foreign-born population - Grenada (%)
Place of birth for the foreign-born population - Haiti (%)
Place of birth for the foreign-born population - Jamaica (%)
Place of birth for the foreign-born population - St. Vincent and the Grenadines (%)
Place of birth for the foreign-born population - Trinidad and Tobago (%)
Place of birth for the foreign-born population - West Indies (%)
Place of birth for the foreign-born population - Other Caribbean (%)
Place of birth for the foreign-born population - Belize (%)
Place of birth for the foreign-born population - Costa Rica (%)
Place of birth for the foreign-born population - El Salvador (%)
Place of birth for the foreign-born population - Guatemala (%)
Place of birth for the foreign-born population - Honduras (%)
Place of birth for the foreign-born population - Mexico (%)
Place of birth for the foreign-born population - Nicaragua (%)
Place of birth for the foreign-born population - Panama (%)
Place of birth for the foreign-born population - Other Central America (%)
Place of birth for the foreign-born population - Argentina (%)
Place of birth for the foreign-born population - Bolivia (%)
Place of birth for the foreign-born population - Brazil (%)
Place of birth for the foreign-born population - Chile (%)
Place of birth for the foreign-born population - Colombia (%)
Place of birth for the foreign-born population - Ecuador (%)
Place of birth for the foreign-born population - Guyana (%)
Place of birth for the foreign-born population - Peru (%)
Place of birth for the foreign-born population - Uruguay (%)
Place of birth for the foreign-born population - Venezuela (%)
Place of birth for the foreign-born population - Other South America (%)
Place of birth for the foreign-born population - Canada (%)
Place of birth for the foreign-born population - Other Northern America (%)
Place of birth for the foreign-born population - Other (%)
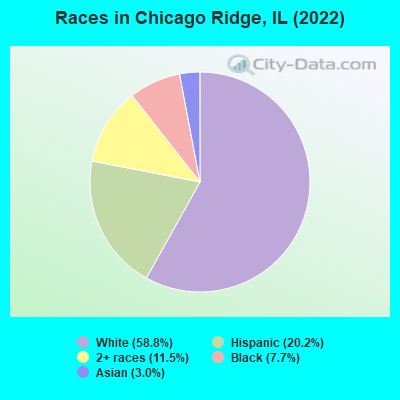
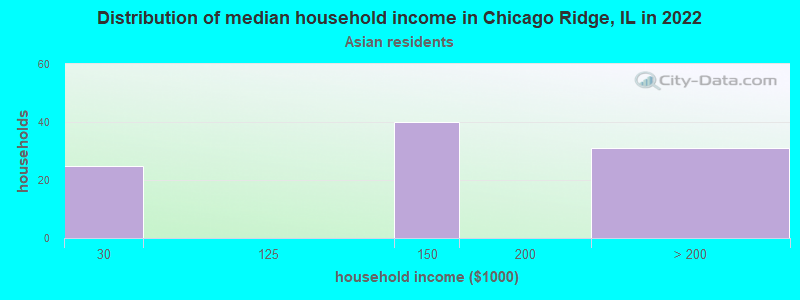
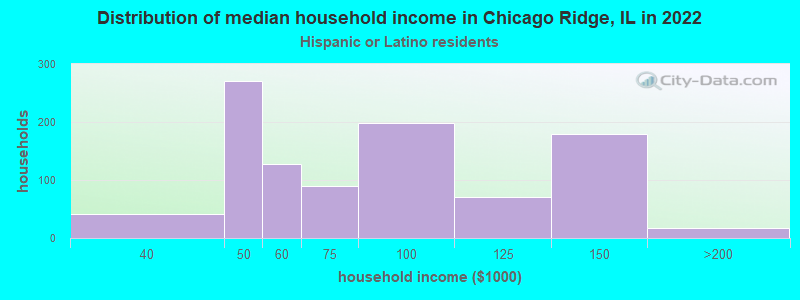
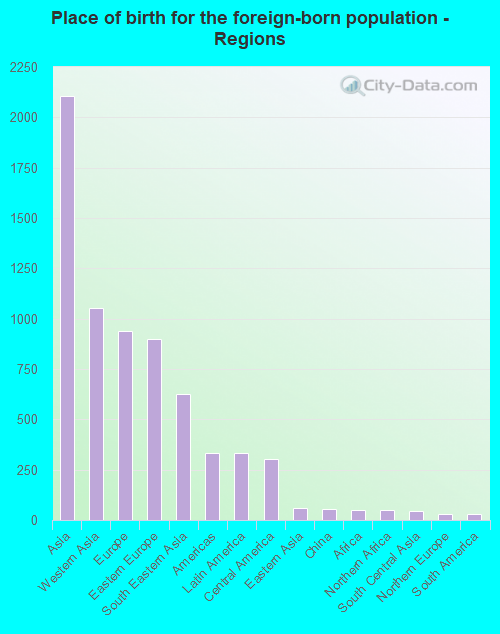
According to 2022 data, the most numerous races in Chicago Ridge, IL are White alone (8,217 residents), Hispanic (2,815 residents), and Black alone (1,070 residents). 58.5% of Chicago Ridge residents speak English at home. 24.6% of Chicago Ridge, IL residents are foreign-born (14.8% born in Asia, 6.6% born in Europe), which is 43.0% greater than the foreign-born rate of 14.0% across the entire state of Illinois.
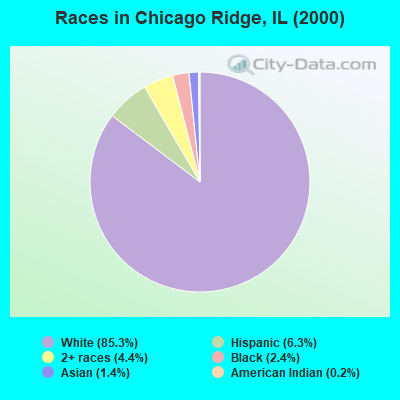
Race distribution in Chicago Ridge
2000 2022
8,424,140 67.8% White alone 1,856,152 14.9% Black alone 1,530,262 12.3% Hispanic 419,916 3.4% Asian alone 153,996 1.2% Two or more races 13,479 0.1% Other race alone 18,232 0.1% American Indian alone 3,116 0.03% Native Hawaiian and Other
7,356,301 58.5% White alone 2,299,726 18.3% Hispanic 1,660,423 13.2% Black alone 747,296 5.9% Asian alone 458,599 3.6% Two or more races 45,386 0.4% Other race alone 10,405 0.08% American Indian alone 3,896 0.03% Native Hawaiian and Other
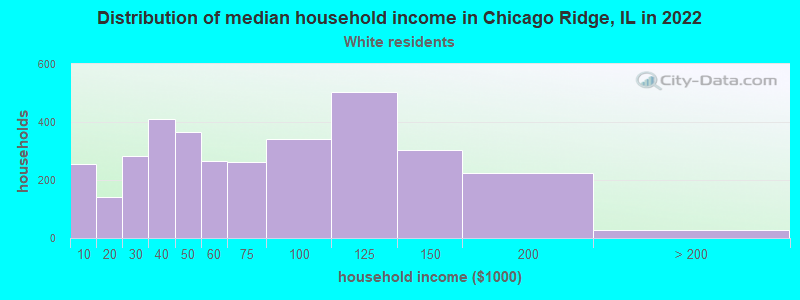
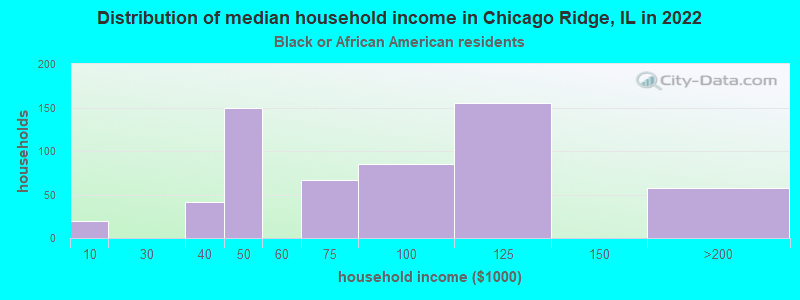
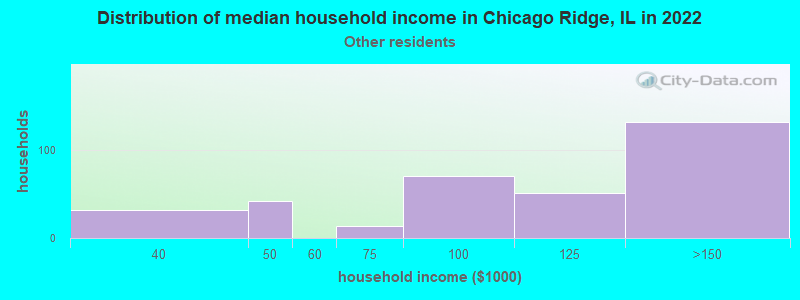
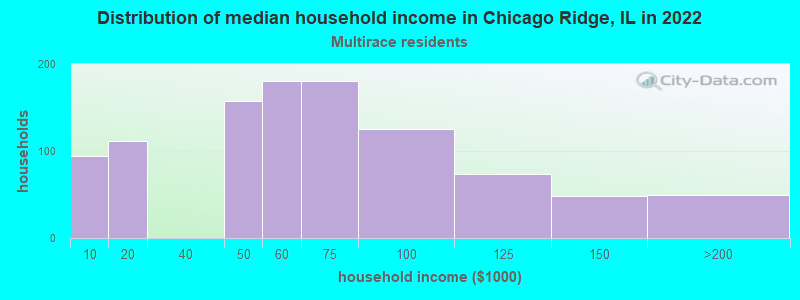
Income and house value in Chicago Ridge Median household income in 2022 $57,136 White non-Hispanic householders$78,368 Black householders$129,122 Asian householders$120,189 Some other race householders$55,898 Two or more races householders$65,922 Hispanic or Latino race householdersMedian 2022 house value $233,692 White Non-Hispanic householders $328,185 Asian householders$263,835 Some other race householders$275,181 Two or more races householders$260,618 Hispanic or Latino householders
Median age by race in Chicago Ridge
39.2 Median age for White residents40.3 38.8 29.1 Median age for Black or African American residents26.7 33.6 -680,473,372.1 Median age for American Indian / Alaska Native residents-736,736,736.0 -641,399,416.3 28.7 Median age for Asian residents24.3 29.9 -687,999,999.3 Median age for Native Hawaiian / Pacific Islander residents-918,721,460.3 -610,229,276.3 29.5 Median age for Other race residents29.9 28.5 34.8 Median age for Two or more races residents39.8 27.5 42.1 Median age for White alone residents43.9 38.3 27.8 Median age for Hispanic or Latino residents23.7 28.6
Owner/renter occupied households by race in Chicago Ridge
House owners and renters - White residents 2,038 60.2% Owner occupied1,349 39.8% Renter occupiedHouse owners and renters - Black or African American residents 260 46.9% Owner occupied294 53.1% Renter occupiedHouse owners and renters - Asian residents 54 54.7% Owner occupied44 45.3% Renter occupiedHouse owners and renters - Other race residents 285 79.1% Owner occupied75 20.9% Renter occupiedHouse owners and renters - Two or more races residents 476 47.5% Owner occupied526 52.5% Renter occupiedHouse owners and renters - White alone residents 2,011 60.3% Owner occupied1,324 39.7% Renter occupiedHouse owners and renters - Hispanic or Latino residents 626 64.4% Owner occupied347 35.6% Renter occupied
Language usage in Chicago Ridge
English speakers - Total 58.5% of residents of Chicago Ridge speak English at home.
11.4% of residents speak Spanish at home 1,199 81.8% Speak English very well267 18.2% Speak English less than very well30.1% of residents speak other language at home 1,749 45.2% Speak English very well2,124 54.8% Speak English less than very well
English speakers - Born in the United States 61.4% of residents of Chicago Ridge speak English at home.
27.5% of residents speak Spanish at home 99 52.7% Speak English very well89 47.3% Speak English less than very well12.6% of residents speak other language at home 86 100.0% Speak English very well
English speakers - Native, born elsewhere 28.3% of residents of Chicago Ridge speak English at home.
15.8% of residents speak Spanish at home 42 100.0% Speak English very well59.6% of residents speak other language at home 25 15.8% Speak English very well133 84.2% Speak English less than very well
English speakers - Foreign-born 10.6% of residents of Chicago Ridge speak English at home.
9.7% of residents speak Spanish at home 184 55.9% Speak English very well145 44.1% Speak English less than very well79.1% of residents speak other language at home 965 35.8% Speak English very well1,731 64.2% Speak English less than very well
White (Caucasian) - Speak only English Native:
80.6% (4,911)Foreign-born:
14.3% (225)
White (Caucasian) - Speak another language Native:
17.0% (1,037)Foreign-born:
85.7% (1,347)
Black or African American - Speak another language Native:
2.9% (30)Foreign-born:
91.2% (7)
Other race - Speak another language Native:
79.0% (424)Foreign-born:
100.0% (316)
Two or more races - Speak only English Native:
67.6% (1,118)Foreign-born:
15.3% (157)
Two or more races - Speak another language Native:
31.0% (512)Foreign-born:
84.7% (871)
White alone - Speak only English Native:
80.6% (4,722)Foreign-born:
11.7% (232)
White alone - Speak another language Native:
20.6% (1,207)Foreign-born:
88.8% (1,767)
Hispanic or Latino - Speak only English Native:
46.4% (915)Foreign-born:
5.2% (17)
Hispanic or Latino - Speak another language Native:
54.5% (1,073)Foreign-born:
94.8% (314)
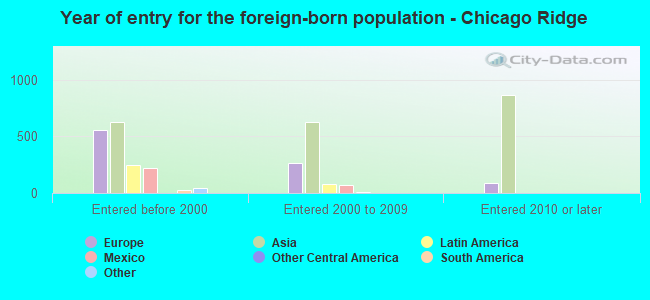
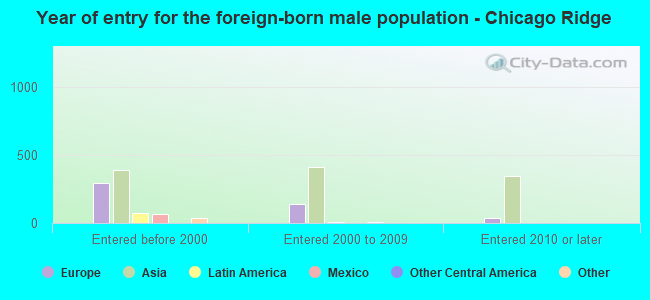
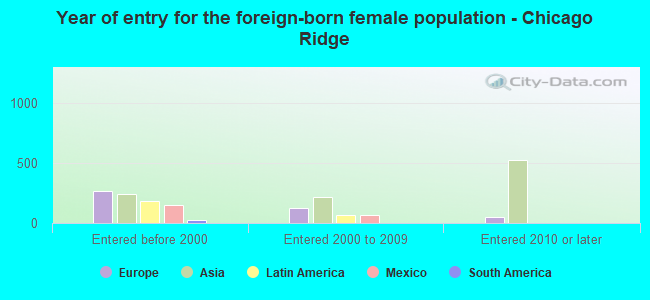
Foreign-born residents in Chicago Ridge 3,433 residents are foreign born (14.8% Asia , 6.6% Europe ).
This city:
24.6%Illinois:
14.1%
Marital status for residents in Chicago Ridge Marital status - White (Caucasian) population 15 years and over
Males 35.9% Never married49.2% Now married3.1% Separated4.5% Widowed7.3% DivorcedFemales 31.0% Never married49.4% Now married0.5% Separated8.4% Widowed10.8% DivorcedWomen who gave birth in the past 12 months Now married:
100.0% (78)Unmarried:
0.0% (0)
Women who did not give birth in the past 12 months Now married:
44.8% (724)Unmarried:
55.2% (892)
Marital status - Black or African American population 15 years and over
Males 67.1% Never married12.0% Now married2.4% Separated1.7% Widowed16.8% DivorcedFemales 75.9% Never married9.8% Now married0.9% Separated1.2% Widowed12.2% DivorcedWomen who gave birth in the past 12 months Now married:
100.0% (21)Unmarried:
0.0% (0)
Women who did not give birth in the past 12 months Now married:
5.5% (25)Unmarried:
94.5% (425)
Marital status - Asian population 15 years and over
Males 52.0% Never married48.0% Now married0.0% Separated0.0% Widowed0.0% DivorcedFemales 49.2% Never married47.3% Now married0.0% Separated3.5% Widowed0.0% DivorcedWomen who did not give birth in the past 12 months Now married:
55.9% (105)Unmarried:
44.1% (83)
Marital status - Other race population 15 years and over
Males 26.4% Never married43.6% Now married7.0% Separated19.8% Widowed3.1% DivorcedFemales 49.9% Never married23.8% Now married0.0% Separated0.0% Widowed26.3% DivorcedWomen who gave birth in the past 12 months Now married:
100.0% (115)Unmarried:
0.0% (0)
Women who did not give birth in the past 12 months Now married:
0.0% (0)Unmarried:
100.0% (269)
Marital status - Two or more races population 15 years and over
Males 33.8% Never married52.6% Now married5.8% Separated7.2% Widowed0.7% DivorcedFemales 27.7% Never married72.3% Now married0.0% Separated0.0% Widowed0.0% DivorcedWomen who did not give birth in the past 12 months Now married:
79.7% (376)Unmarried:
20.3% (96)
Marital status - White alone, not Hispanic / Latino population 15 years and over
Males 33.2% Never married50.3% Now married3.4% Separated5.0% Widowed8.1% DivorcedFemales 30.4% Never married50.6% Now married0.5% Separated8.7% Widowed9.9% DivorcedWomen who gave birth in the past 12 months Now married:
100.0% (88)Unmarried:
0.0% (0)
Women who did not give birth in the past 12 months Now married:
46.3% (709)Unmarried:
53.7% (823)
Marital status - Hispanic or Latino population 15 years and over
Males 52.4% Never married34.9% Now married7.8% Separated4.2% Widowed0.7% DivorcedFemales 50.7% Never married29.6% Now married0.0% Separated1.9% Widowed17.9% DivorcedWomen who gave birth in the past 12 months Now married:
100.0% (102)Unmarried:
0.0% (0)
Women who did not give birth in the past 12 months Now married:
20.1% (124)Unmarried:
79.9% (493)
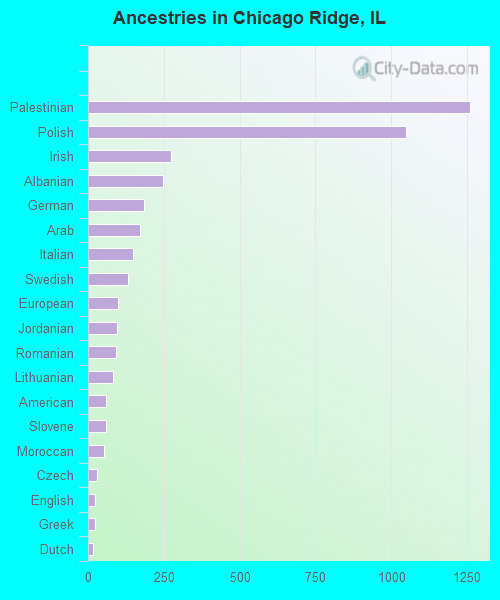
Ancestries in Chicago Ridge
1,260 18.0% Palestinian1,050 15.0% Polish274 3.9% Irish249 3.6% Albanian185 2.6% German172 2.5% Arab148 2.1% Italian133 1.9% Swedish100 1.4% European96 1.4% Jordanian91 1.3% Romanian82 1.2% Lithuanian61 0.9% American61 0.9% Slovene53 0.8% Moroccan30 0.4% Czech23 0.3% English23 0.3% Greek15 0.2% Dutch5 0.07% Ukrainian
Children Nativity (place of birth) in Chicago Ridge
Children under 6 years - Living with two parents Both parents native 343 100.0% NativeBoth parents foreign-born 317 93.7% Native21 6.3% Foreign-bornOne native, one foreign-born parent 291 100.0% NativeChildren under 6 years - Living with one parent Native parent 200 100.0% NativeChildren 6 to 17 years - Living with two parents Both parents native 541 100.0% NativeBoth parents foreign-born 285 76.5% Native88 23.5% Foreign-bornOne native, one foreign-born parent 386 100.0% NativeChildren 6 to 17 years - Living with one parent Native parent 284 100.0% NativeForeign-born parent 150 50.1% Native149 49.9% Foreign-born
Grandparents responsible for own grandchildren in Chicago Ridge
Grandparents (30 to 59 years) White / Caucasian 26 72.8% Responsible for grandchildren10 27.2% Not responsible for grandchildrenOther race 30 100.0% Not responsible for grandchildrenWhite alone, not Hispanic / Latino 34 80.6% Responsible for grandchildren8 19.4% Not responsible for grandchildrenHispanic or Latino 25 100.0% Not responsible for grandchildren
Grandparents (60 years and over) White / Caucasian 73 100.0% Not responsible for grandchildrenOther race 13 100.0% Not responsible for grandchildrenWhite alone, not Hispanic / Latino 94 100.0% Not responsible for grandchildrenHispanic or Latino 13 100.0% Not responsible for grandchildren