Races in Chelsea, Maine (ME) Detailed Stats
Ancestries, Foreign-born residents, place of birth

Recent posts about races in Chelsea, Maine on our local forum with over 2,400,000 registered users:
 | Does Sebec exist? (20 replies) |
| Augusta ?'s about revitalization (29 replies) |
| Selling and moving (44 replies) |
| Moving to Augusta (34 replies) |
| Belfast Anyone? (40 replies) |
| Who's planting a new garden or expanding an old one? (25 replies) |
Latest news about races in Chelsea, ME collected exclusively by city-data.com from local newspapers, TV, and radio stations
1.3% of Chelsea, ME residents are foreign-born , which is 125.8% less than the foreign-born rate of 3.0% across the entire state of Maine.
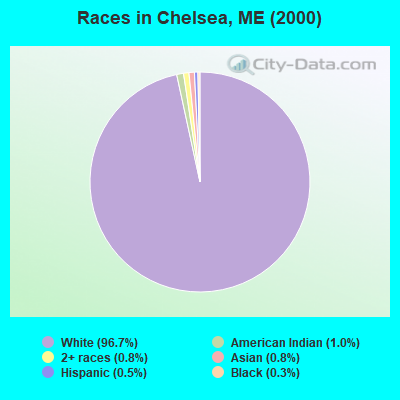
Race distribution in Chelsea

- 2,47596.7%White alone
- 251.0%American Indian alone
- 200.8%Two or more races
- 200.8%Asian alone
- 120.5%Hispanic
- 70.3%Black alone
2000
2022
-
- 1,230,29796.5%White alone
- 11,7310.9%Two or more races
- 9,3600.7%Hispanic
- 9,0140.7%Asian alone
- 6,4400.5%Black alone
- 6,9110.5%American Indian alone
- 8360.07%Other race alone
- 3340.03%Native Hawaiian and Other
Pacific Islander alone

-
- 1,249,23390.2%White alone
- 58,3574.2%Two or more races
- 28,7172.1%Hispanic
- 21,5831.6%Black alone
- 16,1511.2%Asian alone
- 5,8730.4%Other race alone
- 5,2050.4%American Indian alone
- 2210.02%Native Hawaiian and Other
Pacific Islander alone

Income and house value in Chelsea
- Median household income in 2022
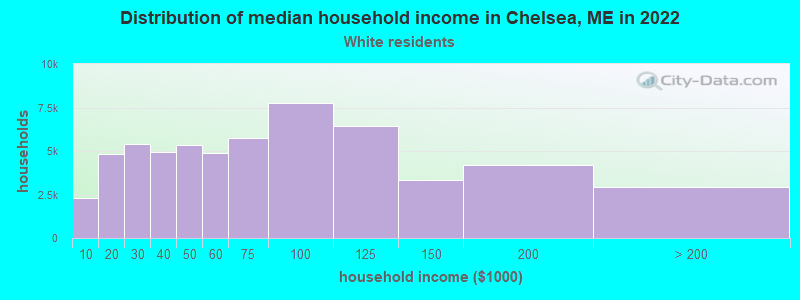
- $71,099White non-Hispanic householders
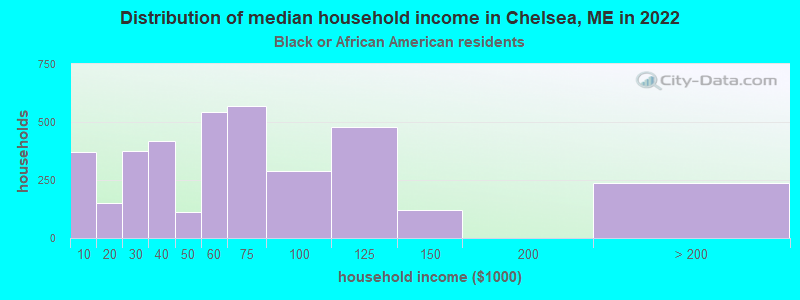
- $22,327Black householders
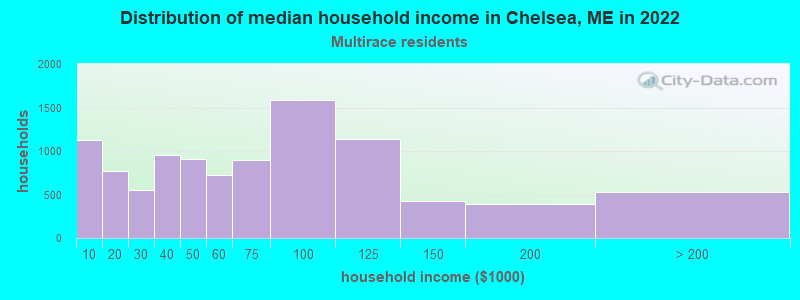
- $37,942Two or more races householders
- $47,771Hispanic or Latino race householders
- Median 2022 house value
- $231,074White Non-Hispanic householders
- $169,907Two or more races householders
Household income for White non-Hispanic householders
Household income for Black householders
Household income for Two or more races householders
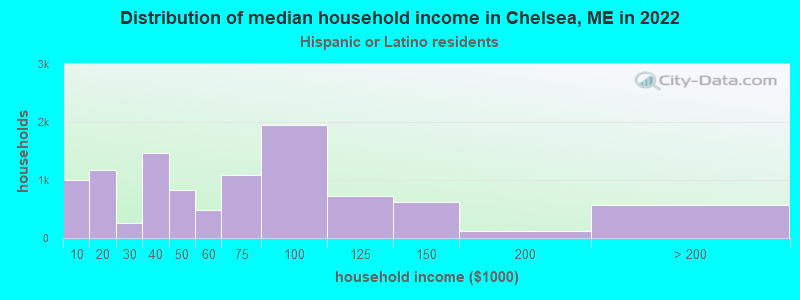
Household income for Hispanic or Latino race householders
Foreign-born residents in Chelsea
34 residents are foreign born
| This city: | 1.3% |
| Maine: | 2.9% |
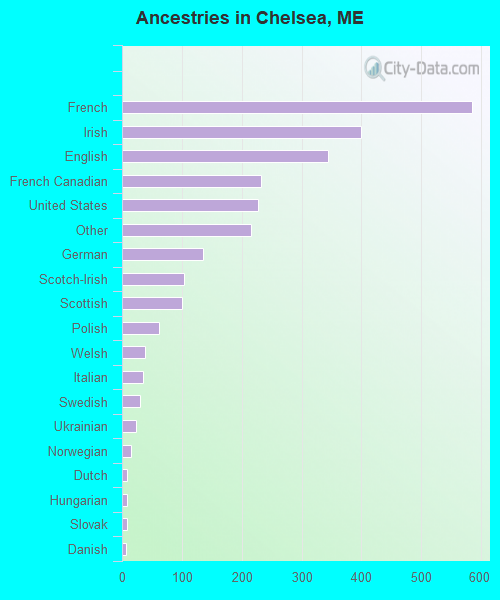
Ancestries in Chelsea

- 58422.6%French
- 39915.4%Irish
- 34413.3%English
- 2329.0%French Canadian
- 2288.8%United States
- 2168.3%Other
- 1355.2%German
- 1044.0%Scotch-Irish
- 1003.9%Scottish
- 622.4%Polish
- 391.5%Welsh
- 351.4%Italian
- 301.2%Swedish
- 240.9%Ukrainian
- 150.6%Norwegian
- 90.3%Dutch
- 80.3%Hungarian
- 80.3%Slovak
- 60.2%Danish
- 30.1%Czech
- 30.1%Subsaharan African
- 30.1%Swiss
Zip codes: 04330.