Races in Cheektowaga, New York (NY) Detailed Stats
Data:
Races - White alone (%)
Races - White alone (% change since 2000)
Races - Black alone (%)
Races - Black alone (% change since 2000)
Races - American Indian alone (%)
Races - American Indian alone (% change since 2000)
Races - Asian alone (%)
Races - Asian alone (% change since 2000)
Races - Hispanic (%)
Races - Hispanic (% change since 2000)
Races - Native Hawaiian and Other Pacific Islander alone (%)
Races - Native Hawaiian and Other Pacific Islander alone (% change since 2000)
Races - Two or more races(%)
Races - Two or more races(% change since 2000)
Races - Other race alone (%)
Races - Other race alone (% change since 2000)
Racial diversity
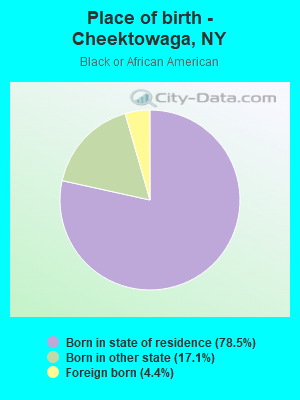
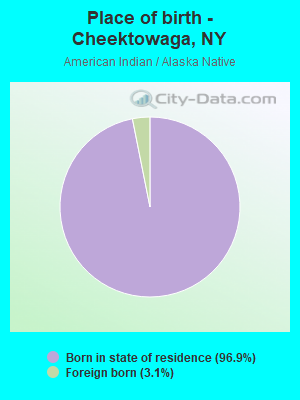
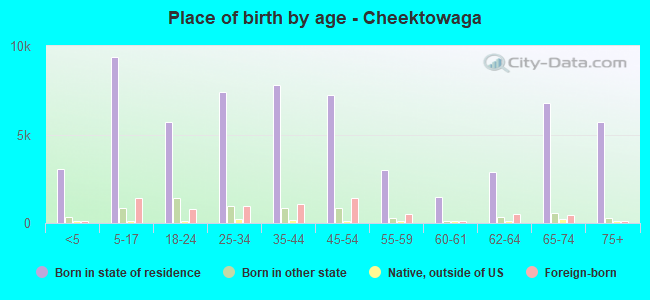
Place of birth - Born in state of residence (%)
Place of birth - Born in state of residence (%) - White
Place of birth - Born in state of residence (%) - Black or African American
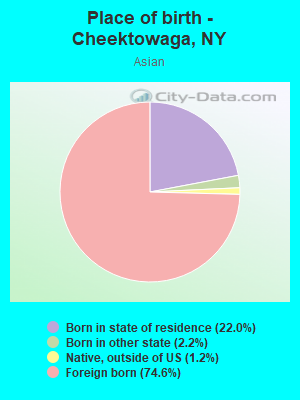
Place of birth - Born in state of residence (%) - Asian
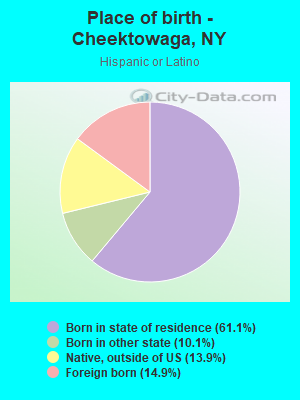
Place of birth - Born in state of residence (%) - Hispanic or Latino
Place of birth - Born in state of residence (%) - American Indian and Alaska Native
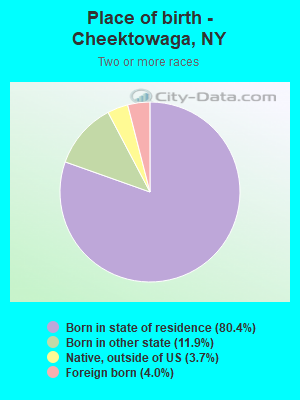
Place of birth - Born in state of residence (%) - Multirace
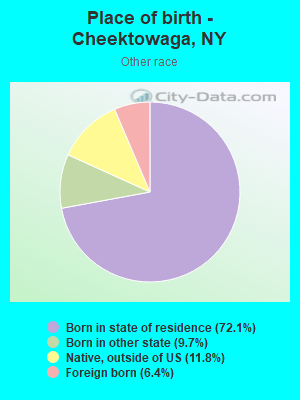
Place of birth - Born in state of residence (%) - Other Race
Place of birth - Born in other state (%)
Place of birth - Born in other state (%) - White
Place of birth - Born in other state (%) - Black or African American
Place of birth - Born in other state (%) - Asian
Place of birth - Born in other state (%) - Hispanic or Latino
Place of birth - Born in other state (%) - American Indian and Alaska Native
Place of birth - Born in other state (%) - Multirace
Place of birth - Born in other state (%) - Other Race
Place of birth - Native, outside of US (%)
Place of birth - Native, outside of US (%) - White
Place of birth - Native, outside of US (%) - Black or African American
Place of birth - Native, outside of US (%) - Asian
Place of birth - Native, outside of US (%) - Hispanic or Latino
Place of birth - Native, outside of US (%) - American Indian and Alaska Native
Place of birth - Native, outside of US (%) - Multirace
Place of birth - Native, outside of US (%) - Other Race
Place of birth - Foreign born (%)
Place of birth - Foreign born (%) - White
Place of birth - Foreign born (%) - Black or African American
Place of birth - Foreign born (%) - Asian
Place of birth - Foreign born (%) - Hispanic or Latino
Place of birth - Foreign born (%) - American Indian and Alaska Native
Place of birth - Foreign born (%) - Multirace
Place of birth - Foreign born (%) - Other Race
Residents speaking English at home (%)
Residents speaking English at home - Born in the United States (%)
Residents speaking English at home - Native, born elsewhere (%)
Residents speaking English at home - Foreign born (%)
Residents speaking Spanish at home (%)
Residents speaking Spanish at home - Born in the United States (%)
Residents speaking Spanish at home - Native, born elsewhere (%)
Residents speaking Spanish at home - Foreign born (%)
Residents speaking other language at home (%)
Residents speaking other language at home - Born in the United States (%)
Residents speaking other language at home - Native, born elsewhere (%)
Residents speaking other language at home - Foreign born (%)
Marital status - Never married (%)
Marital status - Now married (%)
Marital status - Separated (%)
Marital status - Widowed (%)
Marital status - Divorced (%)
Ancestries Reported - Arab (%)
Ancestries Reported - Czech (%)
Ancestries Reported - Danish (%)
Ancestries Reported - Dutch (%)
Ancestries Reported - English (%)
Ancestries Reported - French (%)
Ancestries Reported - French Canadian (%)
Ancestries Reported - German (%)
Ancestries Reported - Greek (%)
Ancestries Reported - Hungarian (%)
Ancestries Reported - Irish (%)
Ancestries Reported - Italian (%)
Ancestries Reported - Lithuanian (%)
Ancestries Reported - Norwegian (%)
Ancestries Reported - Polish (%)
Ancestries Reported - Portuguese (%)
Ancestries Reported - Russian (%)
Ancestries Reported - Scotch-Irish (%)
Ancestries Reported - Scottish (%)
Ancestries Reported - Slovak (%)
Ancestries Reported - Subsaharan African (%)
Ancestries Reported - Swedish (%)
Ancestries Reported - Swiss (%)
Ancestries Reported - Ukrainian (%)
Ancestries Reported - United States (%)
Ancestries Reported - Welsh (%)
Ancestries Reported - West Indian (%)
Ancestries Reported - Other (%)
Geographical mobility - Same house 1 year ago (%)
Geographical mobility - Same house 1 year ago (%) - White
Geographical mobility - Same house 1 year ago (%) - Black or African American
Geographical mobility - Same house 1 year ago (%) - Asian
Geographical mobility - Same house 1 year ago (%) - Hispanic or Latino
Geographical mobility - Same house 1 year ago (%) - American Indian and Alaska Native
Geographical mobility - Same house 1 year ago (%) - Multirace
Geographical mobility - Same house 1 year ago (%) - Other Race
Geographical mobility - Moved within same county (%)
Geographical mobility - Moved within same county (%) - White
Geographical mobility - Moved within same county (%) - Black or African American
Geographical mobility - Moved within same county (%) - Asian
Geographical mobility - Moved within same county (%) - Hispanic or Latino
Geographical mobility - Moved within same county (%) - American Indian and Alaska Native
Geographical mobility - Moved within same county (%) - Multirace
Geographical mobility - Moved within same county (%) - Other Race
Geographical mobility - Moved from different county within same state (%)
Geographical mobility - Moved from different county within same state (%) - White
Geographical mobility - Moved from different county within same state (%) - Black or African American
Geographical mobility - Moved from different county within same state (%) - Asian
Geographical mobility - Moved from different county within same state (%) - Hispanic or Latino
Geographical mobility - Moved from different county within same state (%) - American Indian and Alaska Native
Geographical mobility - Moved from different county within same state (%) - Multirace
Geographical mobility - Moved from different county within same state (%) - Other Race
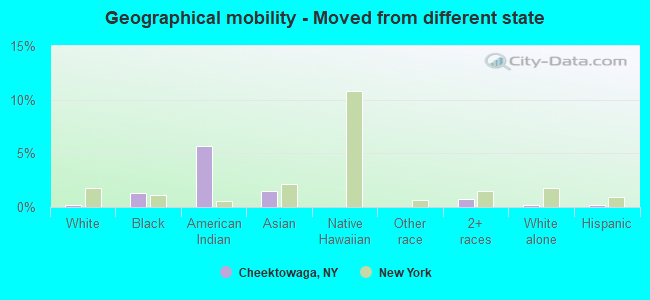
Geographical mobility - Moved from different state (%)
Geographical mobility - Moved from different state (%) - White
Geographical mobility - Moved from different state (%) - Black or African American
Geographical mobility - Moved from different state (%) - Asian
Geographical mobility - Moved from different state (%) - Hispanic or Latino
Geographical mobility - Moved from different state (%) - American Indian and Alaska Native
Geographical mobility - Moved from different state (%) - Multirace
Geographical mobility - Moved from different state (%) - Other Race
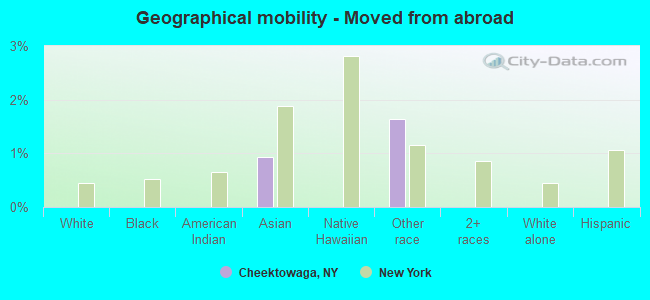
Geographical mobility - Moved from abroad (%)
Geographical mobility - Moved from abroad (%) - White
Geographical mobility - Moved from abroad (%) - Black or African American
Geographical mobility - Moved from abroad (%) - Asian
Geographical mobility - Moved from abroad (%) - Hispanic or Latino
Geographical mobility - Moved from abroad (%) - American Indian and Alaska Native
Geographical mobility - Moved from abroad (%) - Multirace
Geographical mobility - Moved from abroad (%) - Other Race
Place of birth for the foreign-born population - Ireland (%)
Place of birth for the foreign-born population - Denmark (%)
Place of birth for the foreign-born population - Norway (%)
Place of birth for the foreign-born population - Sweden (%)
Place of birth for the foreign-born population - United Kingdom (%)
Place of birth for the foreign-born population - England (%)
Place of birth for the foreign-born population - Scotland (%)
Place of birth for the foreign-born population - Other Northern Europe (%)
Place of birth for the foreign-born population - Austria (%)
Place of birth for the foreign-born population - Belgium (%)
Place of birth for the foreign-born population - France (%)
Place of birth for the foreign-born population - Germany (%)
Place of birth for the foreign-born population - Netherlands (%)
Place of birth for the foreign-born population - Switzerland (%)
Place of birth for the foreign-born population - Other Western Europe (%)
Place of birth for the foreign-born population - Greece (%)
Place of birth for the foreign-born population - Italy (%)
Place of birth for the foreign-born population - Portugal (%)
Place of birth for the foreign-born population - Spain (%)
Place of birth for the foreign-born population - Other Southern Europe (%)
Place of birth for the foreign-born population - Albania (%)
Place of birth for the foreign-born population - Belarus (%)
Place of birth for the foreign-born population - Bosnia and Herzegovina (%)
Place of birth for the foreign-born population - Bulgaria (%)
Place of birth for the foreign-born population - Croatia (%)
Place of birth for the foreign-born population - Czechoslovakia (%)
Place of birth for the foreign-born population - Hungary (%)
Place of birth for the foreign-born population - Latvia (%)
Place of birth for the foreign-born population - Lithuania (%)
Place of birth for the foreign-born population - North Macedonia (Macedonia) (%)
Place of birth for the foreign-born population - Moldova (%)
Place of birth for the foreign-born population - Poland (%)
Place of birth for the foreign-born population - Romania (%)
Place of birth for the foreign-born population - Russia (%)
Place of birth for the foreign-born population - Serbia (%)
Place of birth for the foreign-born population - Ukraine (%)
Place of birth for the foreign-born population - Other Eastern Europe (%)
Place of birth for the foreign-born population - China (%)
Place of birth for the foreign-born population - Hong Kong (%)
Place of birth for the foreign-born population - Taiwan (%)
Place of birth for the foreign-born population - Japan (%)
Place of birth for the foreign-born population - Korea (%)
Place of birth for the foreign-born population - Other Eastern Asia (%)
Place of birth for the foreign-born population - Afghanistan (%)
Place of birth for the foreign-born population - Bangladesh (%)
Place of birth for the foreign-born population - India (%)
Place of birth for the foreign-born population - Iran (%)
Place of birth for the foreign-born population - Kazakhstan (%)
Place of birth for the foreign-born population - Nepal (%)
Place of birth for the foreign-born population - Pakistan (%)
Place of birth for the foreign-born population - Sri Lanka (%)
Place of birth for the foreign-born population - Uzbekistan (%)
Place of birth for the foreign-born population - Other South Central Asia (%)
Place of birth for the foreign-born population - Burma (%)
Place of birth for the foreign-born population - Cambodia (%)
Place of birth for the foreign-born population - Indonesia (%)
Place of birth for the foreign-born population - Laos (%)
Place of birth for the foreign-born population - Malaysia (%)
Place of birth for the foreign-born population - Philippines (%)
Place of birth for the foreign-born population - Singapore (%)
Place of birth for the foreign-born population - Thailand (%)
Place of birth for the foreign-born population - Vietnam (%)
Place of birth for the foreign-born population - Other South Eastern Asia (%)
Place of birth for the foreign-born population - Armenia (%)
Place of birth for the foreign-born population - Iraq (%)
Place of birth for the foreign-born population - Israel (%)
Place of birth for the foreign-born population - Jordan (%)
Place of birth for the foreign-born population - Kuwait (%)
Place of birth for the foreign-born population - Lebanon (%)
Place of birth for the foreign-born population - Saudi Arabia (%)
Place of birth for the foreign-born population - Syria (%)
Place of birth for the foreign-born population - Turkey (%)
Place of birth for the foreign-born population - Yemen (%)
Place of birth for the foreign-born population - Other Western Asia (%)
Place of birth for the foreign-born population - Eritrea (%)
Place of birth for the foreign-born population - Ethiopia (%)
Place of birth for the foreign-born population - Kenya (%)
Place of birth for the foreign-born population - Somalia (%)
Place of birth for the foreign-born population - Uganda (%)
Place of birth for the foreign-born population - Zimbabwe (%)
Place of birth for the foreign-born population - Other Eastern Africa (%)
Place of birth for the foreign-born population - Cameroon (%)
Place of birth for the foreign-born population - Congo (%)
Place of birth for the foreign-born population - Democratic Republic of Congo (Zaire) (%)
Place of birth for the foreign-born population - Other Middle Africa (%)
Place of birth for the foreign-born population - Egypt (%)
Place of birth for the foreign-born population - Morocco (%)
Place of birth for the foreign-born population - Sudan (%)
Place of birth for the foreign-born population - Other Northern Africa (%)
Place of birth for the foreign-born population - South Africa (%)
Place of birth for the foreign-born population - Other Southern Africa (%)
Place of birth for the foreign-born population - Cabo Verde (%)
Place of birth for the foreign-born population - Ghana (%)
Place of birth for the foreign-born population - Liberia (%)
Place of birth for the foreign-born population - Nigeria (%)
Place of birth for the foreign-born population - Senegal (%)
Place of birth for the foreign-born population - Sierra Leone (%)
Place of birth for the foreign-born population - Other Western Africa (%)
Place of birth for the foreign-born population - Australia (%)
Place of birth for the foreign-born population - New Zealand (%)
Place of birth for the foreign-born population - Fiji (%)
Place of birth for the foreign-born population - Micronesia (%)
Place of birth for the foreign-born population - Bahamas (%)
Place of birth for the foreign-born population - Barbados (%)
Place of birth for the foreign-born population - Cuba (%)
Place of birth for the foreign-born population - Dominica (%)
Place of birth for the foreign-born population - Dominican Republic (%)
Place of birth for the foreign-born population - Grenada (%)
Place of birth for the foreign-born population - Haiti (%)
Place of birth for the foreign-born population - Jamaica (%)
Place of birth for the foreign-born population - St. Vincent and the Grenadines (%)
Place of birth for the foreign-born population - Trinidad and Tobago (%)
Place of birth for the foreign-born population - West Indies (%)
Place of birth for the foreign-born population - Other Caribbean (%)
Place of birth for the foreign-born population - Belize (%)
Place of birth for the foreign-born population - Costa Rica (%)
Place of birth for the foreign-born population - El Salvador (%)
Place of birth for the foreign-born population - Guatemala (%)
Place of birth for the foreign-born population - Honduras (%)
Place of birth for the foreign-born population - Mexico (%)
Place of birth for the foreign-born population - Nicaragua (%)
Place of birth for the foreign-born population - Panama (%)
Place of birth for the foreign-born population - Other Central America (%)
Place of birth for the foreign-born population - Argentina (%)
Place of birth for the foreign-born population - Bolivia (%)
Place of birth for the foreign-born population - Brazil (%)
Place of birth for the foreign-born population - Chile (%)
Place of birth for the foreign-born population - Colombia (%)
Place of birth for the foreign-born population - Ecuador (%)
Place of birth for the foreign-born population - Guyana (%)
Place of birth for the foreign-born population - Peru (%)
Place of birth for the foreign-born population - Uruguay (%)
Place of birth for the foreign-born population - Venezuela (%)
Place of birth for the foreign-born population - Other South America (%)
Place of birth for the foreign-born population - Canada (%)
Place of birth for the foreign-born population - Other Northern America (%)
Place of birth for the foreign-born population - Other (%)
Latest news about races in Cheektowaga, NY collected exclusively by city-data.com from local newspapers, TV, and radio stations
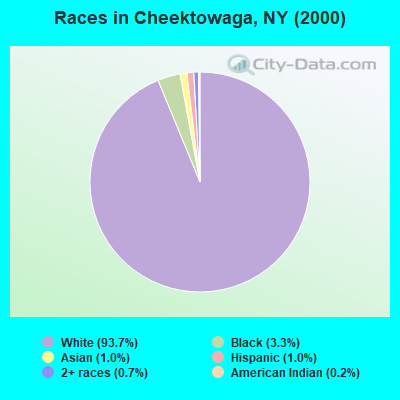
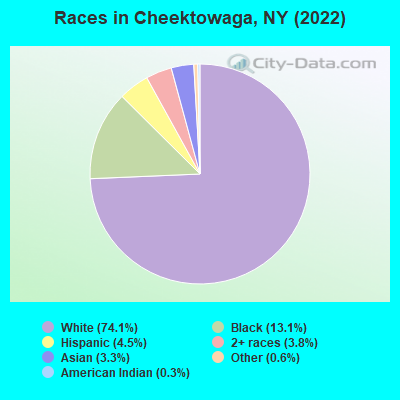
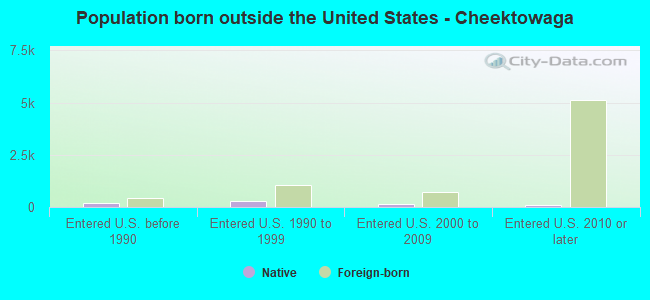
According to 2022 data, the most numerous races in Cheektowaga, NY are White alone (56,628 residents), Hispanic (3,435 residents), and Black alone (10,042 residents). 89.8% of Cheektowaga residents speak English at home. 7.0% of Cheektowaga, NY residents are foreign-born (3.6% born in Asia, 1.7% born in Europe, 0.7% born in Africa), which is 215.1% less than the foreign-born rate of 22.0% across the entire state of New York.
Race distribution in Cheektowaga
2000 2022
11,760,981 62.0% White alone 2,867,583 15.1% Hispanic 2,812,623 14.8% Black alone 1,035,926 5.5% Asian alone 366,116 1.9% Two or more races 75,499 0.4% Other race alone 52,499 0.3% American Indian alone 5,230 0.03% Native Hawaiian and Other
10,408,933 52.9% White alone 3,867,299 19.7% Hispanic 2,633,840 13.4% Black alone 1,776,286 9.0% Asian alone 732,670 3.7% Two or more races 216,110 1.1% Other race alone 35,082 0.2% American Indian alone 6,931 0.04% Native Hawaiian and Other
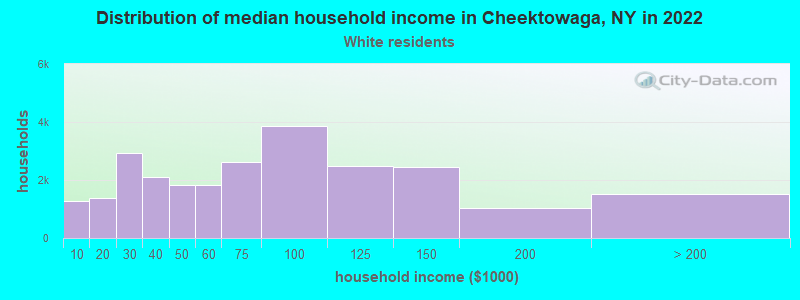
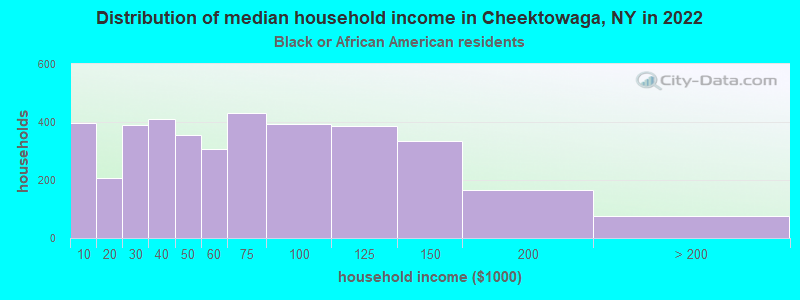
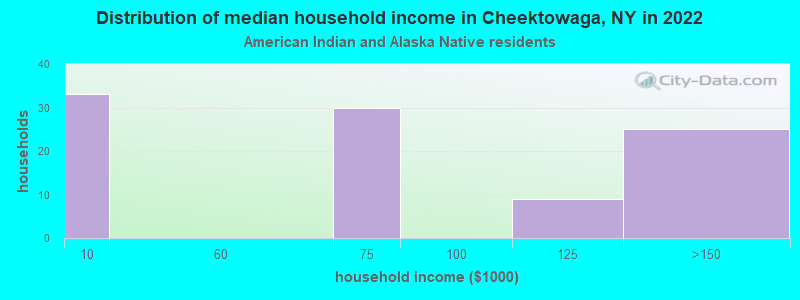
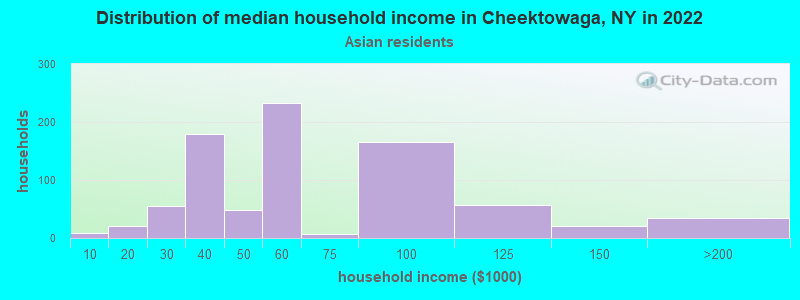
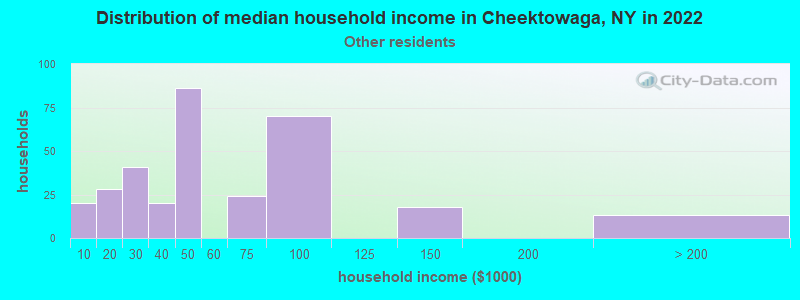
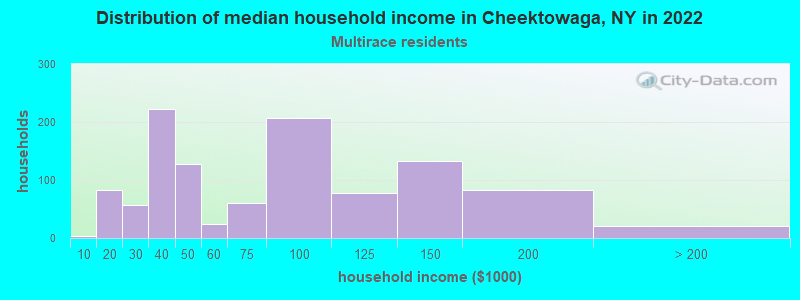
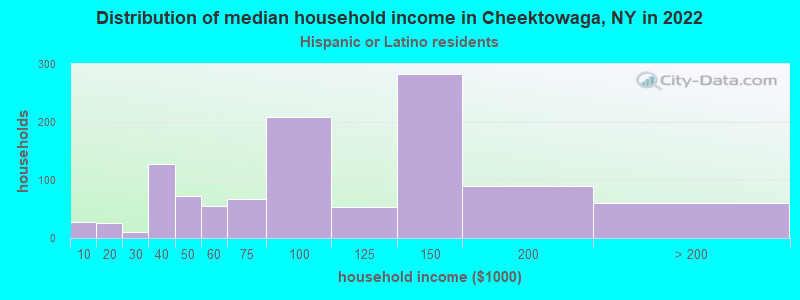
Income and house value in Cheektowaga Median household income in 2022 $66,677 White non-Hispanic householders$38,587 Black householders$56,988 Asian householders$82,369 Some other race householders$73,452 Two or more races householders$86,146 Hispanic or Latino race householdersMedian 2022 house value $175,381 White Non-Hispanic householders$169,827 Black or African American householders$138,852 American Indian or Alaska Native householders $151,883 Asian householders$218,105 Some other race householders$163,846 Two or more races householders$198,025 Hispanic or Latino householders
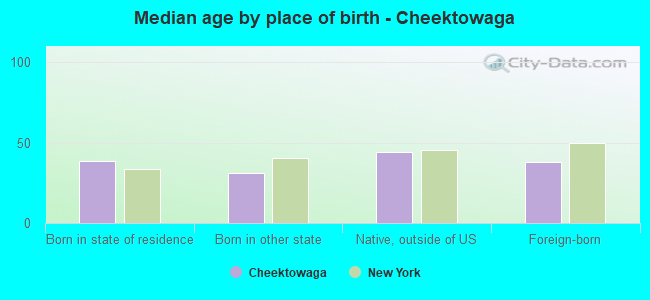
Median age by race in Cheektowaga
46.3 Median age for White residents40.3 49.1 29.0 Median age for Black or African American residents23.0 34.3 -666,666,666.0 Median age for American Indian / Alaska Native residents-666,666,666.0 -666,666,666.0 32.0 Median age for Asian residents32.6 31.1 -666,666,666.0 Median age for Native Hawaiian / Pacific Islander residents-666,666,666.0 -666,666,666.0 24.3 Median age for Other race residents30.6 16.9 13.9 Median age for Two or more races residents13.1 17.8 47.3 Median age for White alone residents40.5 50.5 25.3 Median age for Hispanic or Latino residents23.7 25.9
Owner/renter occupied households by race in Cheektowaga
House owners and renters - White residents 19,593 77.3% Owner occupied5,749 22.7% Renter occupiedHouse owners and renters - Black or African American residents 2,278 50.8% Owner occupied2,204 49.2% Renter occupiedHouse owners and renters - American Indian / Alaska Native residents 31 41.9% Owner occupied44 58.1% Renter occupiedHouse owners and renters - Asian residents 855 61.2% Owner occupied543 38.8% Renter occupiedHouse owners and renters - Native Hawaiian / Pacific Islander residents 14 100.0% Owner occupiedHouse owners and renters - Other race residents 140 48.0% Owner occupied151 52.0% Renter occupiedHouse owners and renters - Two or more races residents 906 62.8% Owner occupied536 37.2% Renter occupiedHouse owners and renters - White alone residents 19,136 77.1% Owner occupied5,680 22.9% Renter occupiedHouse owners and renters - Hispanic or Latino residents 822 64.9% Owner occupied444 35.1% Renter occupied
Language usage in Cheektowaga
English speakers - Total 89.8% of residents of Cheektowaga speak English at home.
1.7% of residents speak Spanish at home 983 78.0% Speak English very well277 22.0% Speak English less than very well8.6% of residents speak other language at home 3,766 60.0% Speak English very well2,508 40.0% Speak English less than very well
English speakers - Born in the United States 95.8% of residents of Cheektowaga speak English at home.
1.4% of residents speak Spanish at home 84 100.0% Speak English very well2.5% of residents speak other language at home 144 99.3% Speak English very well1 0.7% Speak English less than very well
English speakers - Native, born elsewhere 45.6% of residents of Cheektowaga speak English at home.
40.7% of residents speak Spanish at home 246 89.1% Speak English very well30 10.9% Speak English less than very well12.8% of residents speak other language at home 74 85.1% Speak English very well13 14.9% Speak English less than very well
English speakers - Foreign-born 14.5% of residents of Cheektowaga speak English at home.
2.6% of residents speak Spanish at home 91 68.9% Speak English very well41 31.1% Speak English less than very well86.0% of residents speak other language at home 2,180 49.4% Speak English very well2,233 50.6% Speak English less than very well
White (Caucasian) - Speak only English Native:
98.9% (47,633)Foreign-born:
13.9% (311)
White (Caucasian) - Speak another language Native:
1.1% (510)Foreign-born:
86.1% (1,932)
Black or African American - Speak only English Native:
97.0% (8,661)Foreign-born:
17.4% (87)
Black or African American - Speak another language Native:
2.9% (259)Foreign-born:
85.8% (426)
American Indian / Alaska Native - Speak only English Native:
84.6% (196)Foreign-born:
64.1% (6)
Asian - Speak only English Native:
62.3% (504)Foreign-born:
2.5% (102)
Asian - Speak another language Native:
37.7% (305)Foreign-born:
97.5% (3,942)
Other race - Speak only English Native:
82.1% (779)Foreign-born:
32.3% (24)
Other race - Speak another language Native:
29.7% (282)Foreign-born:
66.4% (50)
Two or more races - Speak only English Native:
91.9% (3,338)Foreign-born:
8.5% (22)
Two or more races - Speak another language Native:
8.4% (304)Foreign-born:
87.4% (222)
White alone - Speak only English Native:
99.2% (46,867)Foreign-born:
16.8% (311)
White alone - Speak another language Native:
0.8% (375)Foreign-born:
83.2% (1,541)
Hispanic or Latino - Speak only English Native:
82.1% (2,395)Foreign-born:
10.9% (22)
Hispanic or Latino - Speak another language Native:
23.3% (680)Foreign-born:
90.1% (184)
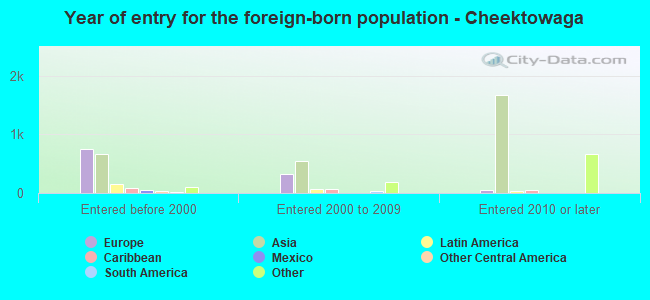
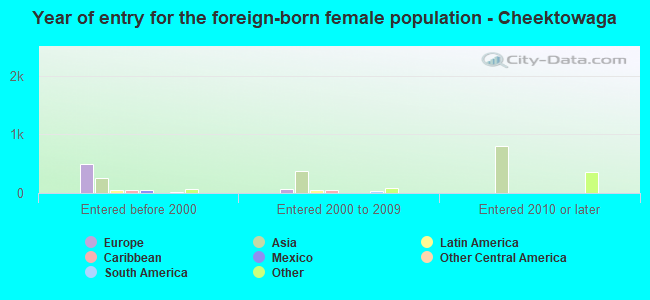
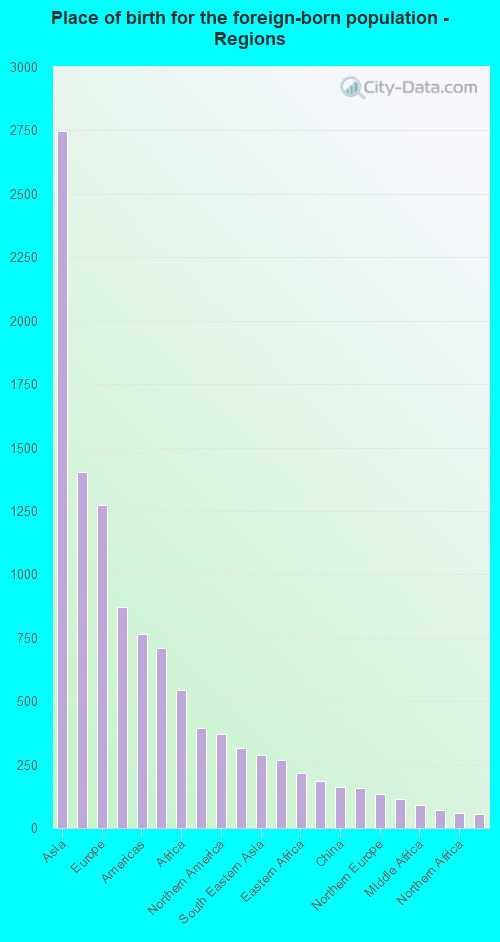
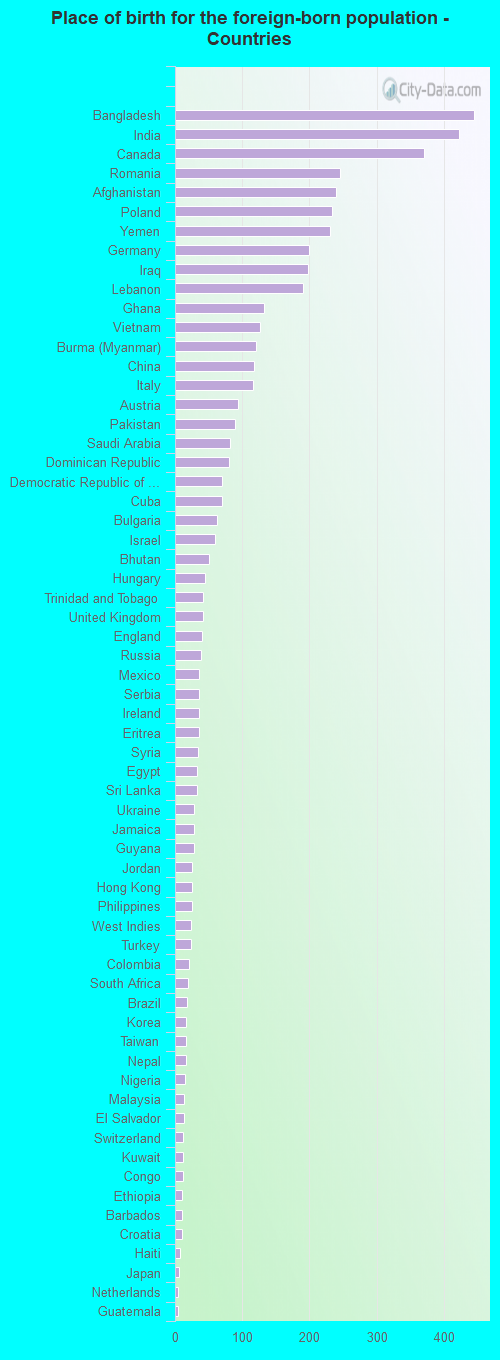
Foreign-born residents in Cheektowaga 5,334 residents are foreign born (3.6% Asia , 1.7% Europe , 0.7% Africa ).
This city:
7.0%New York:
22.6%
Marital status for residents in Cheektowaga Marital status - White (Caucasian) population 15 years and over
Males 32.9% Never married55.3% Now married0.4% Separated4.1% Widowed7.3% DivorcedFemales 28.1% Never married47.7% Now married1.8% Separated11.7% Widowed10.7% DivorcedWomen who gave birth in the past 12 months Now married:
71.5% (492)Unmarried:
28.5% (196)
Women who did not give birth in the past 12 months Now married:
46.9% (5,138)Unmarried:
53.1% (5,826)
Marital status - Black or African American population 15 years and over
Males 57.4% Never married32.2% Now married0.9% Separated0.0% Widowed9.4% DivorcedFemales 58.3% Never married22.0% Now married6.3% Separated4.1% Widowed9.3% DivorcedWomen who gave birth in the past 12 months Now married:
0.0% (0)Unmarried:
100.0% (19)
Women who did not give birth in the past 12 months Now married:
30.2% (915)Unmarried:
69.8% (2,118)
Marital status - American Indian / Alaska Native population 15 years and over
Males 40.8% Never married59.2% Now married0.0% Separated0.0% Widowed0.0% DivorcedFemales 100.0% Never married0.0% Now married0.0% Separated0.0% Widowed0.0% DivorcedWomen who did not give birth in the past 12 months Now married:
0.0% (0)Unmarried:
100.0% (24)
Marital status - Asian population 15 years and over
Males 27.3% Never married66.4% Now married0.0% Separated0.6% Widowed5.8% DivorcedFemales 35.5% Never married52.6% Now married2.1% Separated5.3% Widowed4.5% DivorcedWomen who gave birth in the past 12 months Now married:
100.0% (97)Unmarried:
0.0% (0)
Women who did not give birth in the past 12 months Now married:
43.7% (265)Unmarried:
56.3% (342)
Marital status - Native Hawaiian / Pacific Islander population 15 years and over
Males 76.5% Never married23.5% Now married0.0% Separated0.0% Widowed0.0% DivorcedFemales 82.6% Never married0.0% Now married0.0% Separated0.0% Widowed17.4% DivorcedWomen who did not give birth in the past 12 months Now married:
0.0% (0)Unmarried:
100.0% (20)
Marital status - Other race population 15 years and over
Males 57.0% Never married38.7% Now married0.0% Separated0.0% Widowed4.3% DivorcedFemales 58.9% Never married35.7% Now married0.0% Separated3.6% Widowed1.8% DivorcedWomen who did not give birth in the past 12 months Now married:
34.4% (108)Unmarried:
65.6% (206)
Marital status - Two or more races population 15 years and over
Males 64.6% Never married27.8% Now married0.0% Separated0.0% Widowed7.6% DivorcedFemales 76.1% Never married16.0% Now married1.9% Separated1.9% Widowed4.2% DivorcedWomen who gave birth in the past 12 months Now married:
67.6% (28)Unmarried:
32.4% (13)
Women who did not give birth in the past 12 months Now married:
10.9% (136)Unmarried:
89.1% (1,114)
Marital status - White alone, not Hispanic / Latino population 15 years and over
Males 32.5% Never married55.9% Now married0.4% Separated4.1% Widowed7.1% DivorcedFemales 27.6% Never married47.4% Now married1.9% Separated12.1% Widowed11.1% DivorcedWomen who gave birth in the past 12 months Now married:
71.5% (492)Unmarried:
28.5% (196)
Women who did not give birth in the past 12 months Now married:
46.4% (4,747)Unmarried:
53.6% (5,475)
Marital status - Hispanic or Latino population 15 years and over
Males 54.1% Never married38.1% Now married0.0% Separated0.0% Widowed7.8% DivorcedFemales 53.3% Never married38.5% Now married3.6% Separated2.3% Widowed2.3% DivorcedWomen who gave birth in the past 12 months Now married:
87.6% (88)Unmarried:
12.4% (12)
Women who did not give birth in the past 12 months Now married:
25.4% (213)Unmarried:
74.6% (624)
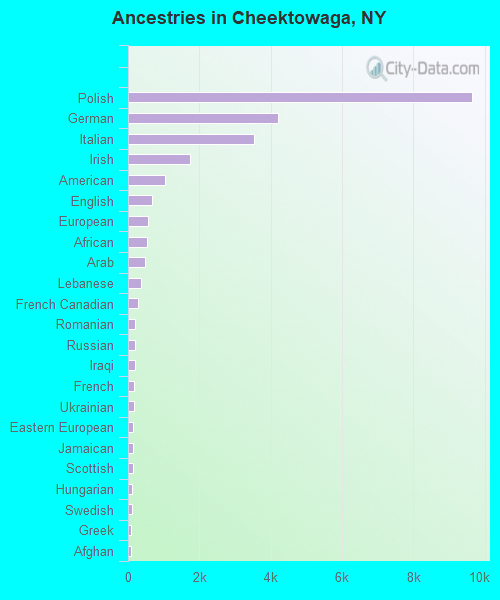
Ancestries in Cheektowaga
9,644 25.6% Polish4,215 11.2% German3,533 9.4% Italian1,746 4.6% Irish1,043 2.8% American673 1.8% English569 1.5% European522 1.4% African465 1.2% Arab368 1.0% Lebanese281 0.7% French Canadian198 0.5% Romanian191 0.5% Russian185 0.5% Iraqi170 0.5% French159 0.4% Ukrainian150 0.4% Eastern European138 0.4% Jamaican137 0.4% Scottish121 0.3% Hungarian102 0.3% Swedish97 0.3% Greek96 0.3% Afghan85 0.2% Scotch-Irish85 0.2% Czechoslovakian62 0.2% West Indian58 0.2% Haitian57 0.2% Bulgarian55 0.1% British55 0.1% German Russian49 0.1% Turkish47 0.1% Dutch46 0.1% Armenian42 0.1% Ethiopian41 0.1% Norwegian35 0.09% South African34 0.09% Czech30 0.08% Jordanian30 0.08% Scandinavian27 0.07% Serbian27 0.07% Welsh20 0.05% Canadian16 0.04% Nigerian14 0.04% Lithuanian13 0.03% Swiss13 0.03% Finnish12 0.03% Slavic12 0.03% Brazilian11 0.03% Pennsylvania German11 0.03% Slovak10 0.03% Croatian9 0.02% Barbadian9 0.02% British West Indian7 0.02% Portuguese6 0.02% Syrian6 0.02% Ghanaian4 0.01% Estonian4 0.01% Northern European4 0.01% Iranian
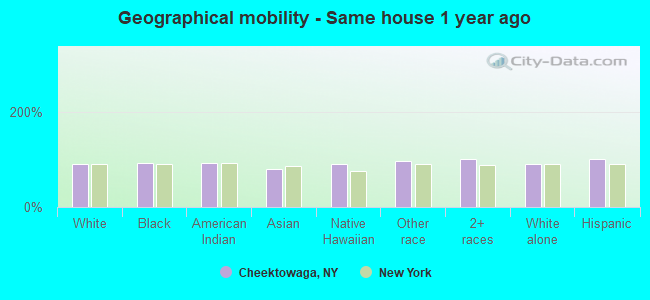
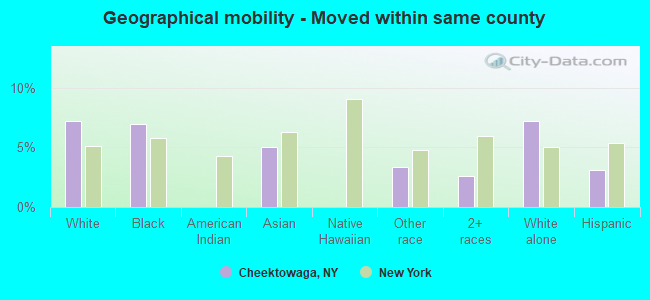
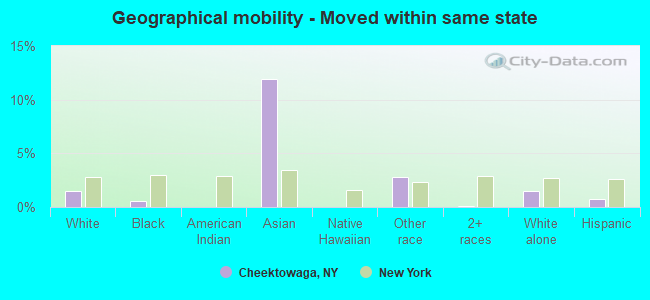
Geographical mobility in Cheektowaga Same house 1 year ago 46,968 91.1% White (Caucasian)9,288 92.0% Black or African American256 93.0% American Indian / Alaska Native1,959 78.5% Asian36 89.7% Native Hawaiian / Pacific Islander1,066 97.0% Other race4,414 100.0% Two or more races45,775 91.1% White alone, not Hispanic / Latino3,320 99.5% Hispanic or LatinoMoved within same county 3,720 7.2% White / Caucasian705 7.0% Black or African American126 5.1% Asian37 3.4% Other race115 2.6% Two or more races3,621 7.2% White alone, not Hispanic / Latino103 3.1% Hispanic or LatinoMoved within same state 766 1.5% White / Caucasian54 0.5% Black or African American298 12.0% Asian31 2.8% Other race4 0.1% Two or more races766 1.5% White alone, not Hispanic / Latino24 0.7% Hispanic or LatinoMoved from different state 88 0.2% White / Caucasian128 1.3% Black or African American16 5.7% American Indian / Alaska Native37 1.5% Asian34 0.8% Two or more races88 0.2% White alone, not Hispanic / Latino5 0.2% Hispanic or LatinoMoved from abroad 23 0.9% Asian18 1.6% Other race
Children Nativity (place of birth) in Cheektowaga
Children under 6 years - Living with two parents Both parents native 2,737 99.1% Native24 0.9% Foreign-bornBoth parents foreign-born 383 85.2% Native66 14.8% Foreign-bornOne native, one foreign-born parent 125 100.0% NativeChildren under 6 years - Living with one parent Native parent 1,026 100.0% NativeForeign-born parent 4 100.0% NativeChildren 6 to 17 years - Living with two parents Both parents native 4,042 100.0% NativeBoth parents foreign-born 360 53.4% Native313 46.6% Foreign-bornOne native, one foreign-born parent 516 100.0% NativeChildren 6 to 17 years - Living with one parent Native parent 3,238 100.0% NativeForeign-born parent 180 50.4% Native177 49.6% Foreign-born
Grandparents responsible for own grandchildren in Cheektowaga
Grandparents (30 to 59 years) White / Caucasian 46 51.1% Responsible for grandchildren44 48.9% Not responsible for grandchildrenBlack or African American 145 86.0% Responsible for grandchildren24 14.0% Not responsible for grandchildrenAsian 7 100.0% Responsible for grandchildrenOther race 10 100.0% Not responsible for grandchildrenWhite alone, not Hispanic / Latino 46 49.6% Responsible for grandchildren46 50.4% Not responsible for grandchildrenHispanic or Latino 9 100.0% Not responsible for grandchildrenGrandparents (60 years and over) White / Caucasian 70 37.1% Responsible for grandchildren118 62.9% Not responsible for grandchildrenBlack or African American 22 25.0% Responsible for grandchildren67 75.0% Not responsible for grandchildrenAsian 23 45.6% Responsible for grandchildren27 54.4% Not responsible for grandchildrenWhite alone, not Hispanic / Latino 71 38.1% Responsible for grandchildren116 61.9% Not responsible for grandchildrenHispanic or Latino 5 100.0% Responsible for grandchildren