Races in Chambers Estates, Florida (FL) Detailed Stats
Ancestries, Foreign-born residents, place of birth

Discuss Chambers Estates, Florida races on our local forum with over 2,400,000 registered users
24.9% of Chambers Estates, FL residents are foreign-born (15.9% born in Latin America, 5.8% born in Europe), which is 15.6% greater than the foreign-born rate of 21.0% across the entire state of Florida.
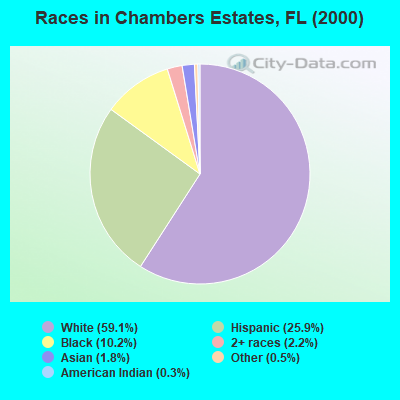
Race distribution in Chambers Estates

- 2,10259.1%White alone
- 92125.9%Hispanic
- 36310.2%Black alone
- 782.2%Two or more races
- 651.8%Asian alone
- 170.5%Other race alone
- 100.3%American Indian alone
2000
2022
-
- 10,458,50965.4%White alone
- 2,682,71516.8%Hispanic
- 2,264,26814.2%Black alone
- 261,6931.6%Asian alone
- 236,9541.5%Two or more races
- 42,3580.3%American Indian alone
- 28,9940.2%Other race alone
- 6,8870.04%Native Hawaiian and Other
Pacific Islander alone

-
- 11,309,40350.8%White alone
- 6,025,03927.1%Hispanic
- 3,241,01514.6%Black alone
- 861,6303.9%Two or more races
- 623,6922.8%Asian alone
- 152,0540.7%Other race alone
- 22,5040.1%American Indian alone
- 9,4860.04%Native Hawaiian and Other
Pacific Islander alone

Income and house value in Chambers Estates
- Median household income in 2022
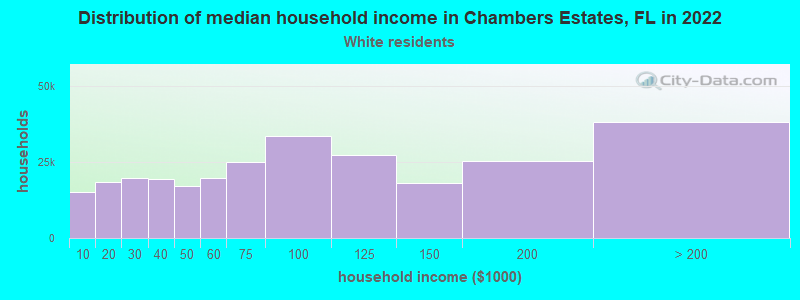
- $70,907White non-Hispanic householders
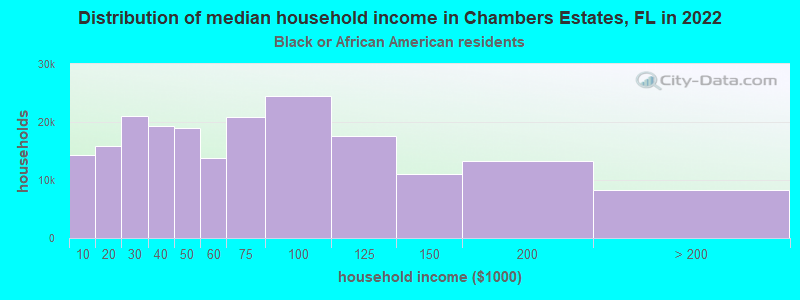
- $61,442Black householders
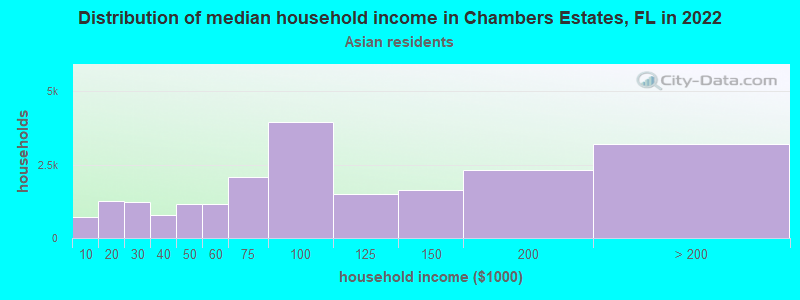
- $76,447Asian householders
- $120,544Some other race householders
- $87,573Two or more races householders
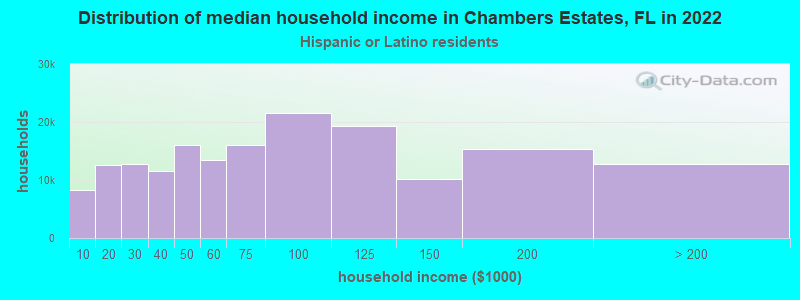
- $52,121Hispanic or Latino race householders
- Median 2022 house value
- $372,825White Non-Hispanic householders
- $303,088Asian householders
- $459,805Two or more races householders
- $367,078Hispanic or Latino householders
Household income for White non-Hispanic householders
Household income for Black householders
Household income for Asian householders
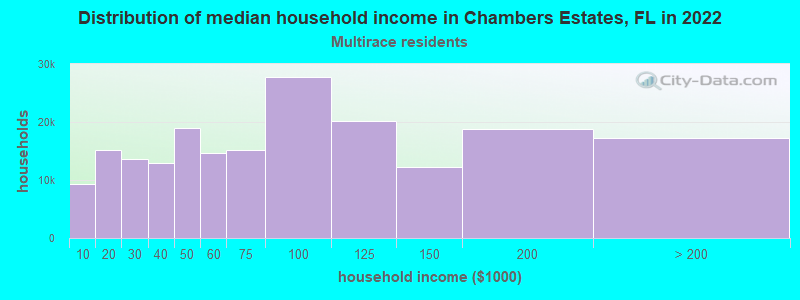
Household income for Two or more races householders
Household income for Hispanic or Latino race householders
Foreign-born residents in Chambers Estates
885 residents are foreign born (15.9% Latin America, 5.8% Europe).
| This city: | 24.9% |
| Florida: | 16.7% |
Ancestries in Chambers Estates

- 1,31036.0%Other
- 37610.3%Italian
- 36810.1%United States
- 3178.7%Irish
- 3008.3%German
- 2216.1%West Indian
- 1664.6%Polish
- 1323.6%French
- 1243.4%English
- 822.3%Portuguese
- 571.6%Dutch
- 541.5%Hungarian
- 461.3%Russian
- 290.8%French Canadian
- 230.6%Greek
- 160.4%Czech
- 100.3%Subsaharan African
- 40.1%Arab

Zip codes: 33314.