Races in Chalco, Nebraska (NE) Detailed Stats
Data:
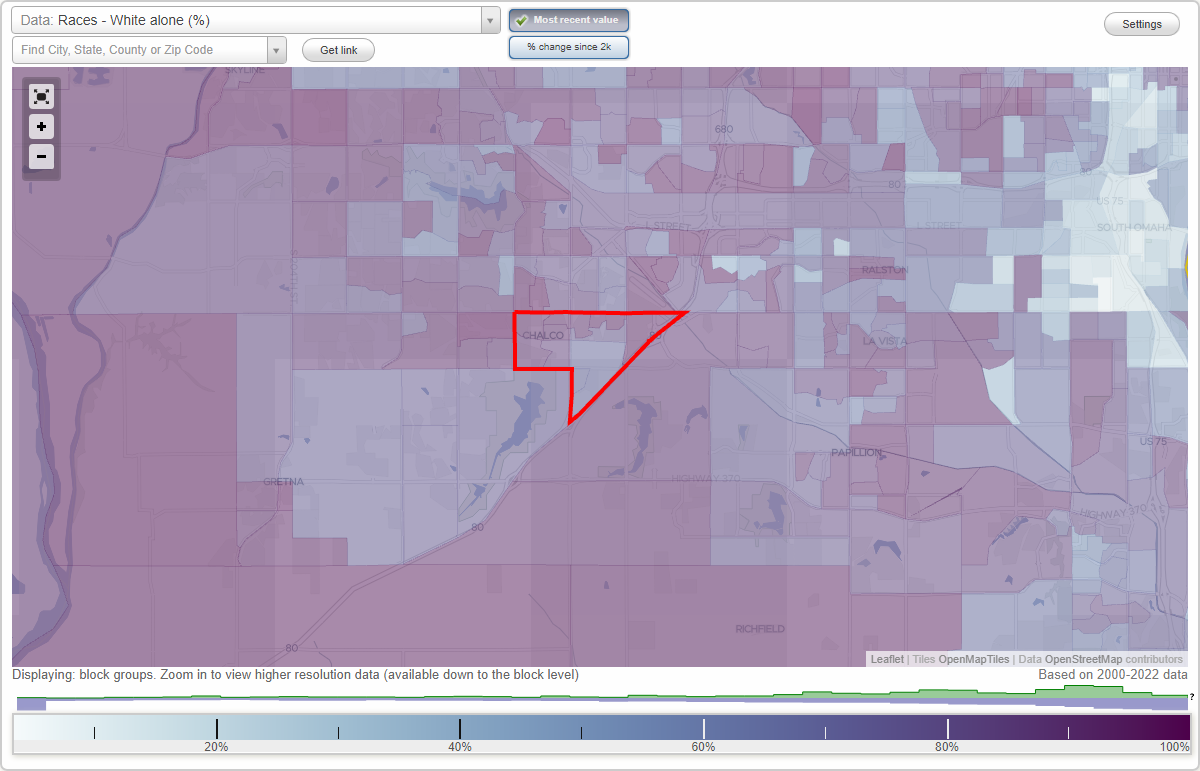
Races - White alone (%)
Races - White alone (% change since 2000)
Races - Black alone (%)
Races - Black alone (% change since 2000)
Races - American Indian alone (%)
Races - American Indian alone (% change since 2000)
Races - Asian alone (%)
Races - Asian alone (% change since 2000)
Races - Hispanic (%)
Races - Hispanic (% change since 2000)
Races - Native Hawaiian and Other Pacific Islander alone (%)
Races - Native Hawaiian and Other Pacific Islander alone (% change since 2000)
Races - Two or more races(%)
Races - Two or more races(% change since 2000)
Races - Other race alone (%)
Races - Other race alone (% change since 2000)
Racial diversity
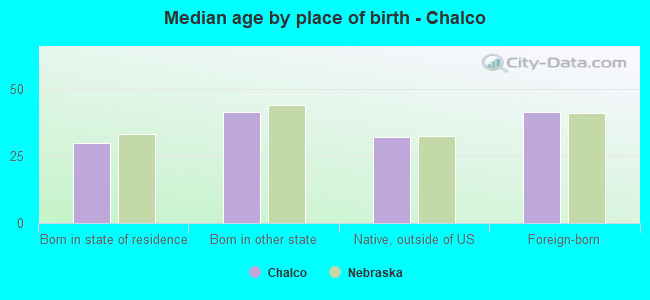
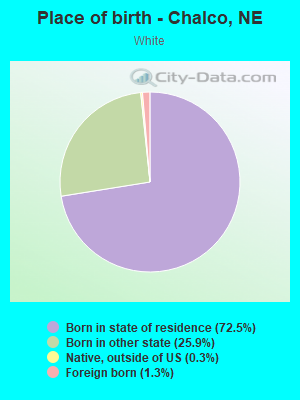
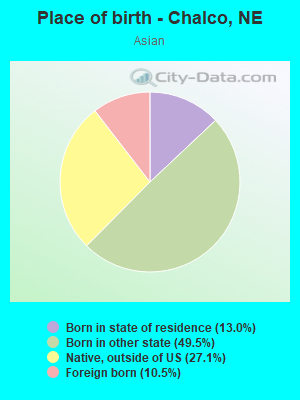
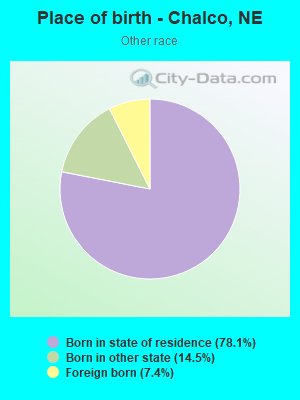
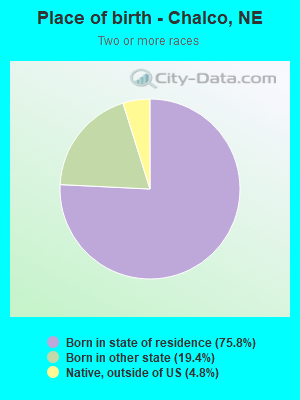
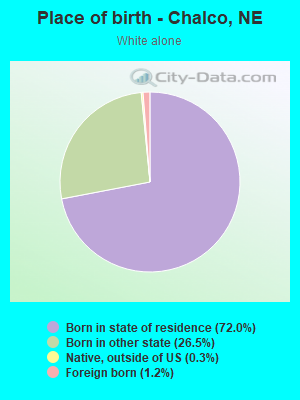
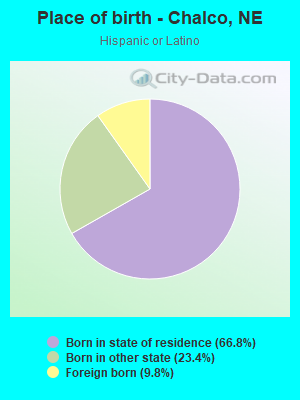
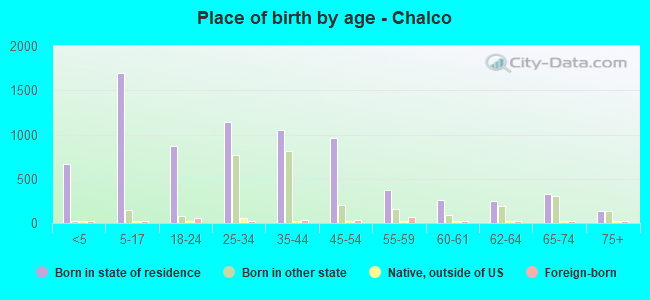
Place of birth - Born in state of residence (%)
Place of birth - Born in state of residence (%) - White
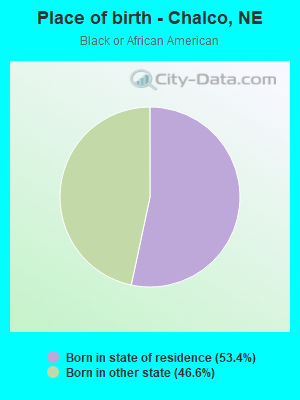
Place of birth - Born in state of residence (%) - Black or African American
Place of birth - Born in state of residence (%) - Asian
Place of birth - Born in state of residence (%) - Hispanic or Latino
Place of birth - Born in state of residence (%) - American Indian and Alaska Native
Place of birth - Born in state of residence (%) - Multirace
Place of birth - Born in state of residence (%) - Other Race
Place of birth - Born in other state (%)
Place of birth - Born in other state (%) - White
Place of birth - Born in other state (%) - Black or African American
Place of birth - Born in other state (%) - Asian
Place of birth - Born in other state (%) - Hispanic or Latino
Place of birth - Born in other state (%) - American Indian and Alaska Native
Place of birth - Born in other state (%) - Multirace
Place of birth - Born in other state (%) - Other Race
Place of birth - Native, outside of US (%)
Place of birth - Native, outside of US (%) - White
Place of birth - Native, outside of US (%) - Black or African American
Place of birth - Native, outside of US (%) - Asian
Place of birth - Native, outside of US (%) - Hispanic or Latino
Place of birth - Native, outside of US (%) - American Indian and Alaska Native
Place of birth - Native, outside of US (%) - Multirace
Place of birth - Native, outside of US (%) - Other Race
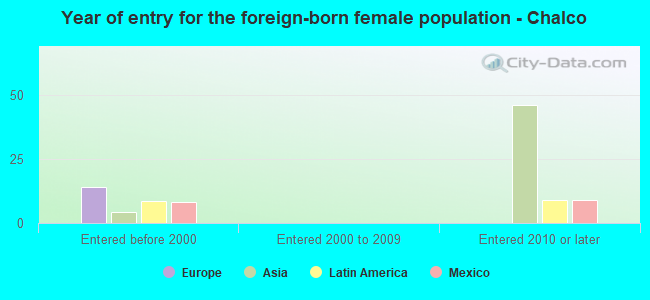
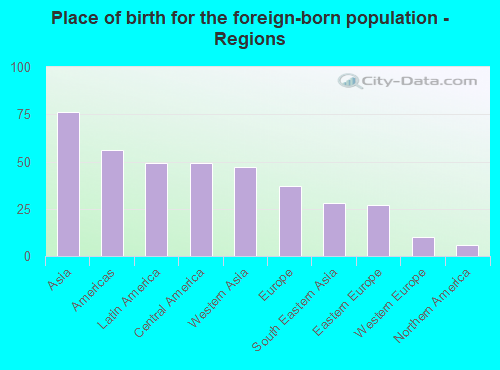
Place of birth - Foreign born (%)
Place of birth - Foreign born (%) - White
Place of birth - Foreign born (%) - Black or African American
Place of birth - Foreign born (%) - Asian
Place of birth - Foreign born (%) - Hispanic or Latino
Place of birth - Foreign born (%) - American Indian and Alaska Native
Place of birth - Foreign born (%) - Multirace
Place of birth - Foreign born (%) - Other Race
Residents speaking English at home (%)
Residents speaking English at home - Born in the United States (%)
Residents speaking English at home - Native, born elsewhere (%)
Residents speaking English at home - Foreign born (%)
Residents speaking Spanish at home (%)
Residents speaking Spanish at home - Born in the United States (%)
Residents speaking Spanish at home - Native, born elsewhere (%)
Residents speaking Spanish at home - Foreign born (%)
Residents speaking other language at home (%)
Residents speaking other language at home - Born in the United States (%)
Residents speaking other language at home - Native, born elsewhere (%)
Residents speaking other language at home - Foreign born (%)
Marital status - Never married (%)
Marital status - Now married (%)
Marital status - Separated (%)
Marital status - Widowed (%)
Marital status - Divorced (%)
Ancestries Reported - Arab (%)
Ancestries Reported - Czech (%)
Ancestries Reported - Danish (%)
Ancestries Reported - Dutch (%)
Ancestries Reported - English (%)
Ancestries Reported - French (%)
Ancestries Reported - French Canadian (%)
Ancestries Reported - German (%)
Ancestries Reported - Greek (%)
Ancestries Reported - Hungarian (%)
Ancestries Reported - Irish (%)
Ancestries Reported - Italian (%)
Ancestries Reported - Lithuanian (%)
Ancestries Reported - Norwegian (%)
Ancestries Reported - Polish (%)
Ancestries Reported - Portuguese (%)
Ancestries Reported - Russian (%)
Ancestries Reported - Scotch-Irish (%)
Ancestries Reported - Scottish (%)
Ancestries Reported - Slovak (%)
Ancestries Reported - Subsaharan African (%)
Ancestries Reported - Swedish (%)
Ancestries Reported - Swiss (%)
Ancestries Reported - Ukrainian (%)
Ancestries Reported - United States (%)
Ancestries Reported - Welsh (%)
Ancestries Reported - West Indian (%)
Ancestries Reported - Other (%)
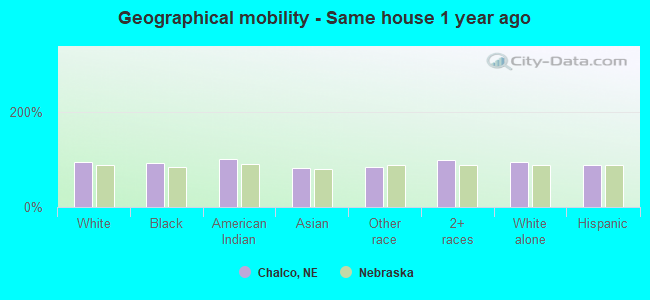
Geographical mobility - Same house 1 year ago (%)
Geographical mobility - Same house 1 year ago (%) - White
Geographical mobility - Same house 1 year ago (%) - Black or African American
Geographical mobility - Same house 1 year ago (%) - Asian
Geographical mobility - Same house 1 year ago (%) - Hispanic or Latino
Geographical mobility - Same house 1 year ago (%) - American Indian and Alaska Native
Geographical mobility - Same house 1 year ago (%) - Multirace
Geographical mobility - Same house 1 year ago (%) - Other Race
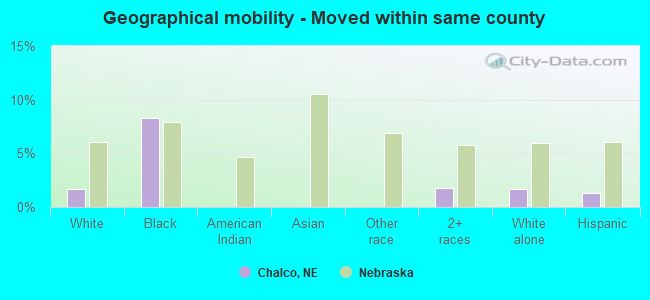
Geographical mobility - Moved within same county (%)
Geographical mobility - Moved within same county (%) - White
Geographical mobility - Moved within same county (%) - Black or African American
Geographical mobility - Moved within same county (%) - Asian
Geographical mobility - Moved within same county (%) - Hispanic or Latino
Geographical mobility - Moved within same county (%) - American Indian and Alaska Native
Geographical mobility - Moved within same county (%) - Multirace
Geographical mobility - Moved within same county (%) - Other Race
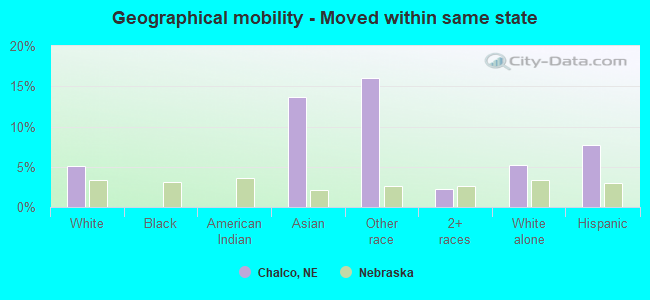
Geographical mobility - Moved from different county within same state (%)
Geographical mobility - Moved from different county within same state (%) - White
Geographical mobility - Moved from different county within same state (%) - Black or African American
Geographical mobility - Moved from different county within same state (%) - Asian
Geographical mobility - Moved from different county within same state (%) - Hispanic or Latino
Geographical mobility - Moved from different county within same state (%) - American Indian and Alaska Native
Geographical mobility - Moved from different county within same state (%) - Multirace
Geographical mobility - Moved from different county within same state (%) - Other Race
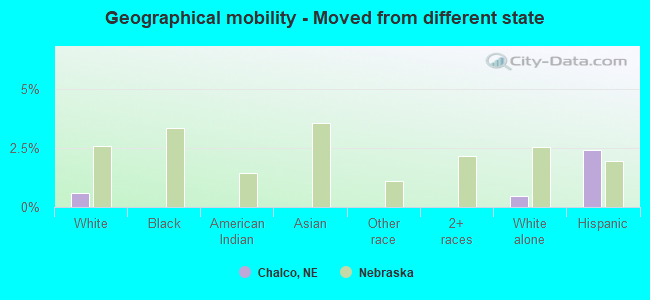
Geographical mobility - Moved from different state (%)
Geographical mobility - Moved from different state (%) - White
Geographical mobility - Moved from different state (%) - Black or African American
Geographical mobility - Moved from different state (%) - Asian
Geographical mobility - Moved from different state (%) - Hispanic or Latino
Geographical mobility - Moved from different state (%) - American Indian and Alaska Native
Geographical mobility - Moved from different state (%) - Multirace
Geographical mobility - Moved from different state (%) - Other Race
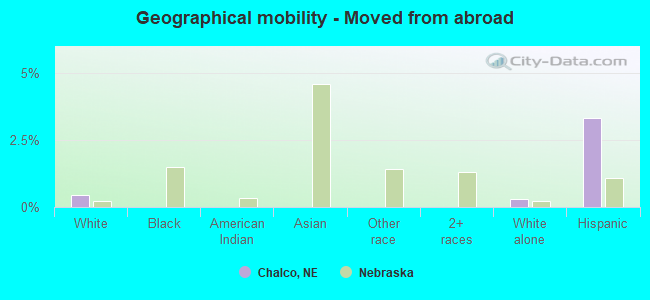
Geographical mobility - Moved from abroad (%)
Geographical mobility - Moved from abroad (%) - White
Geographical mobility - Moved from abroad (%) - Black or African American
Geographical mobility - Moved from abroad (%) - Asian
Geographical mobility - Moved from abroad (%) - Hispanic or Latino
Geographical mobility - Moved from abroad (%) - American Indian and Alaska Native
Geographical mobility - Moved from abroad (%) - Multirace
Geographical mobility - Moved from abroad (%) - Other Race
Place of birth for the foreign-born population - Ireland (%)
Place of birth for the foreign-born population - Denmark (%)
Place of birth for the foreign-born population - Norway (%)
Place of birth for the foreign-born population - Sweden (%)
Place of birth for the foreign-born population - United Kingdom (%)
Place of birth for the foreign-born population - England (%)
Place of birth for the foreign-born population - Scotland (%)
Place of birth for the foreign-born population - Other Northern Europe (%)
Place of birth for the foreign-born population - Austria (%)
Place of birth for the foreign-born population - Belgium (%)
Place of birth for the foreign-born population - France (%)
Place of birth for the foreign-born population - Germany (%)
Place of birth for the foreign-born population - Netherlands (%)
Place of birth for the foreign-born population - Switzerland (%)
Place of birth for the foreign-born population - Other Western Europe (%)
Place of birth for the foreign-born population - Greece (%)
Place of birth for the foreign-born population - Italy (%)
Place of birth for the foreign-born population - Portugal (%)
Place of birth for the foreign-born population - Spain (%)
Place of birth for the foreign-born population - Other Southern Europe (%)
Place of birth for the foreign-born population - Albania (%)
Place of birth for the foreign-born population - Belarus (%)
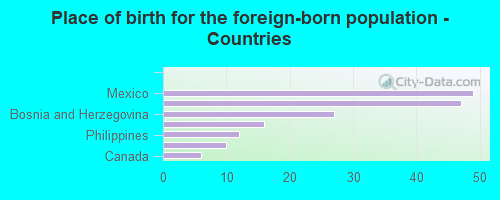
Place of birth for the foreign-born population - Bosnia and Herzegovina (%)
Place of birth for the foreign-born population - Bulgaria (%)
Place of birth for the foreign-born population - Croatia (%)
Place of birth for the foreign-born population - Czechoslovakia (%)
Place of birth for the foreign-born population - Hungary (%)
Place of birth for the foreign-born population - Latvia (%)
Place of birth for the foreign-born population - Lithuania (%)
Place of birth for the foreign-born population - North Macedonia (Macedonia) (%)
Place of birth for the foreign-born population - Moldova (%)
Place of birth for the foreign-born population - Poland (%)
Place of birth for the foreign-born population - Romania (%)
Place of birth for the foreign-born population - Russia (%)
Place of birth for the foreign-born population - Serbia (%)
Place of birth for the foreign-born population - Ukraine (%)
Place of birth for the foreign-born population - Other Eastern Europe (%)
Place of birth for the foreign-born population - China (%)
Place of birth for the foreign-born population - Hong Kong (%)
Place of birth for the foreign-born population - Taiwan (%)
Place of birth for the foreign-born population - Japan (%)
Place of birth for the foreign-born population - Korea (%)
Place of birth for the foreign-born population - Other Eastern Asia (%)
Place of birth for the foreign-born population - Afghanistan (%)
Place of birth for the foreign-born population - Bangladesh (%)
Place of birth for the foreign-born population - India (%)
Place of birth for the foreign-born population - Iran (%)
Place of birth for the foreign-born population - Kazakhstan (%)
Place of birth for the foreign-born population - Nepal (%)
Place of birth for the foreign-born population - Pakistan (%)
Place of birth for the foreign-born population - Sri Lanka (%)
Place of birth for the foreign-born population - Uzbekistan (%)
Place of birth for the foreign-born population - Other South Central Asia (%)
Place of birth for the foreign-born population - Burma (%)
Place of birth for the foreign-born population - Cambodia (%)
Place of birth for the foreign-born population - Indonesia (%)
Place of birth for the foreign-born population - Laos (%)
Place of birth for the foreign-born population - Malaysia (%)
Place of birth for the foreign-born population - Philippines (%)
Place of birth for the foreign-born population - Singapore (%)
Place of birth for the foreign-born population - Thailand (%)
Place of birth for the foreign-born population - Vietnam (%)
Place of birth for the foreign-born population - Other South Eastern Asia (%)
Place of birth for the foreign-born population - Armenia (%)
Place of birth for the foreign-born population - Iraq (%)
Place of birth for the foreign-born population - Israel (%)
Place of birth for the foreign-born population - Jordan (%)
Place of birth for the foreign-born population - Kuwait (%)
Place of birth for the foreign-born population - Lebanon (%)
Place of birth for the foreign-born population - Saudi Arabia (%)
Place of birth for the foreign-born population - Syria (%)
Place of birth for the foreign-born population - Turkey (%)
Place of birth for the foreign-born population - Yemen (%)
Place of birth for the foreign-born population - Other Western Asia (%)
Place of birth for the foreign-born population - Eritrea (%)
Place of birth for the foreign-born population - Ethiopia (%)
Place of birth for the foreign-born population - Kenya (%)
Place of birth for the foreign-born population - Somalia (%)
Place of birth for the foreign-born population - Uganda (%)
Place of birth for the foreign-born population - Zimbabwe (%)
Place of birth for the foreign-born population - Other Eastern Africa (%)
Place of birth for the foreign-born population - Cameroon (%)
Place of birth for the foreign-born population - Congo (%)
Place of birth for the foreign-born population - Democratic Republic of Congo (Zaire) (%)
Place of birth for the foreign-born population - Other Middle Africa (%)
Place of birth for the foreign-born population - Egypt (%)
Place of birth for the foreign-born population - Morocco (%)
Place of birth for the foreign-born population - Sudan (%)
Place of birth for the foreign-born population - Other Northern Africa (%)
Place of birth for the foreign-born population - South Africa (%)
Place of birth for the foreign-born population - Other Southern Africa (%)
Place of birth for the foreign-born population - Cabo Verde (%)
Place of birth for the foreign-born population - Ghana (%)
Place of birth for the foreign-born population - Liberia (%)
Place of birth for the foreign-born population - Nigeria (%)
Place of birth for the foreign-born population - Senegal (%)
Place of birth for the foreign-born population - Sierra Leone (%)
Place of birth for the foreign-born population - Other Western Africa (%)
Place of birth for the foreign-born population - Australia (%)
Place of birth for the foreign-born population - New Zealand (%)
Place of birth for the foreign-born population - Fiji (%)
Place of birth for the foreign-born population - Micronesia (%)
Place of birth for the foreign-born population - Bahamas (%)
Place of birth for the foreign-born population - Barbados (%)
Place of birth for the foreign-born population - Cuba (%)
Place of birth for the foreign-born population - Dominica (%)
Place of birth for the foreign-born population - Dominican Republic (%)
Place of birth for the foreign-born population - Grenada (%)
Place of birth for the foreign-born population - Haiti (%)
Place of birth for the foreign-born population - Jamaica (%)
Place of birth for the foreign-born population - St. Vincent and the Grenadines (%)
Place of birth for the foreign-born population - Trinidad and Tobago (%)
Place of birth for the foreign-born population - West Indies (%)
Place of birth for the foreign-born population - Other Caribbean (%)
Place of birth for the foreign-born population - Belize (%)
Place of birth for the foreign-born population - Costa Rica (%)
Place of birth for the foreign-born population - El Salvador (%)
Place of birth for the foreign-born population - Guatemala (%)
Place of birth for the foreign-born population - Honduras (%)
Place of birth for the foreign-born population - Mexico (%)
Place of birth for the foreign-born population - Nicaragua (%)
Place of birth for the foreign-born population - Panama (%)
Place of birth for the foreign-born population - Other Central America (%)
Place of birth for the foreign-born population - Argentina (%)
Place of birth for the foreign-born population - Bolivia (%)
Place of birth for the foreign-born population - Brazil (%)
Place of birth for the foreign-born population - Chile (%)
Place of birth for the foreign-born population - Colombia (%)
Place of birth for the foreign-born population - Ecuador (%)
Place of birth for the foreign-born population - Guyana (%)
Place of birth for the foreign-born population - Peru (%)
Place of birth for the foreign-born population - Uruguay (%)
Place of birth for the foreign-born population - Venezuela (%)
Place of birth for the foreign-born population - Other South America (%)
Place of birth for the foreign-born population - Canada (%)
Place of birth for the foreign-born population - Other Northern America (%)
Place of birth for the foreign-born population - Other (%)
According to 2022 data, the most numerous races in Chalco, NE are White alone (9,133 residents), Hispanic (636 residents), and Black alone (121 residents). 97.9% of Chalco residents speak English at home. 1.6% of Chalco, NE residents are foreign-born , which is 342.5% less than the foreign-born rate of 7.0% across the entire state of Nebraska.
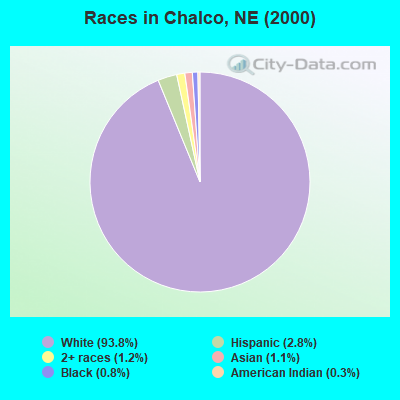
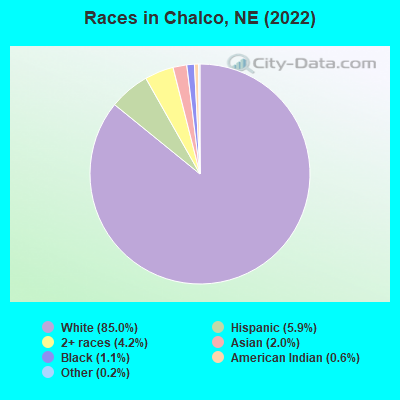
Race distribution in Chalco
2000 2022
1,494,494 87.3% White alone 94,425 5.5% Hispanic 67,537 3.9% Black alone 21,677 1.3% Asian alone 17,696 1.0% Two or more races 13,460 0.8% American Indian alone 1,327 0.08% Other race alone 647 0.04% Native Hawaiian and Other
1,492,005 75.8% White alone 241,898 12.3% Hispanic 89,520 4.5% Black alone 76,499 3.9% Two or more races 49,261 2.5% Asian alone 10,249 0.5% American Indian alone 7,425 0.4% Other race alone 1,066 0.05% Native Hawaiian and Other
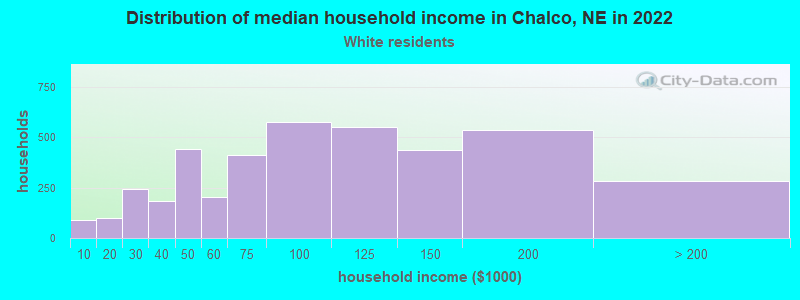
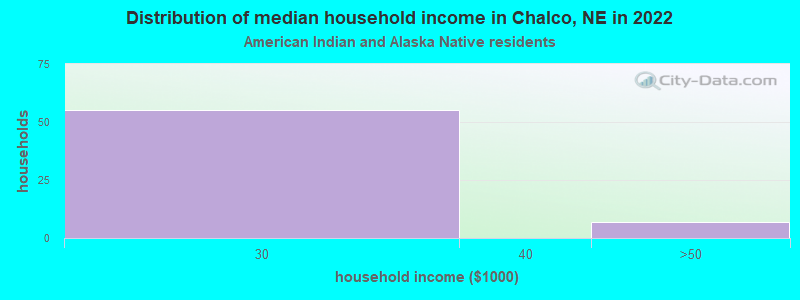
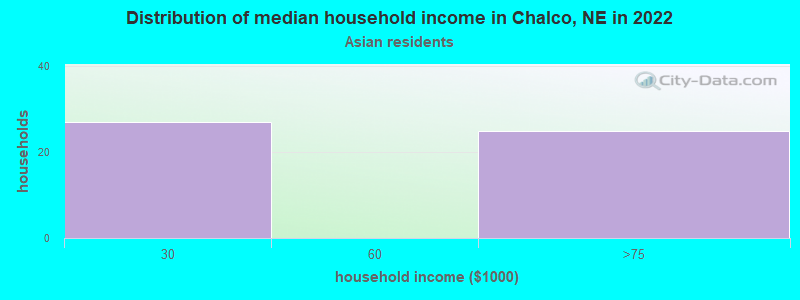
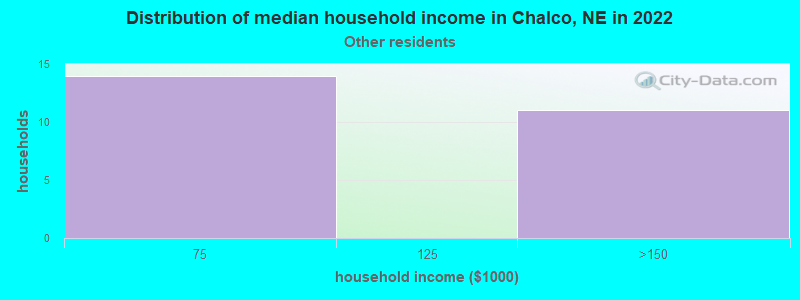
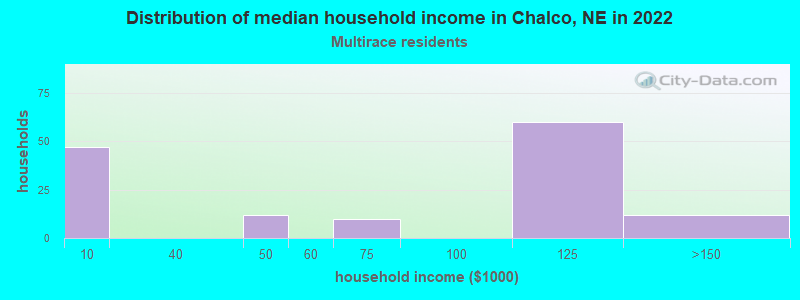
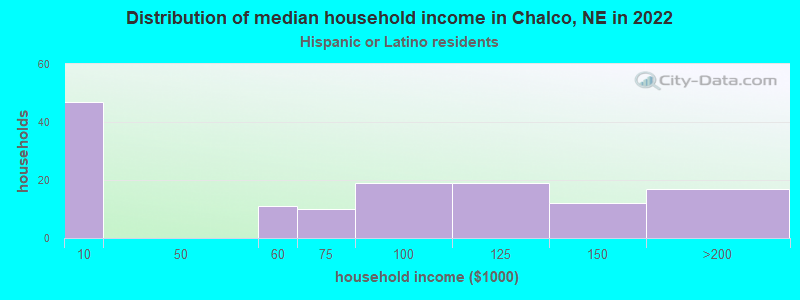
Income and house value in Chalco Median household income in 2022 $86,873 White non-Hispanic householders$88,550 Hispanic or Latino race householdersMedian 2022 house value $229,157 White Non-Hispanic householders$242,885 Black or African American householders $253,023 Asian householders$212,683 Some other race householders$179,523 Two or more races householders$208,247 Hispanic or Latino householders
Median age by race in Chalco
36.9 Median age for White residents36.7 37.2 24.1 Median age for Black or African American residents27.2 -709,401,708.7 35.6 Median age for American Indian / Alaska Native residents-1,037,707,389.6 -744,510,977.3 36.9 Median age for Asian residents39.7 40.1 -699,999,999.3 Median age for Native Hawaiian / Pacific Islander residents-672,108,842.9 -689,223,057.0 30.9 Median age for Other race residents26.7 11.8 30.3 Median age for Two or more races residents23.2 32.6 37.5 Median age for White alone residents37.0 38.2 27.5 Median age for Hispanic or Latino residents31.3 19.5
Owner/renter occupied households by race in Chalco
House owners and renters - White residents 3,174 77.0% Owner occupied950 23.0% Renter occupiedHouse owners and renters - Black or African American residents 23 100.0% Renter occupiedHouse owners and renters - American Indian / Alaska Native residents 75 100.0% Owner occupiedHouse owners and renters - Asian residents 28 55.5% Owner occupied22 44.5% Renter occupiedHouse owners and renters - Other race residents 9 33.6% Owner occupied17 66.4% Renter occupiedHouse owners and renters - Two or more races residents 66 50.4% Owner occupied65 49.6% Renter occupiedHouse owners and renters - White alone residents 3,155 75.8% Owner occupied1,005 24.2% Renter occupiedHouse owners and renters - Hispanic or Latino residents 99 79.7% Owner occupied25 20.3% Renter occupied
Language usage in Chalco
English speakers - Total 97.9% of residents of Chalco speak English at home.
0.8% of residents speak Spanish at home 19 22.4% Speak English very well66 77.6% Speak English less than very well1.2% of residents speak other language at home 70 58.3% Speak English very well50 41.7% Speak English less than very well
English speakers - Born in the United States 99.1% of residents of Chalco speak English at home.
0.8% of residents speak other language at home 9 39.1% Speak English very well14 60.9% Speak English less than very well
English speakers - Native, born elsewhere 81.3% of residents of Chalco speak English at home.
15.0% of residents speak other language at home 16 100.0% Speak English very well
English speakers - Foreign-born 16.3% of residents of Chalco speak English at home.
30.5% of residents speak Spanish at home 14 24.1% Speak English very well44 75.9% Speak English less than very well48.4% of residents speak other language at home 56 60.9% Speak English very well36 39.1% Speak English less than very well
White (Caucasian) - Speak only English Native:
100.0% (8,642)Foreign-born:
16.8% (21)
White (Caucasian) - Speak another language Native:
0.3% (29)Foreign-born:
74.4% (94)
Asian - Speak only English Native:
100.0% (220)Foreign-born:
22.2% (6)
White alone - Speak only English Native:
99.9% (8,518)Foreign-born:
17.8% (20)
White alone - Speak another language Native:
0.3% (22)Foreign-born:
82.3% (95)
Hispanic or Latino - Speak another language Native:
2.9% (15)Foreign-born:
100.0% (61)
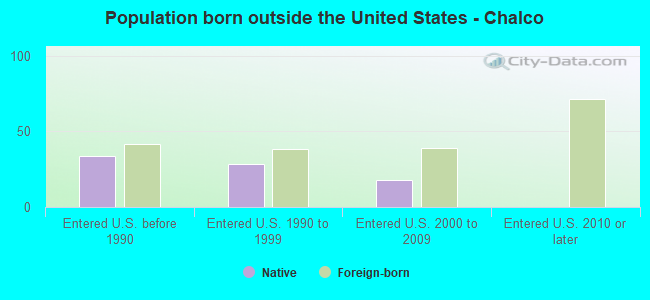
Foreign-born residents in Chalco 170 residents are foreign born
This city:
1.6%Nebraska:
7.5%
Marital status for residents in Chalco Marital status - White (Caucasian) population 15 years and over
Males 34.6% Never married54.7% Now married1.1% Separated0.4% Widowed9.1% DivorcedFemales 27.0% Never married57.5% Now married0.7% Separated4.0% Widowed10.8% DivorcedWomen who gave birth in the past 12 months Now married:
87.4% (100)Unmarried:
12.6% (14)
Women who did not give birth in the past 12 months Now married:
52.5% (1,098)Unmarried:
47.5% (994)
Marital status - Black or African American population 15 years and over
Males 62.7% Never married37.3% Now married0.0% Separated0.0% Widowed0.0% DivorcedFemales 100.0% Never married0.0% Now married0.0% Separated0.0% Widowed0.0% DivorcedWomen who did not give birth in the past 12 months Now married:
0.0% (0)Unmarried:
100.0% (27)
Marital status - American Indian / Alaska Native population 15 years and over
Males 0.0% Never married100.0% Now married0.0% Separated0.0% Widowed0.0% DivorcedFemales 0.0% Never married100.0% Now married0.0% Separated0.0% Widowed0.0% DivorcedWomen who did not give birth in the past 12 months Now married:
100.0% (32)Unmarried:
0.0% (0)
Marital status - Asian population 15 years and over
Males 33.7% Never married56.8% Now married0.0% Separated0.0% Widowed9.5% DivorcedFemales 39.3% Never married60.7% Now married0.0% Separated0.0% Widowed0.0% DivorcedWomen who did not give birth in the past 12 months Now married:
52.2% (12)Unmarried:
47.8% (11)
Marital status - Other race population 15 years and over
Males 19.4% Never married80.6% Now married0.0% Separated0.0% Widowed0.0% DivorcedFemales 38.2% Never married61.8% Now married0.0% Separated0.0% Widowed0.0% DivorcedWomen who did not give birth in the past 12 months Now married:
40.9% (11)Unmarried:
59.1% (16)
Marital status - Two or more races population 15 years and over
Males 75.6% Never married24.4% Now married0.0% Separated0.0% Widowed0.0% DivorcedFemales 43.7% Never married27.7% Now married0.0% Separated0.0% Widowed28.6% DivorcedWomen who gave birth in the past 12 months Now married:
100.0% (8)Unmarried:
0.0% (0)
Women who did not give birth in the past 12 months Now married:
24.2% (53)Unmarried:
75.8% (168)
Marital status - White alone, not Hispanic / Latino population 15 years and over
Males 34.8% Never married54.4% Now married1.2% Separated0.4% Widowed9.2% DivorcedFemales 26.4% Never married58.2% Now married0.7% Separated4.1% Widowed10.6% DivorcedWomen who gave birth in the past 12 months Now married:
87.4% (103)Unmarried:
12.6% (15)
Women who did not give birth in the past 12 months Now married:
53.2% (1,111)Unmarried:
46.8% (977)
Marital status - Hispanic or Latino population 15 years and over
Males 33.3% Never married66.7% Now married0.0% Separated0.0% Widowed0.0% DivorcedFemales 54.3% Never married29.5% Now married0.0% Separated0.0% Widowed16.2% DivorcedWomen who did not give birth in the past 12 months Now married:
21.7% (29)Unmarried:
78.3% (106)
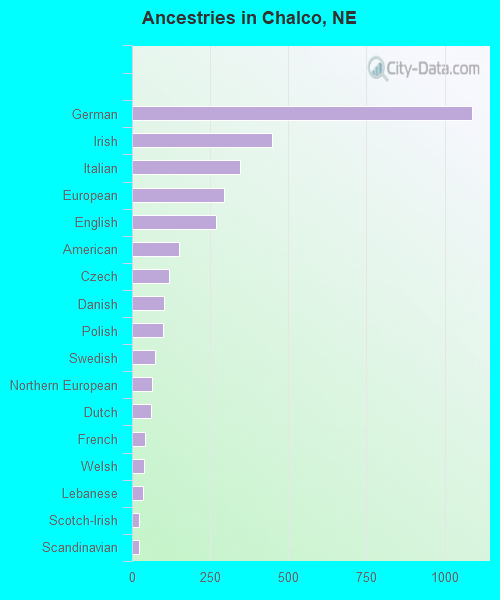
Ancestries in Chalco
1,088 26.6% German448 11.0% Irish347 8.5% Italian293 7.2% European269 6.6% English152 3.7% American120 2.9% Czech101 2.5% Danish100 2.4% Polish75 1.8% Swedish64 1.6% Northern European61 1.5% Dutch43 1.1% French38 0.9% Welsh36 0.9% Lebanese23 0.6% Scotch-Irish21 0.5% Scandinavian9 0.2% Belgian8 0.2% British6 0.1% Greek6 0.1% Norwegian3 0.07% Finnish
Children Nativity (place of birth) in Chalco
Children under 6 years - Living with two parents Both parents native 689 100.0% NativeOne native, one foreign-born parent 18 100.0% NativeChildren under 6 years - Living with one parent Native parent 215 100.0% NativeChildren 6 to 17 years - Living with two parents Both parents native 1,104 100.0% NativeChildren 6 to 17 years - Living with one parent Native parent 275 100.0% NativeForeign-born parent 9 48.9% Native10 51.1% Foreign-born
Grandparents responsible for own grandchildren in Chalco
Grandparents (30 to 59 years) White / Caucasian 13 100.0% Not responsible for grandchildrenHispanic or Latino 15 100.0% Not responsible for grandchildrenGrandparents (60 years and over) White / Caucasian 5 7.7% Responsible for grandchildren64 92.3% Not responsible for grandchildrenHispanic or Latino 4 21.7% Responsible for grandchildren15 78.3% Not responsible for grandchildren