Races in Central Point, Oregon (OR) Detailed Stats
Ancestries, Foreign-born residents, place of birth
Settings
X


Recent posts about races in Central Point, Oregon on our local forum with over 2,400,000 registered users:
 | Housing (11 replies) |
| Is the Coos Bay/Florence area the "Last Hidden Gem" of Oregon?? (106 replies) |
| Commute from Ashland to Central Point Oregon (11 replies) |
| Moving Family Medford or Grants Pass?? (65 replies) |
| Best small town to live in Oregon (34 replies) |
| Seeking info on Southern OR: Medford, Talent, Ashland (13 replies) |
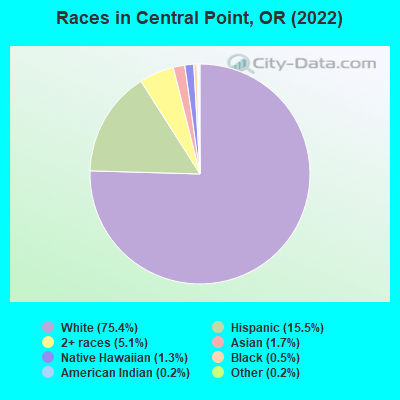
According to 2022 data, the most numerous races in Central Point, OR are White alone (14,363 residents), Hispanic (2,958 residents), and Two or more races (968 residents). 89.8% of Central Point residents speak English at home. 6.3% of Central Point, OR residents are foreign-born (4.8% born in Latin America, 1.0% born in Asia), which is 43.0% less than the foreign-born rate of 9.0% across the entire state of Oregon.
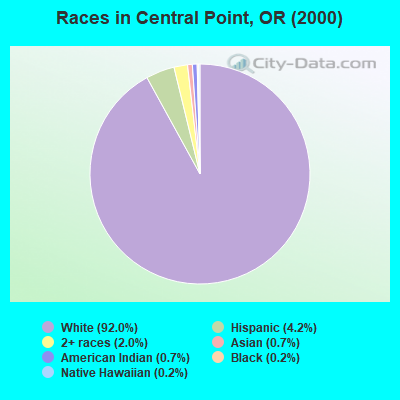
Race distribution in Central Point
2000
2022

- 11,49092.0%White alone
- 5274.2%Hispanic
- 2442.0%Two or more races
- 890.7%Asian alone
- 870.7%American Indian alone
- 300.2%Black alone
- 240.2%Native Hawaiian and Other
Pacific Islander alone - 20.02%Other race alone
-
- 14,36375.4%White alone
- 2,95815.5%Hispanic
- 9685.1%Two or more races
- 3301.7%Asian alone
- 2491.3%Native Hawaiian and Other
Pacific Islander alone - 970.5%Black alone
- 450.2%American Indian alone
- 340.2%Other race alone
2000
2022
-
- 2,857,61683.5%White alone
- 275,3148.0%Hispanic
- 100,3332.9%Asian alone
- 82,7332.4%Two or more races
- 53,3251.6%Black alone
- 40,1301.2%American Indian alone
- 7,3980.2%Native Hawaiian and Other
Pacific Islander alone - 4,5500.1%Other race alone

-
- 3,037,57171.6%White alone
- 609,53814.4%Hispanic
- 252,7446.0%Two or more races
- 191,2834.5%Asian alone
- 78,2281.8%Black alone
- 29,3990.7%American Indian alone
- 25,7310.6%Other race alone
- 15,6430.4%Native Hawaiian and Other
Pacific Islander alone

Income and house value in Central Point
- Median household income in 2022
- $79,563White non-Hispanic householders
- $113,381Asian householders
- $65,655Some other race householders
- $123,058Two or more races householders
- $83,121Hispanic or Latino race householders
- Median 2022 house value
- $383,768White Non-Hispanic householders
- $325,575American Indian or Alaska Native householders
- $456,051Asian householders
- $390,507Two or more races householders
- $290,966Hispanic or Latino householders
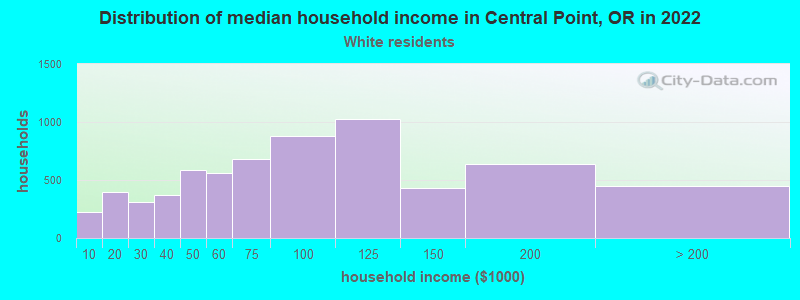
Household income for White non-Hispanic householders
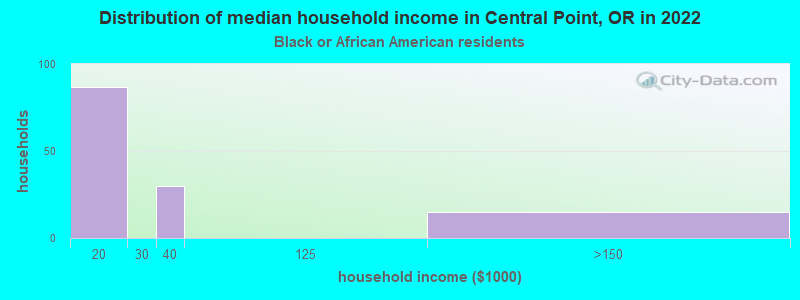
Household income for Black householders
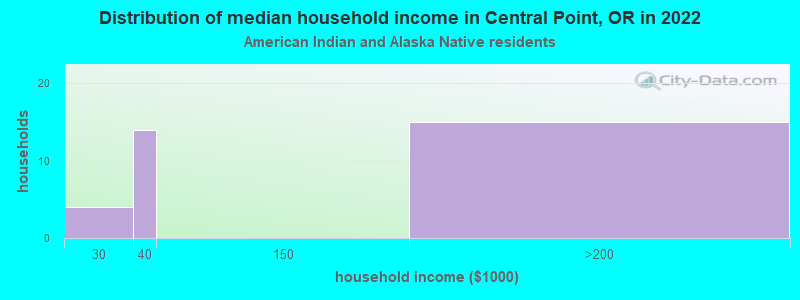
Household income for American Indian and Alaska Native householders
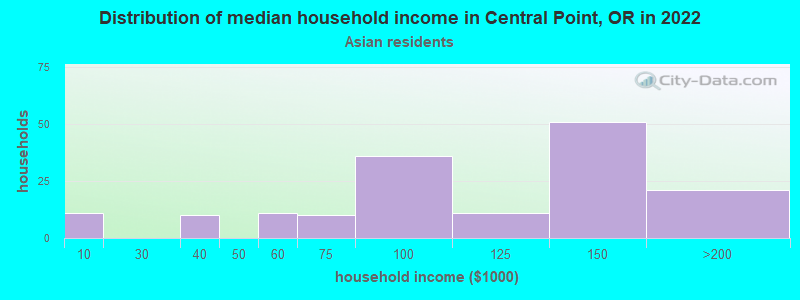
Household income for Asian householders
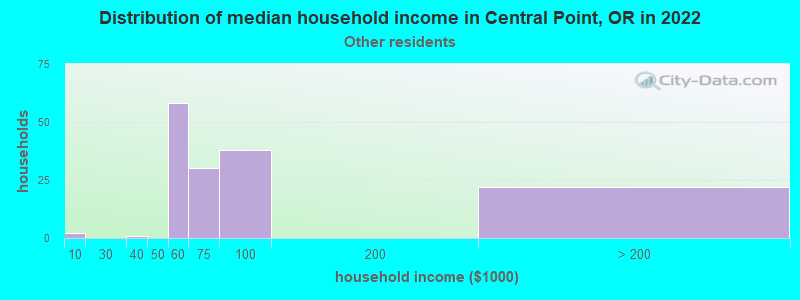
Household income for Some other race householders
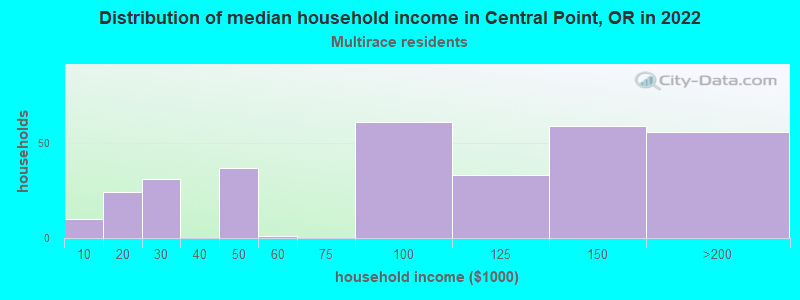
Household income for Two or more races householders
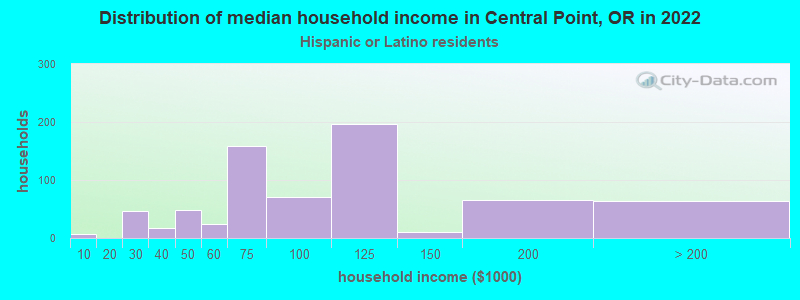
Household income for Hispanic or Latino race householders
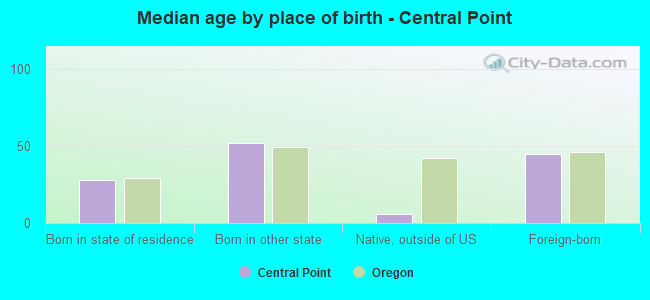
Median age by race in Central Point
- 43.5Median age for White residents
- 40.1Males
- 46.1Females
- 46.6Median age for Black or African American residents
- -668,358,713.4Males
- -1,184,713,374.6Females
- 22.7Median age for American Indian / Alaska Native residents
- 26.9Males
- 63.1Females
- 51.2Median age for Asian residents
- 35.0Males
- 53.6Females
- 22.3Median age for Native Hawaiian / Pacific Islander residents
- 21.2Males
- -774,891,774.1Females
- 39.4Median age for Other race residents
- 36.3Males
- 40.8Females
- 29.6Median age for Two or more races residents
- 35.5Males
- 28.3Females
- 43.3Median age for White alone residents
- 39.2Males
- 47.0Females
- 31.3Median age for Hispanic or Latino residents
- 28.4Males
- 33.9Females
Owner/renter occupied households by race in Central Point
- House owners and renters - White residents
- 4,62371.2%Owner occupied
- 1,86628.8%Renter occupied
- House owners and renters - Black or African American residents
- 1010.4%Owner occupied
- 8689.6%Renter occupied
- House owners and renters - American Indian / Alaska Native residents
- 1982.9%Owner occupied
- 417.1%Renter occupied
- House owners and renters - Asian residents
- 25086.1%Owner occupied
- 4013.9%Renter occupied
- House owners and renters - Native Hawaiian / Pacific Islander residents
- 70100.0%Renter occupied
- House owners and renters - Other race residents
- 15289.2%Owner occupied
- 1810.8%Renter occupied
- House owners and renters - Two or more races residents
- 19050.5%Owner occupied
- 18749.5%Renter occupied
- House owners and renters - White alone residents
- 4,39470.4%Owner occupied
- 1,85129.6%Renter occupied
- House owners and renters - Hispanic or Latino residents
- 40070.8%Owner occupied
- 16529.2%Renter occupied
Language usage in Central Point
- English speakers - Total
- 89.8% of residents of Central Point speak English at home.
- 7.5% of residents speak Spanish at home
- 94769.4%Speak English very well
- 41730.6%Speak English less than very well
- 1.9% of residents speak other language at home
- 29484.7%Speak English very well
- 5315.3%Speak English less than very well
- English speakers - Born in the United States
- 92.7% of residents of Central Point speak English at home.
- 5.0% of residents speak Spanish at home
- 39297.5%Speak English very well
- 102.5%Speak English less than very well
- 2.2% of residents speak other language at home
- 177100.0%Speak English very well
All residents speak only English at home
- English speakers - Foreign-born
- 16.5% of residents of Central Point speak English at home.
- 68.2% of residents speak Spanish at home
- 34849.6%Speak English very well
- 35450.4%Speak English less than very well
- 12.9% of residents speak other language at home
- 8060.2%Speak English very well
- 5339.8%Speak English less than very well
White (Caucasian) - Speak only English
| Native: | 96.7% (13,918) |
| Foreign-born: | 23.4% (68) |
White (Caucasian) - Speak another language
| Native: | 3.1% (453) |
| Foreign-born: | 100.0% (292) |
Asian - Speak only English
| Native: | 100.0% (68) |
| Foreign-born: | 24.0% (65) |
Other race - Speak only English
| Native: | 53.4% (294) |
| Foreign-born: | 10.2% (34) |
Other race - Speak another language
| Native: | 43.1% (237) |
| Foreign-born: | 89.4% (299) |
Two or more races - Speak only English
| Native: | 87.7% (1,210) |
| Foreign-born: | 13.6% (17) |
Two or more races - Speak another language
| Native: | 11.2% (155) |
| Foreign-born: | 89.0% (108) |
White alone - Speak only English
| Native: | 96.3% (13,237) |
| Foreign-born: | 100.0% (51) |
White alone - Speak another language
| Native: | 3.8% (519) |
| Foreign-born: | 2.3% (1) |
Hispanic or Latino - Speak only English
| Native: | 89.4% (1,690) |
| Foreign-born: | 6.5% (48) |
Hispanic or Latino - Speak another language
| Native: | 17.1% (324) |
| Foreign-born: | 94.9% (709) |
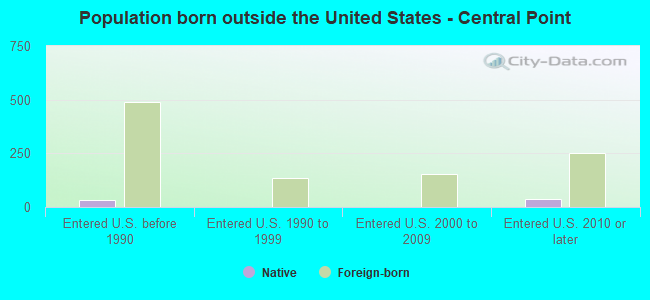
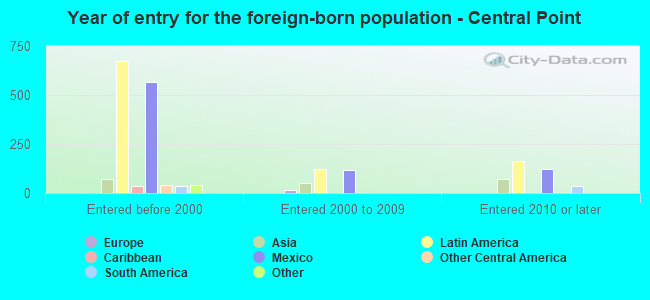
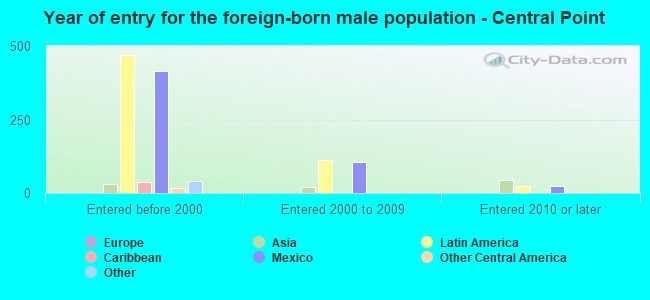
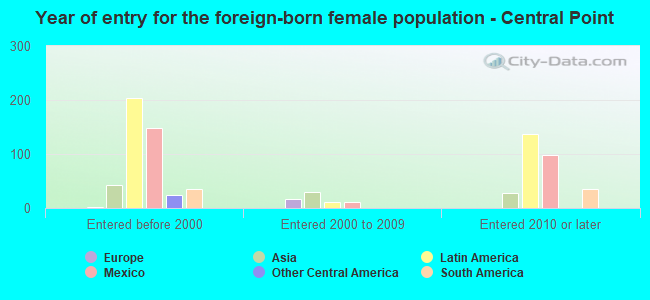
Foreign-born residents in Central Point
1,198 residents are foreign born (4.8% Latin America, 1.0% Asia).
| This city: | 6.3% |
| Oregon: | 9.8% |
Marital status for residents in Central Point
Marital status - White (Caucasian) population 15 years and over
- Males
- 29.8%Never married
- 55.7%Now married
- 0.2%Separated
- 1.9%Widowed
- 12.5%Divorced
- Females
- 22.4%Never married
- 53.1%Now married
- 0.5%Separated
- 9.6%Widowed
- 14.4%Divorced
Women who gave birth in the past 12 months
| Now married: | 100.0% (254) |
| Unmarried: | 0.0% (0) |
Women who did not give birth in the past 12 months
| Now married: | 51.7% (1,742) |
| Unmarried: | 48.3% (1,625) |
Marital status - Black or African American population 15 years and over
- Males
- 98.2%Never married
- 1.8%Now married
- 0.0%Separated
- 0.0%Widowed
- 0.0%Divorced
- Females
- 66.7%Never married
- 33.3%Now married
- 0.0%Separated
- 0.0%Widowed
- 0.0%Divorced
Women who did not give birth in the past 12 months
| Now married: | 0.0% (0) |
| Unmarried: | 100.0% (23) |
Marital status - American Indian / Alaska Native population 15 years and over
- Males
- 94.6%Never married
- 5.4%Now married
- 0.0%Separated
- 0.0%Widowed
- 0.0%Divorced
- Females
- 54.8%Never married
- 19.4%Now married
- 0.0%Separated
- 19.4%Widowed
- 6.5%Divorced
Marital status - Asian population 15 years and over
- Males
- 34.4%Never married
- 65.6%Now married
- 0.0%Separated
- 0.0%Widowed
- 0.0%Divorced
- Females
- 13.9%Never married
- 38.9%Now married
- 0.0%Separated
- 13.0%Widowed
- 34.3%Divorced
Women who did not give birth in the past 12 months
| Now married: | 26.4% (15) |
| Unmarried: | 73.6% (41) |
Marital status - Native Hawaiian / Pacific Islander population 15 years and over
- Males
- 65.6%Never married
- 34.4%Now married
- 0.0%Separated
- 0.0%Widowed
- 0.0%Divorced
- Females
- 64.4%Never married
- 35.6%Now married
- 0.0%Separated
- 0.0%Widowed
- 0.0%Divorced
Women who did not give birth in the past 12 months
| Now married: | 0.0% (0) |
| Unmarried: | 100.0% (68) |
Marital status - Other race population 15 years and over
- Males
- 41.8%Never married
- 48.4%Now married
- 9.8%Separated
- 0.0%Widowed
- 0.0%Divorced
- Females
- 29.7%Never married
- 52.3%Now married
- 9.2%Separated
- 8.8%Widowed
- 0.0%Divorced
Women who did not give birth in the past 12 months
| Now married: | 53.3% (111) |
| Unmarried: | 46.7% (97) |
Marital status - Two or more races population 15 years and over
- Males
- 10.6%Never married
- 75.7%Now married
- 0.0%Separated
- 6.5%Widowed
- 7.3%Divorced
- Females
- 31.0%Never married
- 60.6%Now married
- 0.0%Separated
- 1.6%Widowed
- 6.8%Divorced
Women who did not give birth in the past 12 months
| Now married: | 55.0% (315) |
| Unmarried: | 45.0% (257) |
Marital status - White alone, not Hispanic / Latino population 15 years and over
- Males
- 30.8%Never married
- 53.9%Now married
- 0.2%Separated
- 2.1%Widowed
- 13.1%Divorced
- Females
- 21.6%Never married
- 52.2%Now married
- 0.5%Separated
- 10.4%Widowed
- 15.3%Divorced
Women who gave birth in the past 12 months
| Now married: | 100.0% (268) |
| Unmarried: | 0.0% (0) |
Women who did not give birth in the past 12 months
| Now married: | 50.6% (1,568) |
| Unmarried: | 49.4% (1,533) |
Marital status - Hispanic or Latino population 15 years and over
- Males
- 30.6%Never married
- 62.3%Now married
- 2.2%Separated
- 0.0%Widowed
- 4.9%Divorced
- Females
- 35.4%Never married
- 59.3%Now married
- 2.3%Separated
- 0.2%Widowed
- 2.9%Divorced
Women who did not give birth in the past 12 months
| Now married: | 57.2% (432) |
| Unmarried: | 42.8% (323) |
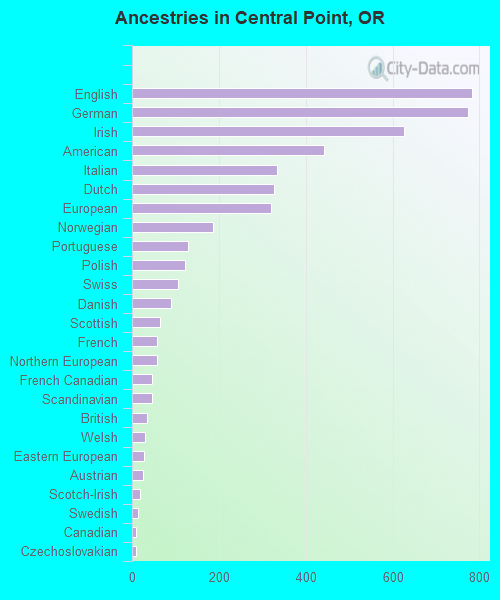
Ancestries in Central Point

- 78310.5%English
- 77410.4%German
- 6278.4%Irish
- 4425.9%American
- 3354.5%Italian
- 3284.4%Dutch
- 3204.3%European
- 1862.5%Norwegian
- 1291.7%Portuguese
- 1221.6%Polish
- 1071.4%Swiss
- 891.2%Danish
- 640.9%Scottish
- 570.8%French
- 570.8%Northern European
- 470.6%French Canadian
- 460.6%Scandinavian
- 340.5%British
- 310.4%Welsh
- 280.4%Eastern European
- 250.3%Austrian
- 180.2%Scotch-Irish
- 130.2%Swedish
- 100.1%Canadian
- 90.1%Czechoslovakian
- 90.1%Yugoslavian
- 10.01%Croatian
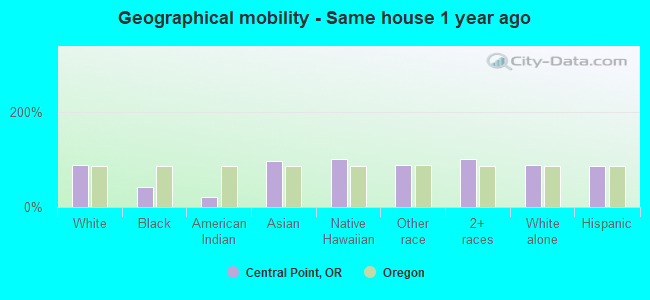
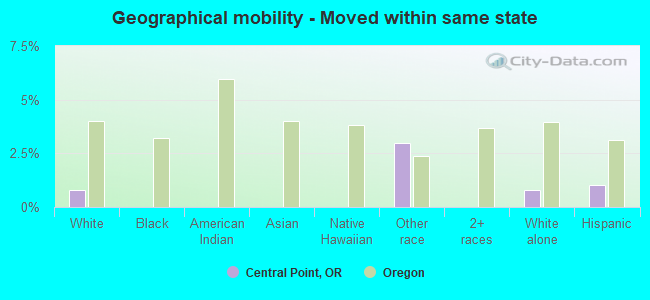
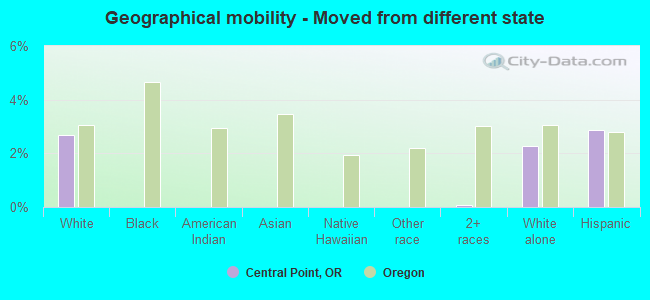
Geographical mobility in Central Point

- Same house 1 year ago
- 13,25686.5%White (Caucasian)
- 3841.1%Black or African American
- 3722.0%American Indian / Alaska Native
- 34296.3%Asian
- 268100.0%Native Hawaiian / Pacific Islander
- 82088.5%Other race
- 1,781100.0%Two or more races
- 12,44786.9%White alone, not Hispanic / Latino
- 2,51685.8%Hispanic or Latino
-
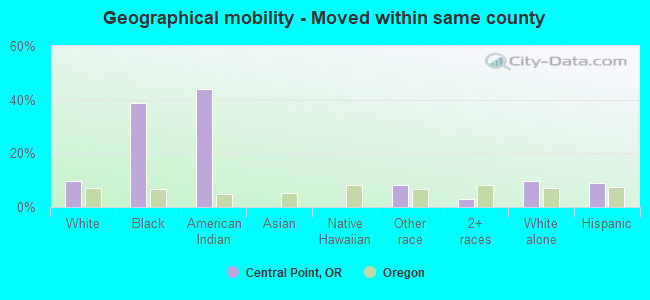
- Moved within same county
- 1,5039.8%White / Caucasian
- 3638.8%Black or African American
- 7544.1%American Indian / Alaska Native
- 778.4%Other race
- 502.8%Two or more races
- 1,4099.8%White alone, not Hispanic / Latino
- 2669.1%Hispanic or Latino
-
- Moved within same state
- 1210.8%White / Caucasian
- 283.0%Other race
- 1150.8%White alone, not Hispanic / Latino
- 301.0%Hispanic or Latino
-
- Moved from different state
- 4092.7%White / Caucasian
- 10.1%Two or more races
- 3242.3%White alone, not Hispanic / Latino
- 842.9%Hispanic or Latino
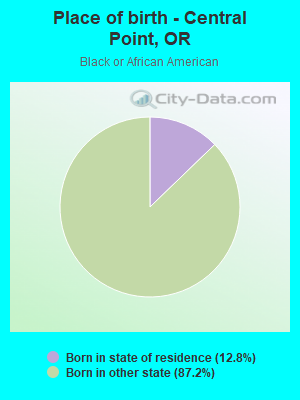
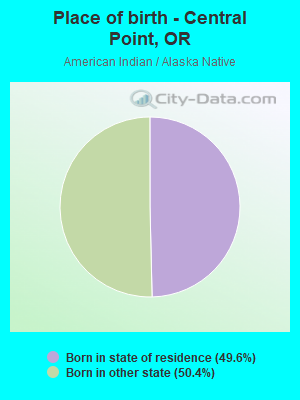
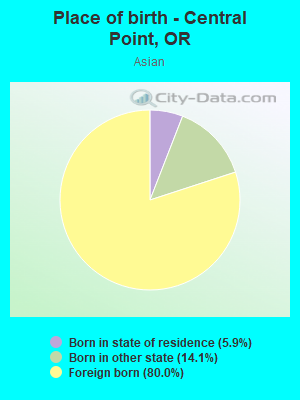
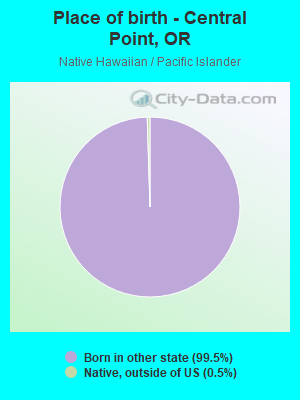
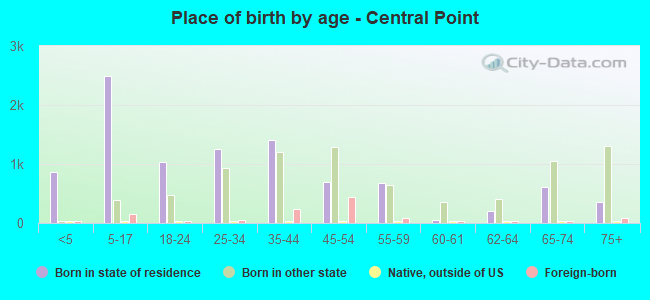
Children Nativity (place of birth) in Central Point
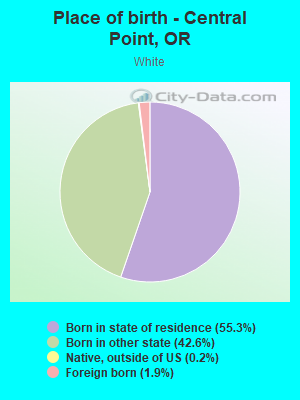
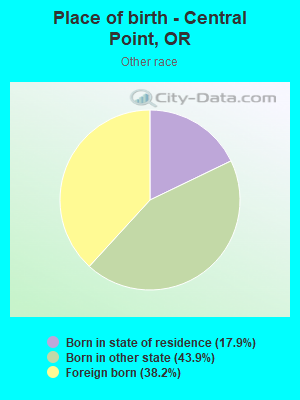
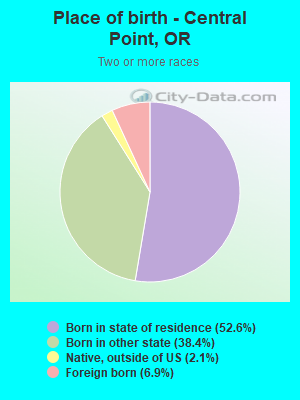
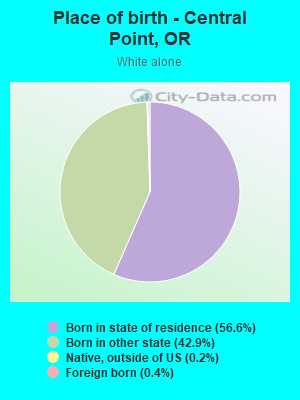
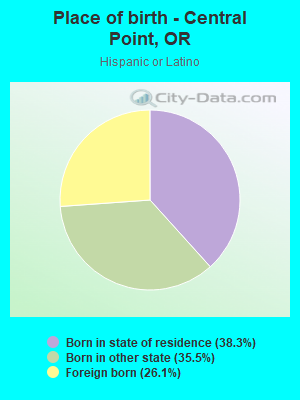
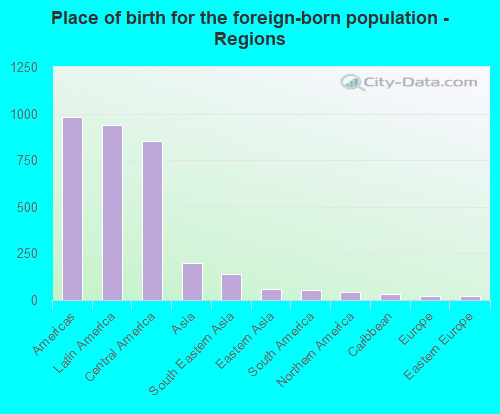
Place of birth for residents in Central Point
![Place of birth for the foreign-born population - Regions]()
- 980Americas
- 938Latin America
- 855Central America
- 198Asia
- 141South Eastern Asia
- 57Eastern Asia
- 53South America
- 41Northern America
- 30Caribbean
- 19Europe
- 19Eastern Europe
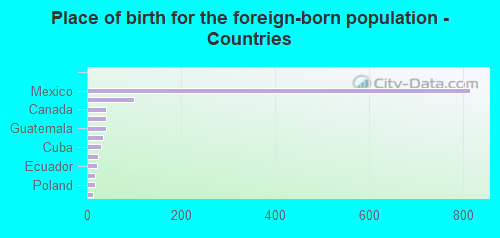
![Place of birth for the foreign-born population - Countries]()
- 814Mexico
- 100Philippines
- 41Canada
- 40Vietnam
- 40Guatemala
- 33Korea
- 30Cuba
- 23Japan
- 21Ecuador
- 18Colombia
- 17Poland
- 13Peru
- 1Bosnia and Herzegovina
- 1Croatia