Races in Central Kent, Delaware (DE) Detailed Stats
Ancestries, Foreign-born residents, place of birth
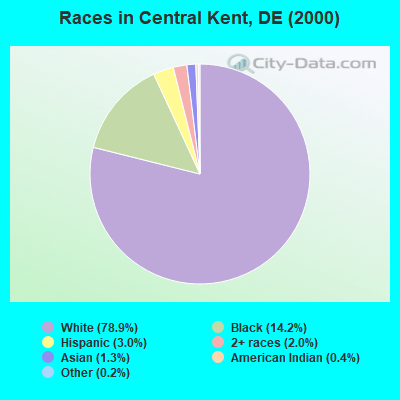
Race distribution in Central Kent

- 14,41678.9%White alone
- 2,60014.2%Black alone
- 5413.0%Hispanic
- 3642.0%Two or more races
- 2401.3%Asian alone
- 760.4%American Indian alone
- 280.2%Other race alone
- 20.01%Native Hawaiian and Other
Pacific Islander alone
2000
2022
-
- 567,97372.5%White alone
- 148,43518.9%Black alone
- 37,2774.8%Hispanic
- 16,1102.1%Asian alone
- 10,2221.3%Two or more races
- 2,3240.3%American Indian alone
- 1,0250.1%Other race alone
- 2340.03%Native Hawaiian and Other
Pacific Islander alone

-
- 599,34758.9%White alone
- 220,01021.6%Black alone
- 105,30010.3%Hispanic
- 46,0164.5%Two or more races
- 41,3504.1%Asian alone
- 5,0970.5%Other race alone
- 1,2760.1%American Indian alone

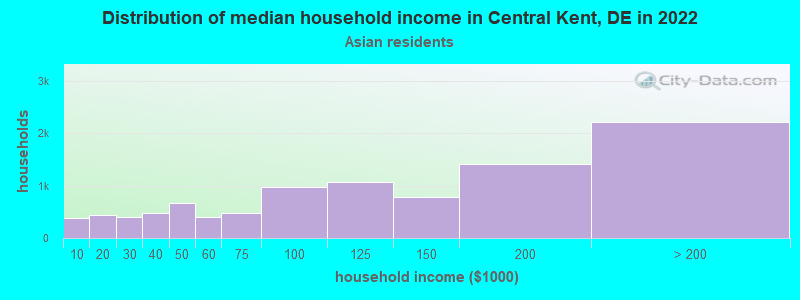
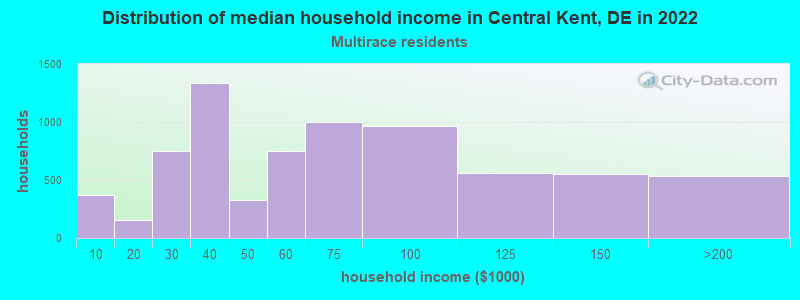
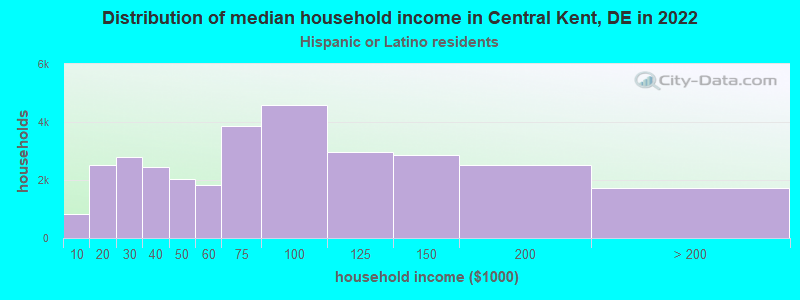
Income and house value in Central Kent
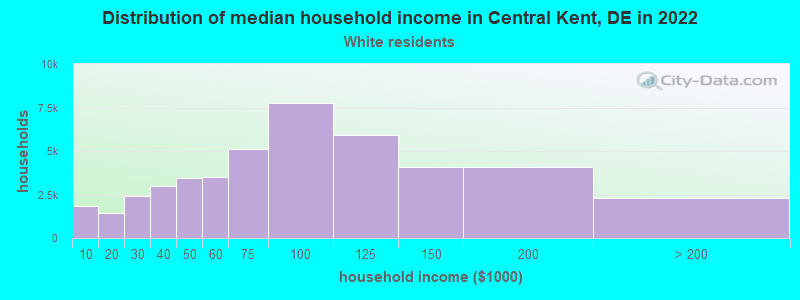
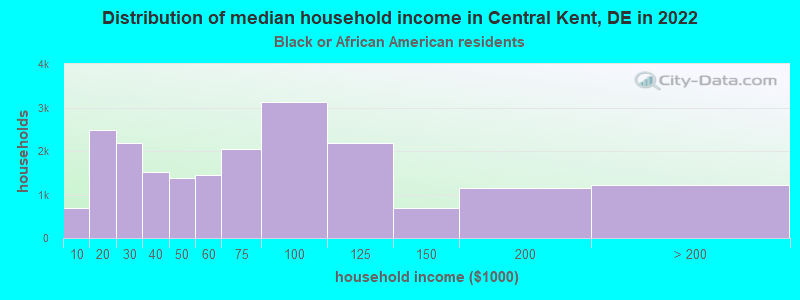
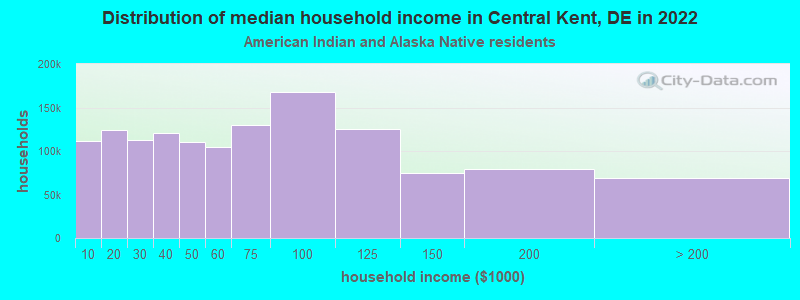
- Median household income in 2022
- $79,172White non-Hispanic householders
- $65,111Black householders
- $73,264American Indian and Alaska Native householders
- $71,125Asian householders
- $61,247Some other race householders
- $63,595Two or more races householders
- $84,461Hispanic or Latino race householders
- Median 2022 house value
- $384,752White Non-Hispanic householders
- $350,154Black or African American householders
- $422,630American Indian or Alaska Native householders
- $490,037Asian householders
- $339,715Some other race householders
- $348,066Two or more races householders
- $404,138Hispanic or Latino householders
Household income for White non-Hispanic householders
Household income for Black householders
Household income for American Indian and Alaska Native householders
Household income for Asian householders
Household income for Two or more races householders
Household income for Hispanic or Latino race householders
Zip code: 19943