Races in Center Line, Michigan (MI) Detailed Stats
Data:
Races - White alone (%)
Races - White alone (% change since 2000)
Races - Black alone (%)
Races - Black alone (% change since 2000)
Races - American Indian alone (%)
Races - American Indian alone (% change since 2000)
Races - Asian alone (%)
Races - Asian alone (% change since 2000)
Races - Hispanic (%)
Races - Hispanic (% change since 2000)
Races - Native Hawaiian and Other Pacific Islander alone (%)
Races - Native Hawaiian and Other Pacific Islander alone (% change since 2000)
Races - Two or more races(%)
Races - Two or more races(% change since 2000)
Races - Other race alone (%)
Races - Other race alone (% change since 2000)
Racial diversity
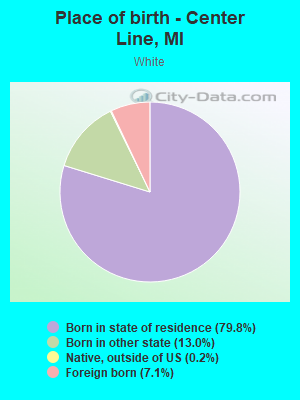
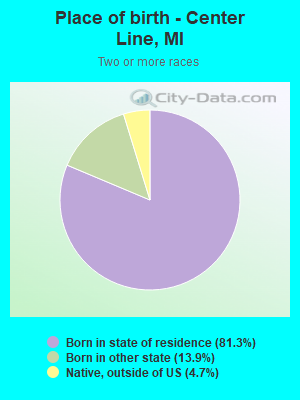
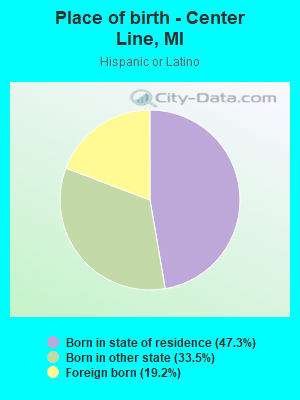
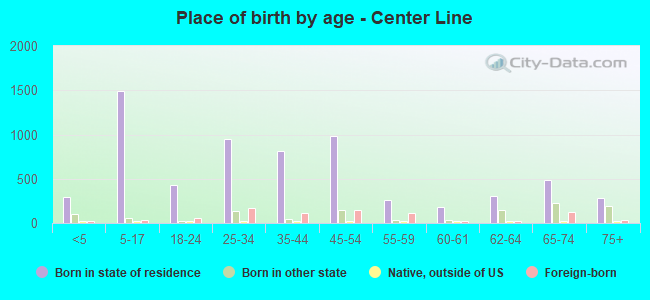
Place of birth - Born in state of residence (%)
Place of birth - Born in state of residence (%) - White
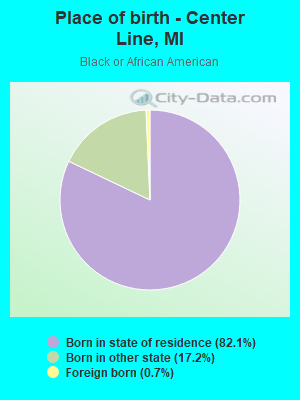
Place of birth - Born in state of residence (%) - Black or African American
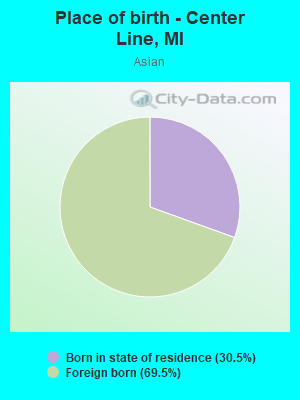
Place of birth - Born in state of residence (%) - Asian
Place of birth - Born in state of residence (%) - Hispanic or Latino
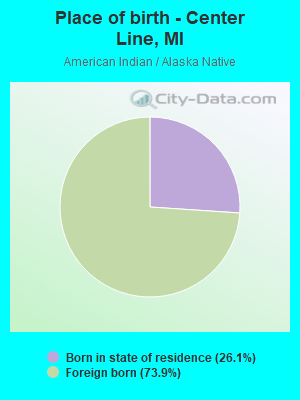
Place of birth - Born in state of residence (%) - American Indian and Alaska Native
Place of birth - Born in state of residence (%) - Multirace
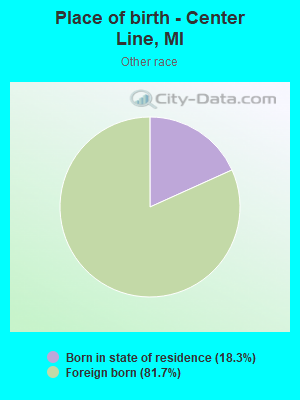
Place of birth - Born in state of residence (%) - Other Race
Place of birth - Born in other state (%)
Place of birth - Born in other state (%) - White
Place of birth - Born in other state (%) - Black or African American
Place of birth - Born in other state (%) - Asian
Place of birth - Born in other state (%) - Hispanic or Latino
Place of birth - Born in other state (%) - American Indian and Alaska Native
Place of birth - Born in other state (%) - Multirace
Place of birth - Born in other state (%) - Other Race
Place of birth - Native, outside of US (%)
Place of birth - Native, outside of US (%) - White
Place of birth - Native, outside of US (%) - Black or African American
Place of birth - Native, outside of US (%) - Asian
Place of birth - Native, outside of US (%) - Hispanic or Latino
Place of birth - Native, outside of US (%) - American Indian and Alaska Native
Place of birth - Native, outside of US (%) - Multirace
Place of birth - Native, outside of US (%) - Other Race
Place of birth - Foreign born (%)
Place of birth - Foreign born (%) - White
Place of birth - Foreign born (%) - Black or African American
Place of birth - Foreign born (%) - Asian
Place of birth - Foreign born (%) - Hispanic or Latino
Place of birth - Foreign born (%) - American Indian and Alaska Native
Place of birth - Foreign born (%) - Multirace
Place of birth - Foreign born (%) - Other Race
Residents speaking English at home (%)
Residents speaking English at home - Born in the United States (%)
Residents speaking English at home - Native, born elsewhere (%)
Residents speaking English at home - Foreign born (%)
Residents speaking Spanish at home (%)
Residents speaking Spanish at home - Born in the United States (%)
Residents speaking Spanish at home - Native, born elsewhere (%)
Residents speaking Spanish at home - Foreign born (%)
Residents speaking other language at home (%)
Residents speaking other language at home - Born in the United States (%)
Residents speaking other language at home - Native, born elsewhere (%)
Residents speaking other language at home - Foreign born (%)
Marital status - Never married (%)
Marital status - Now married (%)
Marital status - Separated (%)
Marital status - Widowed (%)
Marital status - Divorced (%)
Ancestries Reported - Arab (%)
Ancestries Reported - Czech (%)
Ancestries Reported - Danish (%)
Ancestries Reported - Dutch (%)
Ancestries Reported - English (%)
Ancestries Reported - French (%)
Ancestries Reported - French Canadian (%)
Ancestries Reported - German (%)
Ancestries Reported - Greek (%)
Ancestries Reported - Hungarian (%)
Ancestries Reported - Irish (%)
Ancestries Reported - Italian (%)
Ancestries Reported - Lithuanian (%)
Ancestries Reported - Norwegian (%)
Ancestries Reported - Polish (%)
Ancestries Reported - Portuguese (%)
Ancestries Reported - Russian (%)
Ancestries Reported - Scotch-Irish (%)
Ancestries Reported - Scottish (%)
Ancestries Reported - Slovak (%)
Ancestries Reported - Subsaharan African (%)
Ancestries Reported - Swedish (%)
Ancestries Reported - Swiss (%)
Ancestries Reported - Ukrainian (%)
Ancestries Reported - United States (%)
Ancestries Reported - Welsh (%)
Ancestries Reported - West Indian (%)
Ancestries Reported - Other (%)
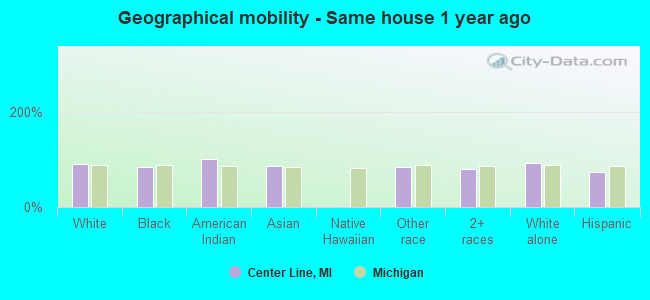
Geographical mobility - Same house 1 year ago (%)
Geographical mobility - Same house 1 year ago (%) - White
Geographical mobility - Same house 1 year ago (%) - Black or African American
Geographical mobility - Same house 1 year ago (%) - Asian
Geographical mobility - Same house 1 year ago (%) - Hispanic or Latino
Geographical mobility - Same house 1 year ago (%) - American Indian and Alaska Native
Geographical mobility - Same house 1 year ago (%) - Multirace
Geographical mobility - Same house 1 year ago (%) - Other Race
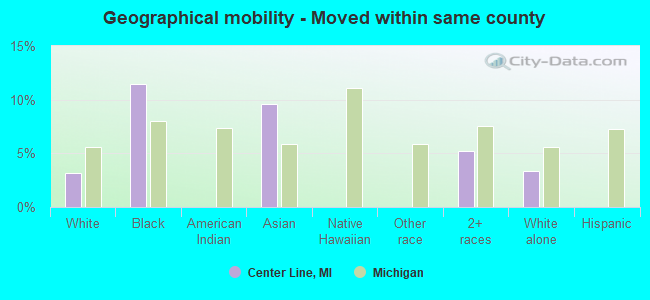
Geographical mobility - Moved within same county (%)
Geographical mobility - Moved within same county (%) - White
Geographical mobility - Moved within same county (%) - Black or African American
Geographical mobility - Moved within same county (%) - Asian
Geographical mobility - Moved within same county (%) - Hispanic or Latino
Geographical mobility - Moved within same county (%) - American Indian and Alaska Native
Geographical mobility - Moved within same county (%) - Multirace
Geographical mobility - Moved within same county (%) - Other Race
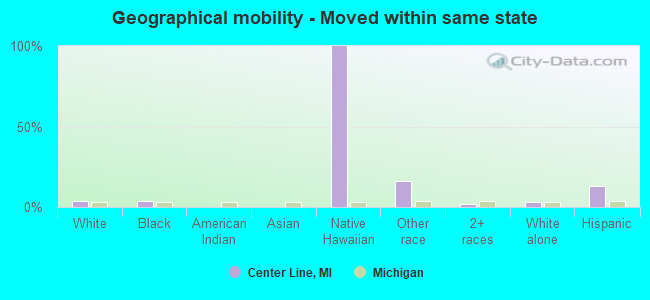
Geographical mobility - Moved from different county within same state (%)
Geographical mobility - Moved from different county within same state (%) - White
Geographical mobility - Moved from different county within same state (%) - Black or African American
Geographical mobility - Moved from different county within same state (%) - Asian
Geographical mobility - Moved from different county within same state (%) - Hispanic or Latino
Geographical mobility - Moved from different county within same state (%) - American Indian and Alaska Native
Geographical mobility - Moved from different county within same state (%) - Multirace
Geographical mobility - Moved from different county within same state (%) - Other Race
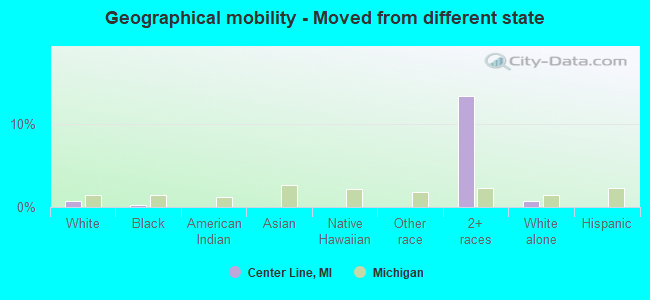
Geographical mobility - Moved from different state (%)
Geographical mobility - Moved from different state (%) - White
Geographical mobility - Moved from different state (%) - Black or African American
Geographical mobility - Moved from different state (%) - Asian
Geographical mobility - Moved from different state (%) - Hispanic or Latino
Geographical mobility - Moved from different state (%) - American Indian and Alaska Native
Geographical mobility - Moved from different state (%) - Multirace
Geographical mobility - Moved from different state (%) - Other Race
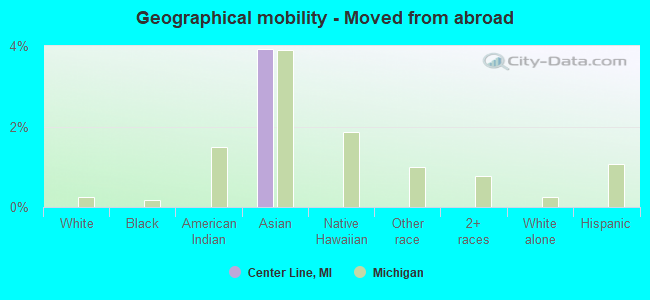
Geographical mobility - Moved from abroad (%)
Geographical mobility - Moved from abroad (%) - White
Geographical mobility - Moved from abroad (%) - Black or African American
Geographical mobility - Moved from abroad (%) - Asian
Geographical mobility - Moved from abroad (%) - Hispanic or Latino
Geographical mobility - Moved from abroad (%) - American Indian and Alaska Native
Geographical mobility - Moved from abroad (%) - Multirace
Geographical mobility - Moved from abroad (%) - Other Race
Place of birth for the foreign-born population - Ireland (%)
Place of birth for the foreign-born population - Denmark (%)
Place of birth for the foreign-born population - Norway (%)
Place of birth for the foreign-born population - Sweden (%)
Place of birth for the foreign-born population - United Kingdom (%)
Place of birth for the foreign-born population - England (%)
Place of birth for the foreign-born population - Scotland (%)
Place of birth for the foreign-born population - Other Northern Europe (%)
Place of birth for the foreign-born population - Austria (%)
Place of birth for the foreign-born population - Belgium (%)
Place of birth for the foreign-born population - France (%)
Place of birth for the foreign-born population - Germany (%)
Place of birth for the foreign-born population - Netherlands (%)
Place of birth for the foreign-born population - Switzerland (%)
Place of birth for the foreign-born population - Other Western Europe (%)
Place of birth for the foreign-born population - Greece (%)
Place of birth for the foreign-born population - Italy (%)
Place of birth for the foreign-born population - Portugal (%)
Place of birth for the foreign-born population - Spain (%)
Place of birth for the foreign-born population - Other Southern Europe (%)
Place of birth for the foreign-born population - Albania (%)
Place of birth for the foreign-born population - Belarus (%)
Place of birth for the foreign-born population - Bosnia and Herzegovina (%)
Place of birth for the foreign-born population - Bulgaria (%)
Place of birth for the foreign-born population - Croatia (%)
Place of birth for the foreign-born population - Czechoslovakia (%)
Place of birth for the foreign-born population - Hungary (%)
Place of birth for the foreign-born population - Latvia (%)
Place of birth for the foreign-born population - Lithuania (%)
Place of birth for the foreign-born population - North Macedonia (Macedonia) (%)
Place of birth for the foreign-born population - Moldova (%)
Place of birth for the foreign-born population - Poland (%)
Place of birth for the foreign-born population - Romania (%)
Place of birth for the foreign-born population - Russia (%)
Place of birth for the foreign-born population - Serbia (%)
Place of birth for the foreign-born population - Ukraine (%)
Place of birth for the foreign-born population - Other Eastern Europe (%)
Place of birth for the foreign-born population - China (%)
Place of birth for the foreign-born population - Hong Kong (%)
Place of birth for the foreign-born population - Taiwan (%)
Place of birth for the foreign-born population - Japan (%)
Place of birth for the foreign-born population - Korea (%)
Place of birth for the foreign-born population - Other Eastern Asia (%)
Place of birth for the foreign-born population - Afghanistan (%)
Place of birth for the foreign-born population - Bangladesh (%)
Place of birth for the foreign-born population - India (%)
Place of birth for the foreign-born population - Iran (%)
Place of birth for the foreign-born population - Kazakhstan (%)
Place of birth for the foreign-born population - Nepal (%)
Place of birth for the foreign-born population - Pakistan (%)
Place of birth for the foreign-born population - Sri Lanka (%)
Place of birth for the foreign-born population - Uzbekistan (%)
Place of birth for the foreign-born population - Other South Central Asia (%)
Place of birth for the foreign-born population - Burma (%)
Place of birth for the foreign-born population - Cambodia (%)
Place of birth for the foreign-born population - Indonesia (%)
Place of birth for the foreign-born population - Laos (%)
Place of birth for the foreign-born population - Malaysia (%)
Place of birth for the foreign-born population - Philippines (%)
Place of birth for the foreign-born population - Singapore (%)
Place of birth for the foreign-born population - Thailand (%)
Place of birth for the foreign-born population - Vietnam (%)
Place of birth for the foreign-born population - Other South Eastern Asia (%)
Place of birth for the foreign-born population - Armenia (%)
Place of birth for the foreign-born population - Iraq (%)
Place of birth for the foreign-born population - Israel (%)
Place of birth for the foreign-born population - Jordan (%)
Place of birth for the foreign-born population - Kuwait (%)
Place of birth for the foreign-born population - Lebanon (%)
Place of birth for the foreign-born population - Saudi Arabia (%)
Place of birth for the foreign-born population - Syria (%)
Place of birth for the foreign-born population - Turkey (%)
Place of birth for the foreign-born population - Yemen (%)
Place of birth for the foreign-born population - Other Western Asia (%)
Place of birth for the foreign-born population - Eritrea (%)
Place of birth for the foreign-born population - Ethiopia (%)
Place of birth for the foreign-born population - Kenya (%)
Place of birth for the foreign-born population - Somalia (%)
Place of birth for the foreign-born population - Uganda (%)
Place of birth for the foreign-born population - Zimbabwe (%)
Place of birth for the foreign-born population - Other Eastern Africa (%)
Place of birth for the foreign-born population - Cameroon (%)
Place of birth for the foreign-born population - Congo (%)
Place of birth for the foreign-born population - Democratic Republic of Congo (Zaire) (%)
Place of birth for the foreign-born population - Other Middle Africa (%)
Place of birth for the foreign-born population - Egypt (%)
Place of birth for the foreign-born population - Morocco (%)
Place of birth for the foreign-born population - Sudan (%)
Place of birth for the foreign-born population - Other Northern Africa (%)
Place of birth for the foreign-born population - South Africa (%)
Place of birth for the foreign-born population - Other Southern Africa (%)
Place of birth for the foreign-born population - Cabo Verde (%)
Place of birth for the foreign-born population - Ghana (%)
Place of birth for the foreign-born population - Liberia (%)
Place of birth for the foreign-born population - Nigeria (%)
Place of birth for the foreign-born population - Senegal (%)
Place of birth for the foreign-born population - Sierra Leone (%)
Place of birth for the foreign-born population - Other Western Africa (%)
Place of birth for the foreign-born population - Australia (%)
Place of birth for the foreign-born population - New Zealand (%)
Place of birth for the foreign-born population - Fiji (%)
Place of birth for the foreign-born population - Micronesia (%)
Place of birth for the foreign-born population - Bahamas (%)
Place of birth for the foreign-born population - Barbados (%)
Place of birth for the foreign-born population - Cuba (%)
Place of birth for the foreign-born population - Dominica (%)
Place of birth for the foreign-born population - Dominican Republic (%)
Place of birth for the foreign-born population - Grenada (%)
Place of birth for the foreign-born population - Haiti (%)
Place of birth for the foreign-born population - Jamaica (%)
Place of birth for the foreign-born population - St. Vincent and the Grenadines (%)
Place of birth for the foreign-born population - Trinidad and Tobago (%)
Place of birth for the foreign-born population - West Indies (%)
Place of birth for the foreign-born population - Other Caribbean (%)
Place of birth for the foreign-born population - Belize (%)
Place of birth for the foreign-born population - Costa Rica (%)
Place of birth for the foreign-born population - El Salvador (%)
Place of birth for the foreign-born population - Guatemala (%)
Place of birth for the foreign-born population - Honduras (%)
Place of birth for the foreign-born population - Mexico (%)
Place of birth for the foreign-born population - Nicaragua (%)
Place of birth for the foreign-born population - Panama (%)
Place of birth for the foreign-born population - Other Central America (%)
Place of birth for the foreign-born population - Argentina (%)
Place of birth for the foreign-born population - Bolivia (%)
Place of birth for the foreign-born population - Brazil (%)
Place of birth for the foreign-born population - Chile (%)
Place of birth for the foreign-born population - Colombia (%)
Place of birth for the foreign-born population - Ecuador (%)
Place of birth for the foreign-born population - Guyana (%)
Place of birth for the foreign-born population - Peru (%)
Place of birth for the foreign-born population - Uruguay (%)
Place of birth for the foreign-born population - Venezuela (%)
Place of birth for the foreign-born population - Other South America (%)
Place of birth for the foreign-born population - Canada (%)
Place of birth for the foreign-born population - Other Northern America (%)
Place of birth for the foreign-born population - Other (%)
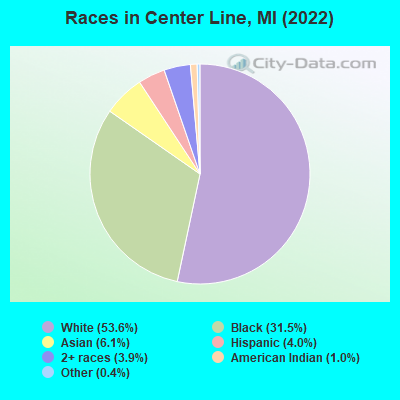
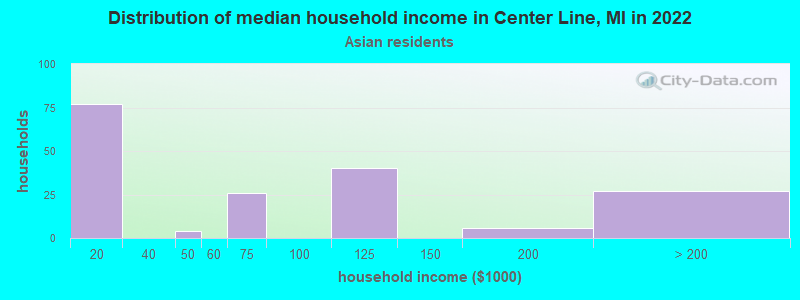
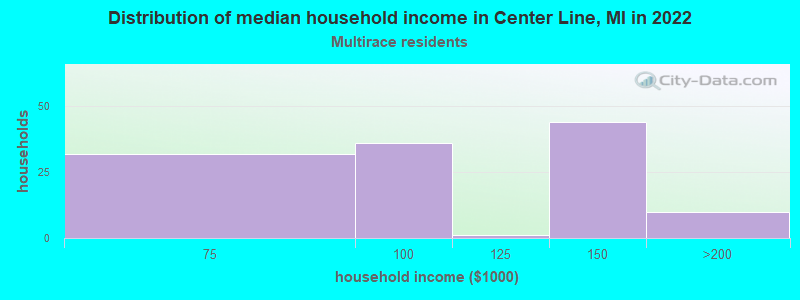
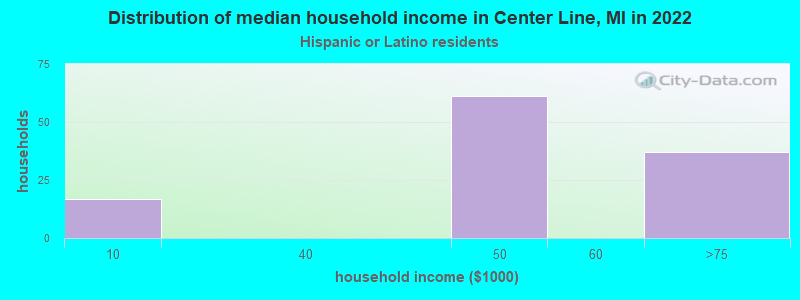
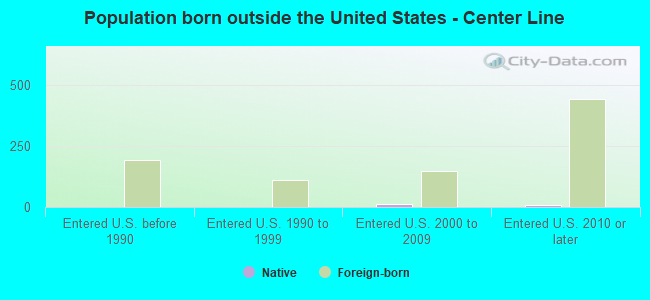
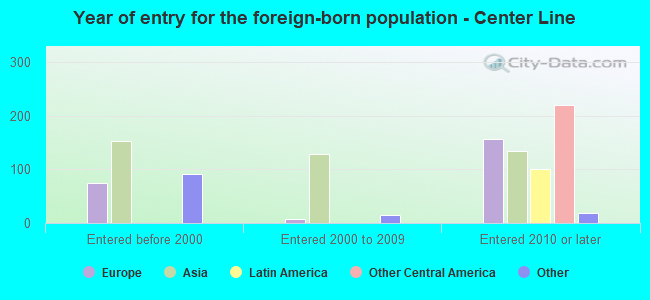
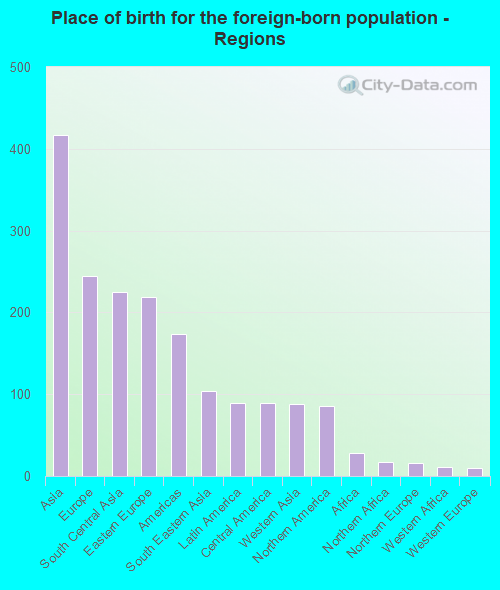
According to 2022 data, the most numerous races in Center Line, MI are White alone (4,531 residents), Black alone (2,662 residents), and Hispanic (342 residents). 87.6% of Center Line residents speak English at home. 10.2% of Center Line, MI residents are foreign-born (4.9% born in Asia, 2.9% born in Europe, 1.0% born in Latin America), which is 41.3% greater than the foreign-born rate of 6.0% across the entire state of Michigan.
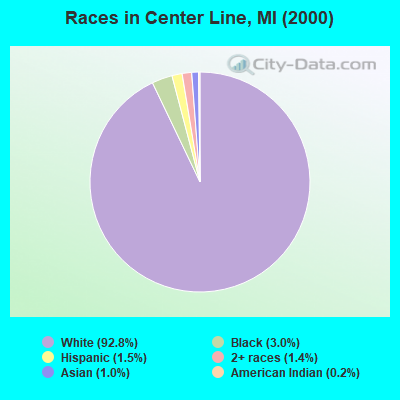
Race distribution in Center Line
2000 2022
7,806,691 78.6% White alone 1,402,047 14.1% Black alone 323,877 3.3% Hispanic 175,311 1.8% Asian alone 163,487 1.6% Two or more races 53,421 0.5% American Indian alone 11,465 0.1% Other race alone 2,145 0.02% Native Hawaiian and Other
7,289,051 72.6% White alone 1,310,464 13.1% Black alone 572,405 5.7% Hispanic 450,031 4.5% Two or more races 335,732 3.3% Asian alone 45,217 0.5% Other race alone 29,011 0.3% American Indian alone 2,207 0.02% Native Hawaiian and Other
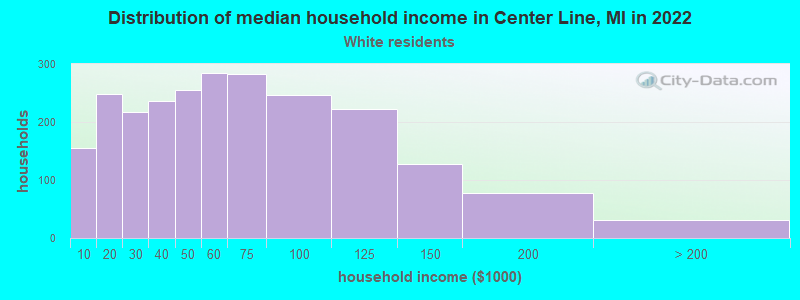
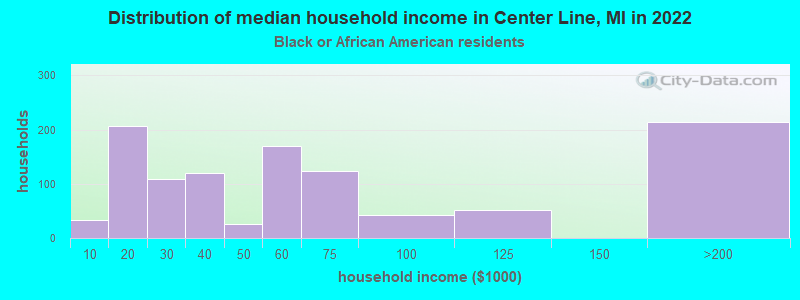
Income and house value in Center Line Median household income in 2022 $51,807 White non-Hispanic householders$53,781 Black householders$92,306 Two or more races householdersMedian 2022 house value $144,844 White Non-Hispanic householders$201,243 Black or African American householders $192,426 Asian householders$190,747 Two or more races householders$212,159 Hispanic or Latino householders
Median age by race in Center Line
49.4 Median age for White residents46.3 50.4 32.9 Median age for Black or African American residents29.0 35.0 79.7 Median age for American Indian / Alaska Native residents-553,963,705.3 15.8 42.6 Median age for Asian residents46.9 41.8 -670,531,400.3 Median age for Native Hawaiian / Pacific Islander residents-674,772,035.8 -699,588,476.7 32.2 Median age for Other race residents-672,690,762.4 -670,731,706.6 21.8 Median age for Two or more races residents47.5 16.2 51.4 Median age for White alone residents51.0 51.7 29.2 Median age for Hispanic or Latino residents32.4 24.3
Owner/renter occupied households by race in Center Line
House owners and renters - White residents 1,527 63.8% Owner occupied867 36.2% Renter occupiedHouse owners and renters - Black or African American residents 339 32.7% Owner occupied697 67.3% Renter occupiedHouse owners and renters - American Indian / Alaska Native residents 3 100.0% Renter occupiedHouse owners and renters - Asian residents 145 87.2% Owner occupied21 12.8% Renter occupiedHouse owners and renters - Other race residents 75 100.0% Renter occupiedHouse owners and renters - Two or more races residents 105 89.2% Owner occupied13 10.8% Renter occupiedHouse owners and renters - White alone residents 1,519 64.5% Owner occupied835 35.5% Renter occupiedHouse owners and renters - Hispanic or Latino residents 14 13.9% Owner occupied87 86.1% Renter occupied
Language usage in Center Line
English speakers - Total 87.6% of residents of Center Line speak English at home.
1.0% of residents speak Spanish at home 35 41.7% Speak English very well49 58.3% Speak English less than very well11.4% of residents speak other language at home 531 57.8% Speak English very well388 42.2% Speak English less than very well
English speakers - Born in the United States 97.4% of residents of Center Line speak English at home.
2.1% of residents speak other language at home 16 72.7% Speak English very well6 27.3% Speak English less than very well
English speakers - Native, born elsewhere 45.0% of residents of Center Line speak English at home.
55.0% of residents speak other language at home 11 100.0% Speak English very well
English speakers - Foreign-born 23.4% of residents of Center Line speak English at home.
8.4% of residents speak Spanish at home 37 52.1% Speak English very well34 47.9% Speak English less than very well66.4% of residents speak other language at home 187 33.2% Speak English very well377 66.8% Speak English less than very well
White (Caucasian) - Speak only English Native:
95.7% (4,076)Foreign-born:
29.1% (97)
White (Caucasian) - Speak another language Native:
4.3% (185)Foreign-born:
70.3% (235)
Black or African American - Speak only English Native:
99.4% (2,408)Foreign-born:
98.9% (18)
American Indian / Alaska Native - Speak only English Native:
92.4% (34)Foreign-born:
87.5% (96)
Asian - Speak only English Native:
22.2% (33)Foreign-born:
7.1% (26)
Asian - Speak another language Native:
81.4% (123)Foreign-born:
92.9% (337)
White alone - Speak only English Native:
95.2% (3,900)Foreign-born:
28.9% (99)
White alone - Speak another language Native:
4.8% (195)Foreign-born:
70.4% (240)
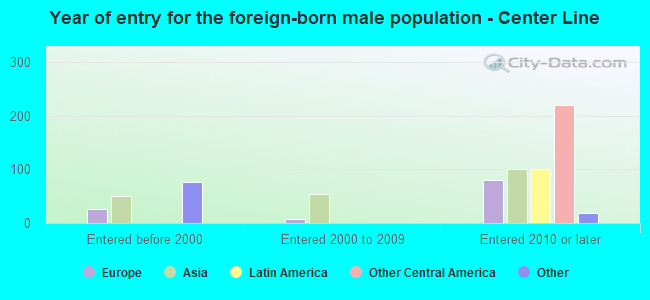
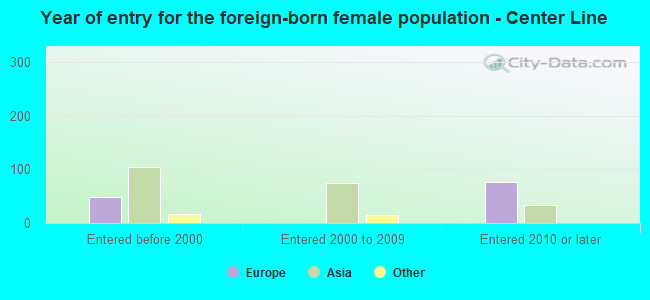
Foreign-born residents in Center Line 864 residents are foreign born (4.9% Asia , 2.9% Europe , 1.0% Latin America ).
This city:
10.2%Michigan:
6.9%
Marital status for residents in Center Line Marital status - White (Caucasian) population 15 years and over
Males 46.4% Never married39.1% Now married0.0% Separated2.9% Widowed11.5% DivorcedFemales 28.7% Never married43.3% Now married2.0% Separated9.6% Widowed16.4% DivorcedWomen who gave birth in the past 12 months Now married:
68.4% (49)Unmarried:
31.6% (23)
Women who did not give birth in the past 12 months Now married:
36.2% (307)Unmarried:
63.8% (542)
Marital status - Black or African American population 15 years and over
Males 31.5% Never married50.5% Now married6.8% Separated8.3% Widowed3.0% DivorcedFemales 55.4% Never married23.9% Now married7.2% Separated1.8% Widowed11.6% DivorcedWomen who did not give birth in the past 12 months Now married:
29.8% (243)Unmarried:
70.2% (573)
Marital status - American Indian / Alaska Native population 15 years and over
Males 100.0% Never married0.0% Now married0.0% Separated0.0% Widowed0.0% DivorcedFemales 100.0% Never married0.0% Now married0.0% Separated0.0% Widowed0.0% DivorcedMarital status - Asian population 15 years and over
Males 23.6% Never married69.2% Now married0.0% Separated7.2% Widowed0.0% DivorcedFemales 38.3% Never married34.4% Now married15.8% Separated0.0% Widowed11.5% DivorcedWomen who did not give birth in the past 12 months Now married:
51.5% (98)Unmarried:
48.5% (92)
Marital status - Two or more races population 15 years and over
Males 33.8% Never married40.1% Now married4.9% Separated0.0% Widowed21.1% DivorcedFemales 62.7% Never married37.3% Now married0.0% Separated0.0% Widowed0.0% DivorcedWomen who did not give birth in the past 12 months Now married:
27.3% (15)Unmarried:
72.7% (41)
Marital status - White alone, not Hispanic / Latino population 15 years and over
Males 47.0% Never married38.4% Now married0.0% Separated3.0% Widowed11.7% DivorcedFemales 28.7% Never married42.7% Now married2.0% Separated9.8% Widowed16.7% DivorcedWomen who gave birth in the past 12 months Now married:
41.5% (16)Unmarried:
58.5% (23)
Women who did not give birth in the past 12 months Now married:
36.7% (308)Unmarried:
63.3% (530)
Marital status - Hispanic or Latino population 15 years and over
Males 0.0% Never married100.0% Now married0.0% Separated0.0% Widowed0.0% DivorcedFemales 28.6% Never married71.4% Now married0.0% Separated0.0% Widowed0.0% DivorcedWomen who gave birth in the past 12 months Now married:
100.0% (38)Unmarried:
0.0% (0)
Women who did not give birth in the past 12 months Now married:
0.0% (0)Unmarried:
100.0% (15)
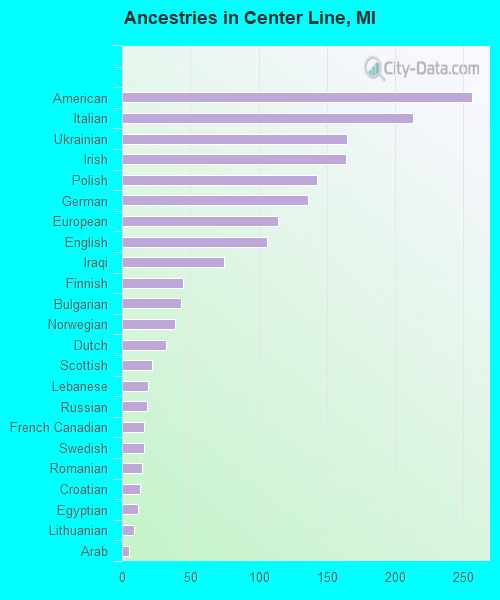
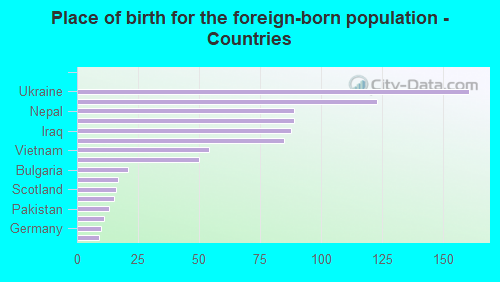
Ancestries in Center Line
256 5.7% American213 4.8% Italian165 3.7% Ukrainian164 3.7% Irish143 3.2% Polish136 3.0% German114 2.5% European106 2.4% English75 1.7% Iraqi45 1.0% Finnish43 1.0% Bulgarian39 0.9% Norwegian32 0.7% Dutch22 0.5% Scottish19 0.4% Lebanese18 0.4% Russian16 0.4% French Canadian16 0.4% Swedish15 0.3% Romanian13 0.3% Croatian12 0.3% Egyptian9 0.2% Lithuanian5 0.1% Arab
Children Nativity (place of birth) in Center Line
Children under 6 years - Living with two parents Both parents native 99 100.0% NativeBoth parents foreign-born 21 100.0% NativeOne native, one foreign-born parent 14 100.0% NativeChildren under 6 years - Living with one parent Native parent 262 100.0% NativeChildren 6 to 17 years - Living with two parents Both parents native 399 100.0% NativeBoth parents foreign-born 55 56.0% Native43 44.0% Foreign-bornOne native, one foreign-born parent 21 100.0% NativeChildren 6 to 17 years - Living with one parent Native parent 729 100.0% NativeForeign-born parent 29 47.3% Native32 52.7% Foreign-born
Grandparents responsible for own grandchildren in Center Line
Grandparents (30 to 59 years) White / Caucasian 32 100.0% Responsible for grandchildrenBlack or African American 23 100.0% Responsible for grandchildrenAsian 17 100.0% Not responsible for grandchildrenWhite alone, not Hispanic / Latino 32 100.0% Responsible for grandchildrenGrandparents (60 years and over) White / Caucasian 10 37.8% Responsible for grandchildren16 62.2% Not responsible for grandchildrenBlack or African American 27 72.6% Responsible for grandchildren10 27.4% Not responsible for grandchildrenWhite alone, not Hispanic / Latino 10 37.5% Responsible for grandchildren17 62.5% Not responsible for grandchildren