Races in Cedar Hills, Utah (UT) Detailed Stats
Data:
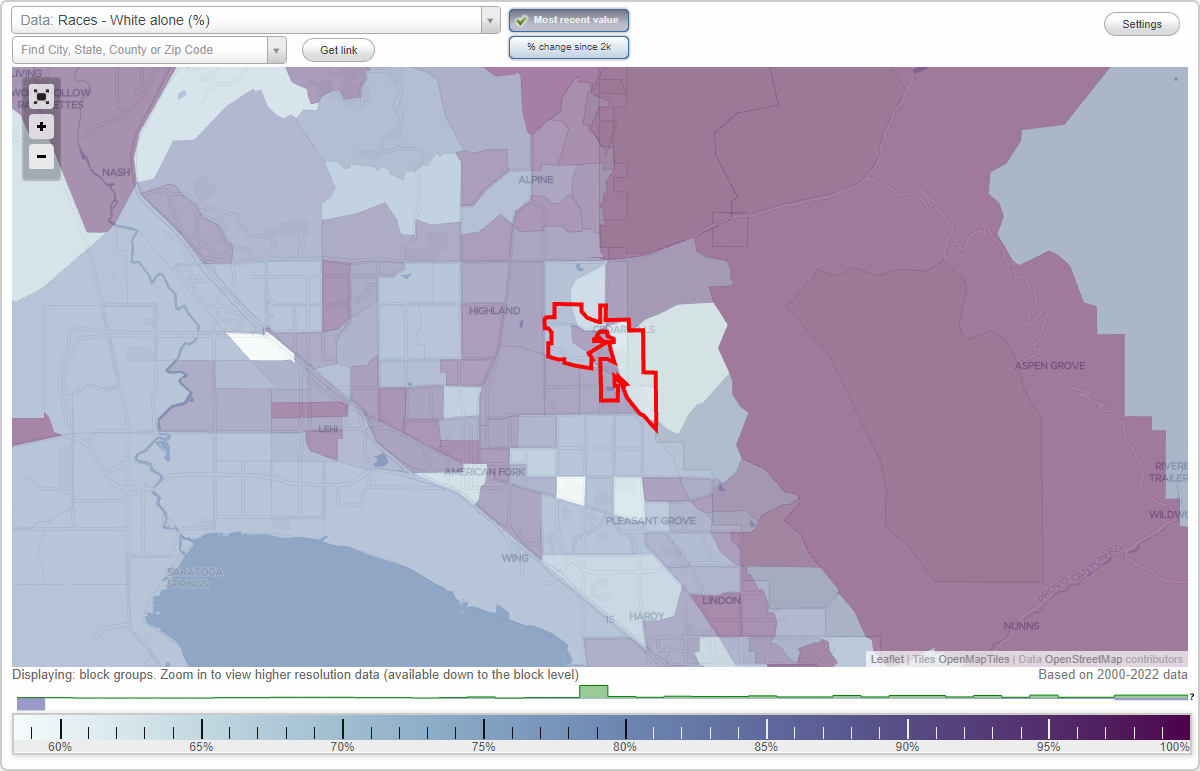
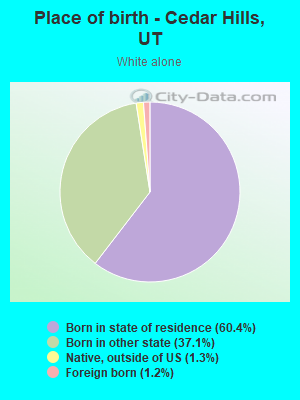
Races - White alone (%)
Races - White alone (% change since 2000)
Races - Black alone (%)
Races - Black alone (% change since 2000)
Races - American Indian alone (%)
Races - American Indian alone (% change since 2000)
Races - Asian alone (%)
Races - Asian alone (% change since 2000)
Races - Hispanic (%)
Races - Hispanic (% change since 2000)
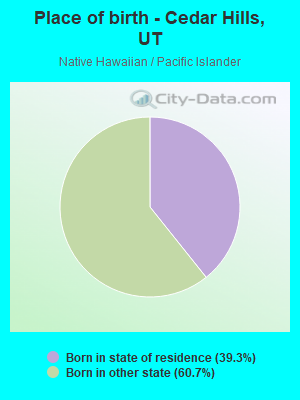
Races - Native Hawaiian and Other Pacific Islander alone (%)
Races - Native Hawaiian and Other Pacific Islander alone (% change since 2000)
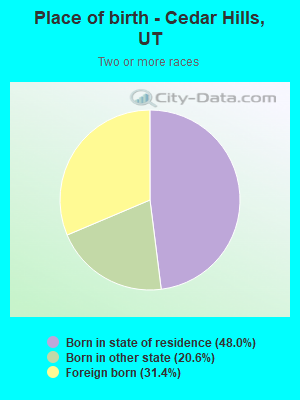
Races - Two or more races(%)
Races - Two or more races(% change since 2000)
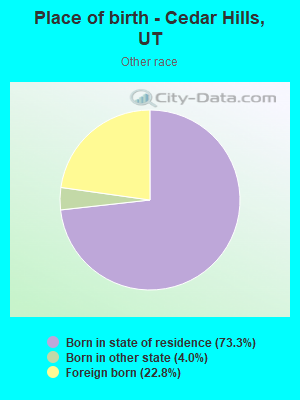
Races - Other race alone (%)
Races - Other race alone (% change since 2000)
Racial diversity
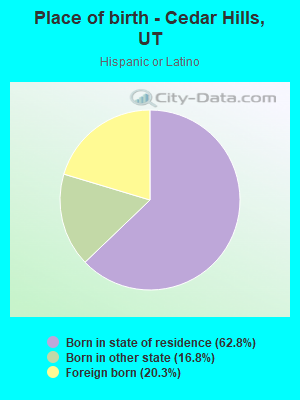
Place of birth - Born in state of residence (%)
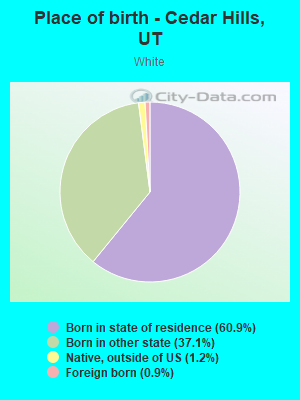
Place of birth - Born in state of residence (%) - White
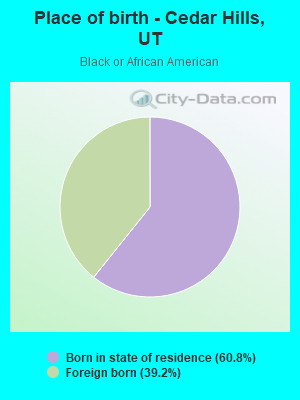
Place of birth - Born in state of residence (%) - Black or African American
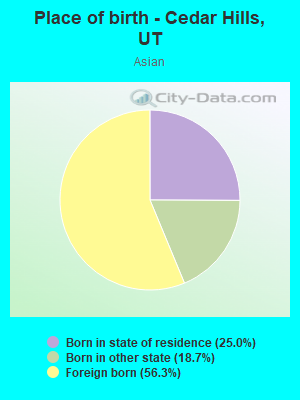
Place of birth - Born in state of residence (%) - Asian
Place of birth - Born in state of residence (%) - Hispanic or Latino
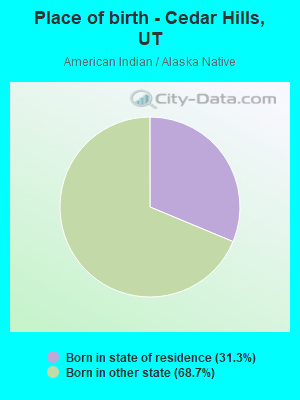
Place of birth - Born in state of residence (%) - American Indian and Alaska Native
Place of birth - Born in state of residence (%) - Multirace
Place of birth - Born in state of residence (%) - Other Race
Place of birth - Born in other state (%)
Place of birth - Born in other state (%) - White
Place of birth - Born in other state (%) - Black or African American
Place of birth - Born in other state (%) - Asian
Place of birth - Born in other state (%) - Hispanic or Latino
Place of birth - Born in other state (%) - American Indian and Alaska Native
Place of birth - Born in other state (%) - Multirace
Place of birth - Born in other state (%) - Other Race
Place of birth - Native, outside of US (%)
Place of birth - Native, outside of US (%) - White
Place of birth - Native, outside of US (%) - Black or African American
Place of birth - Native, outside of US (%) - Asian
Place of birth - Native, outside of US (%) - Hispanic or Latino
Place of birth - Native, outside of US (%) - American Indian and Alaska Native
Place of birth - Native, outside of US (%) - Multirace
Place of birth - Native, outside of US (%) - Other Race
Place of birth - Foreign born (%)
Place of birth - Foreign born (%) - White
Place of birth - Foreign born (%) - Black or African American
Place of birth - Foreign born (%) - Asian
Place of birth - Foreign born (%) - Hispanic or Latino
Place of birth - Foreign born (%) - American Indian and Alaska Native
Place of birth - Foreign born (%) - Multirace
Place of birth - Foreign born (%) - Other Race
Residents speaking English at home (%)
Residents speaking English at home - Born in the United States (%)
Residents speaking English at home - Native, born elsewhere (%)
Residents speaking English at home - Foreign born (%)
Residents speaking Spanish at home (%)
Residents speaking Spanish at home - Born in the United States (%)
Residents speaking Spanish at home - Native, born elsewhere (%)
Residents speaking Spanish at home - Foreign born (%)
Residents speaking other language at home (%)
Residents speaking other language at home - Born in the United States (%)
Residents speaking other language at home - Native, born elsewhere (%)
Residents speaking other language at home - Foreign born (%)
Marital status - Never married (%)
Marital status - Now married (%)
Marital status - Separated (%)
Marital status - Widowed (%)
Marital status - Divorced (%)
Ancestries Reported - Arab (%)
Ancestries Reported - Czech (%)
Ancestries Reported - Danish (%)
Ancestries Reported - Dutch (%)
Ancestries Reported - English (%)
Ancestries Reported - French (%)
Ancestries Reported - French Canadian (%)
Ancestries Reported - German (%)
Ancestries Reported - Greek (%)
Ancestries Reported - Hungarian (%)
Ancestries Reported - Irish (%)
Ancestries Reported - Italian (%)
Ancestries Reported - Lithuanian (%)
Ancestries Reported - Norwegian (%)
Ancestries Reported - Polish (%)
Ancestries Reported - Portuguese (%)
Ancestries Reported - Russian (%)
Ancestries Reported - Scotch-Irish (%)
Ancestries Reported - Scottish (%)
Ancestries Reported - Slovak (%)
Ancestries Reported - Subsaharan African (%)
Ancestries Reported - Swedish (%)
Ancestries Reported - Swiss (%)
Ancestries Reported - Ukrainian (%)
Ancestries Reported - United States (%)
Ancestries Reported - Welsh (%)
Ancestries Reported - West Indian (%)
Ancestries Reported - Other (%)
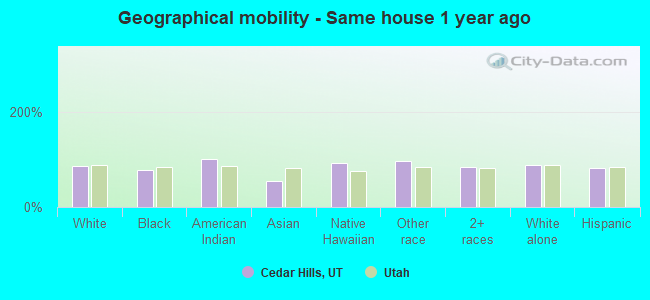
Geographical mobility - Same house 1 year ago (%)
Geographical mobility - Same house 1 year ago (%) - White
Geographical mobility - Same house 1 year ago (%) - Black or African American
Geographical mobility - Same house 1 year ago (%) - Asian
Geographical mobility - Same house 1 year ago (%) - Hispanic or Latino
Geographical mobility - Same house 1 year ago (%) - American Indian and Alaska Native
Geographical mobility - Same house 1 year ago (%) - Multirace
Geographical mobility - Same house 1 year ago (%) - Other Race
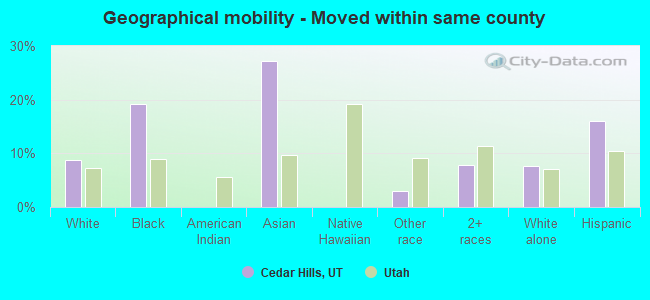
Geographical mobility - Moved within same county (%)
Geographical mobility - Moved within same county (%) - White
Geographical mobility - Moved within same county (%) - Black or African American
Geographical mobility - Moved within same county (%) - Asian
Geographical mobility - Moved within same county (%) - Hispanic or Latino
Geographical mobility - Moved within same county (%) - American Indian and Alaska Native
Geographical mobility - Moved within same county (%) - Multirace
Geographical mobility - Moved within same county (%) - Other Race
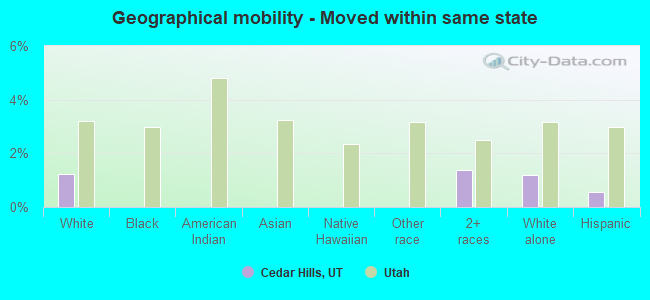
Geographical mobility - Moved from different county within same state (%)
Geographical mobility - Moved from different county within same state (%) - White
Geographical mobility - Moved from different county within same state (%) - Black or African American
Geographical mobility - Moved from different county within same state (%) - Asian
Geographical mobility - Moved from different county within same state (%) - Hispanic or Latino
Geographical mobility - Moved from different county within same state (%) - American Indian and Alaska Native
Geographical mobility - Moved from different county within same state (%) - Multirace
Geographical mobility - Moved from different county within same state (%) - Other Race
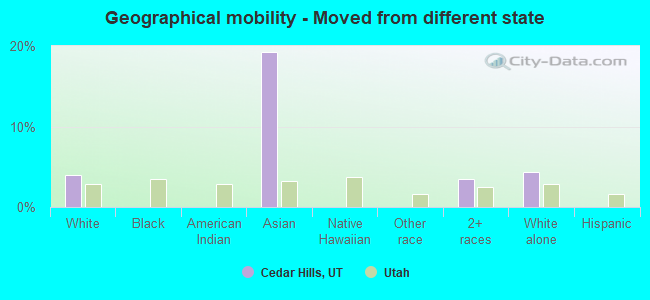
Geographical mobility - Moved from different state (%)
Geographical mobility - Moved from different state (%) - White
Geographical mobility - Moved from different state (%) - Black or African American
Geographical mobility - Moved from different state (%) - Asian
Geographical mobility - Moved from different state (%) - Hispanic or Latino
Geographical mobility - Moved from different state (%) - American Indian and Alaska Native
Geographical mobility - Moved from different state (%) - Multirace
Geographical mobility - Moved from different state (%) - Other Race
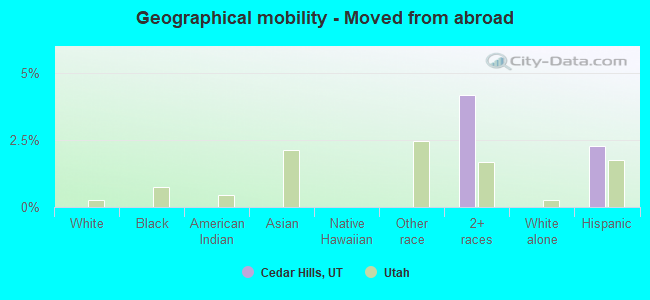
Geographical mobility - Moved from abroad (%)
Geographical mobility - Moved from abroad (%) - White
Geographical mobility - Moved from abroad (%) - Black or African American
Geographical mobility - Moved from abroad (%) - Asian
Geographical mobility - Moved from abroad (%) - Hispanic or Latino
Geographical mobility - Moved from abroad (%) - American Indian and Alaska Native
Geographical mobility - Moved from abroad (%) - Multirace
Geographical mobility - Moved from abroad (%) - Other Race
Place of birth for the foreign-born population - Ireland (%)
Place of birth for the foreign-born population - Denmark (%)
Place of birth for the foreign-born population - Norway (%)
Place of birth for the foreign-born population - Sweden (%)
Place of birth for the foreign-born population - United Kingdom (%)
Place of birth for the foreign-born population - England (%)
Place of birth for the foreign-born population - Scotland (%)
Place of birth for the foreign-born population - Other Northern Europe (%)
Place of birth for the foreign-born population - Austria (%)
Place of birth for the foreign-born population - Belgium (%)
Place of birth for the foreign-born population - France (%)
Place of birth for the foreign-born population - Germany (%)
Place of birth for the foreign-born population - Netherlands (%)
Place of birth for the foreign-born population - Switzerland (%)
Place of birth for the foreign-born population - Other Western Europe (%)
Place of birth for the foreign-born population - Greece (%)
Place of birth for the foreign-born population - Italy (%)
Place of birth for the foreign-born population - Portugal (%)
Place of birth for the foreign-born population - Spain (%)
Place of birth for the foreign-born population - Other Southern Europe (%)
Place of birth for the foreign-born population - Albania (%)
Place of birth for the foreign-born population - Belarus (%)
Place of birth for the foreign-born population - Bosnia and Herzegovina (%)
Place of birth for the foreign-born population - Bulgaria (%)
Place of birth for the foreign-born population - Croatia (%)
Place of birth for the foreign-born population - Czechoslovakia (%)
Place of birth for the foreign-born population - Hungary (%)
Place of birth for the foreign-born population - Latvia (%)
Place of birth for the foreign-born population - Lithuania (%)
Place of birth for the foreign-born population - North Macedonia (Macedonia) (%)
Place of birth for the foreign-born population - Moldova (%)
Place of birth for the foreign-born population - Poland (%)
Place of birth for the foreign-born population - Romania (%)
Place of birth for the foreign-born population - Russia (%)
Place of birth for the foreign-born population - Serbia (%)
Place of birth for the foreign-born population - Ukraine (%)
Place of birth for the foreign-born population - Other Eastern Europe (%)
Place of birth for the foreign-born population - China (%)
Place of birth for the foreign-born population - Hong Kong (%)
Place of birth for the foreign-born population - Taiwan (%)
Place of birth for the foreign-born population - Japan (%)
Place of birth for the foreign-born population - Korea (%)
Place of birth for the foreign-born population - Other Eastern Asia (%)
Place of birth for the foreign-born population - Afghanistan (%)
Place of birth for the foreign-born population - Bangladesh (%)
Place of birth for the foreign-born population - India (%)
Place of birth for the foreign-born population - Iran (%)
Place of birth for the foreign-born population - Kazakhstan (%)
Place of birth for the foreign-born population - Nepal (%)
Place of birth for the foreign-born population - Pakistan (%)
Place of birth for the foreign-born population - Sri Lanka (%)
Place of birth for the foreign-born population - Uzbekistan (%)
Place of birth for the foreign-born population - Other South Central Asia (%)
Place of birth for the foreign-born population - Burma (%)
Place of birth for the foreign-born population - Cambodia (%)
Place of birth for the foreign-born population - Indonesia (%)
Place of birth for the foreign-born population - Laos (%)
Place of birth for the foreign-born population - Malaysia (%)
Place of birth for the foreign-born population - Philippines (%)
Place of birth for the foreign-born population - Singapore (%)
Place of birth for the foreign-born population - Thailand (%)
Place of birth for the foreign-born population - Vietnam (%)
Place of birth for the foreign-born population - Other South Eastern Asia (%)
Place of birth for the foreign-born population - Armenia (%)
Place of birth for the foreign-born population - Iraq (%)
Place of birth for the foreign-born population - Israel (%)
Place of birth for the foreign-born population - Jordan (%)
Place of birth for the foreign-born population - Kuwait (%)
Place of birth for the foreign-born population - Lebanon (%)
Place of birth for the foreign-born population - Saudi Arabia (%)
Place of birth for the foreign-born population - Syria (%)
Place of birth for the foreign-born population - Turkey (%)
Place of birth for the foreign-born population - Yemen (%)
Place of birth for the foreign-born population - Other Western Asia (%)
Place of birth for the foreign-born population - Eritrea (%)
Place of birth for the foreign-born population - Ethiopia (%)
Place of birth for the foreign-born population - Kenya (%)
Place of birth for the foreign-born population - Somalia (%)
Place of birth for the foreign-born population - Uganda (%)
Place of birth for the foreign-born population - Zimbabwe (%)
Place of birth for the foreign-born population - Other Eastern Africa (%)
Place of birth for the foreign-born population - Cameroon (%)
Place of birth for the foreign-born population - Congo (%)
Place of birth for the foreign-born population - Democratic Republic of Congo (Zaire) (%)
Place of birth for the foreign-born population - Other Middle Africa (%)
Place of birth for the foreign-born population - Egypt (%)
Place of birth for the foreign-born population - Morocco (%)
Place of birth for the foreign-born population - Sudan (%)
Place of birth for the foreign-born population - Other Northern Africa (%)
Place of birth for the foreign-born population - South Africa (%)
Place of birth for the foreign-born population - Other Southern Africa (%)
Place of birth for the foreign-born population - Cabo Verde (%)
Place of birth for the foreign-born population - Ghana (%)
Place of birth for the foreign-born population - Liberia (%)
Place of birth for the foreign-born population - Nigeria (%)
Place of birth for the foreign-born population - Senegal (%)
Place of birth for the foreign-born population - Sierra Leone (%)
Place of birth for the foreign-born population - Other Western Africa (%)
Place of birth for the foreign-born population - Australia (%)
Place of birth for the foreign-born population - New Zealand (%)
Place of birth for the foreign-born population - Fiji (%)
Place of birth for the foreign-born population - Micronesia (%)
Place of birth for the foreign-born population - Bahamas (%)
Place of birth for the foreign-born population - Barbados (%)
Place of birth for the foreign-born population - Cuba (%)
Place of birth for the foreign-born population - Dominica (%)
Place of birth for the foreign-born population - Dominican Republic (%)
Place of birth for the foreign-born population - Grenada (%)
Place of birth for the foreign-born population - Haiti (%)
Place of birth for the foreign-born population - Jamaica (%)
Place of birth for the foreign-born population - St. Vincent and the Grenadines (%)
Place of birth for the foreign-born population - Trinidad and Tobago (%)
Place of birth for the foreign-born population - West Indies (%)
Place of birth for the foreign-born population - Other Caribbean (%)
Place of birth for the foreign-born population - Belize (%)
Place of birth for the foreign-born population - Costa Rica (%)
Place of birth for the foreign-born population - El Salvador (%)
Place of birth for the foreign-born population - Guatemala (%)
Place of birth for the foreign-born population - Honduras (%)
Place of birth for the foreign-born population - Mexico (%)
Place of birth for the foreign-born population - Nicaragua (%)
Place of birth for the foreign-born population - Panama (%)
Place of birth for the foreign-born population - Other Central America (%)
Place of birth for the foreign-born population - Argentina (%)
Place of birth for the foreign-born population - Bolivia (%)
Place of birth for the foreign-born population - Brazil (%)
Place of birth for the foreign-born population - Chile (%)
Place of birth for the foreign-born population - Colombia (%)
Place of birth for the foreign-born population - Ecuador (%)
Place of birth for the foreign-born population - Guyana (%)
Place of birth for the foreign-born population - Peru (%)
Place of birth for the foreign-born population - Uruguay (%)
Place of birth for the foreign-born population - Venezuela (%)
Place of birth for the foreign-born population - Other South America (%)
Place of birth for the foreign-born population - Canada (%)
Place of birth for the foreign-born population - Other Northern America (%)
Place of birth for the foreign-born population - Other (%)
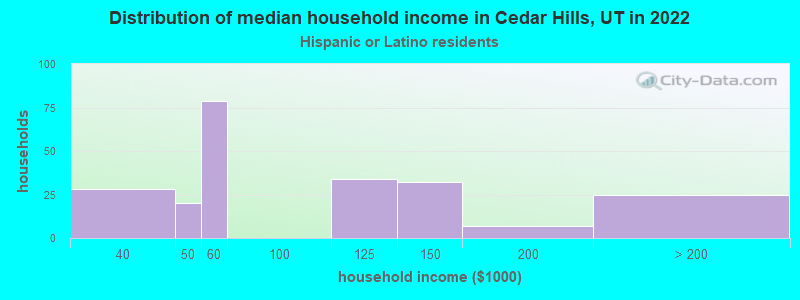
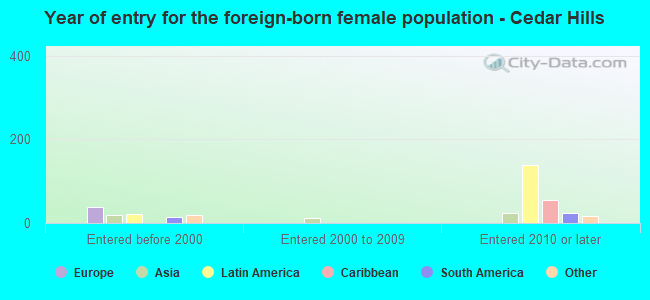
According to 2022 data, the most numerous races in Cedar Hills, UT are White alone (8,262 residents), Hispanic (1,483 residents), and Two or more races (281 residents). 91.2% of Cedar Hills residents speak English at home. 4.5% of Cedar Hills, UT residents are foreign-born (3.0% born in Latin America, 0.6% born in Asia), which is 79.1% less than the foreign-born rate of 8.0% across the entire state of Utah.
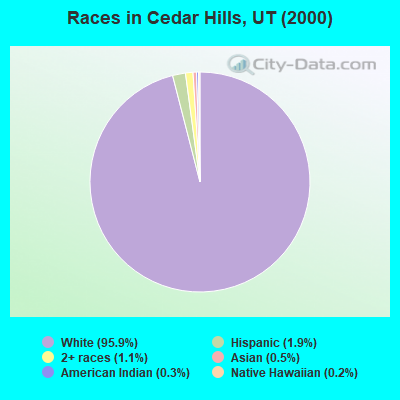
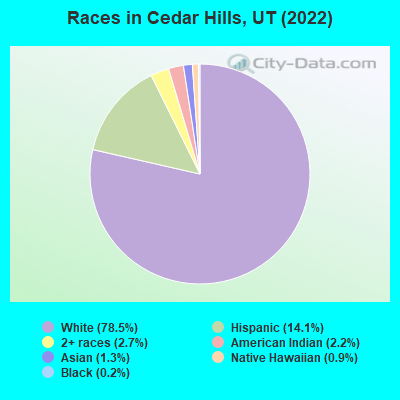
Race distribution in Cedar Hills
2000 2022
1,904,265 85.3% White alone 201,559 9.0% Hispanic 36,483 1.6% Asian alone 31,308 1.4% Two or more races 26,663 1.2% American Indian alone 14,806 0.7% Native Hawaiian and Other 16,137 0.7% Black alone 1,948 0.09% Other race alone
2,557,466 75.6% White alone 512,086 15.1% Hispanic 119,308 3.5% Two or more races 82,388 2.4% Asian alone 36,978 1.1% Native Hawaiian and Other 34,873 1.0% Black alone 22,803 0.7% American Indian alone 14,898 0.4% Other race alone
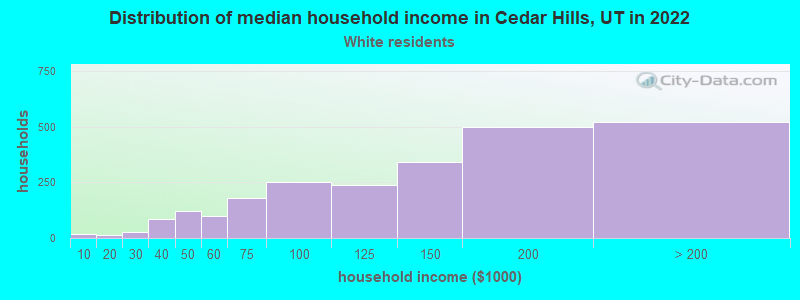
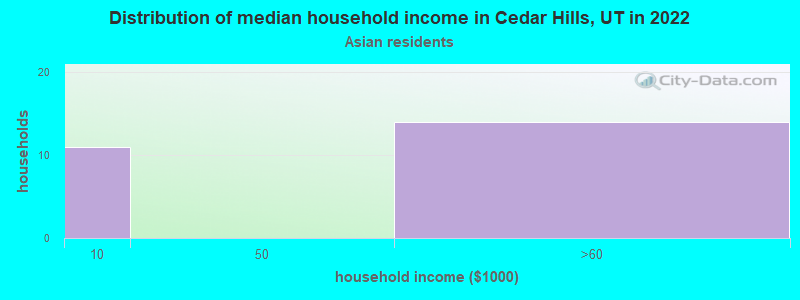
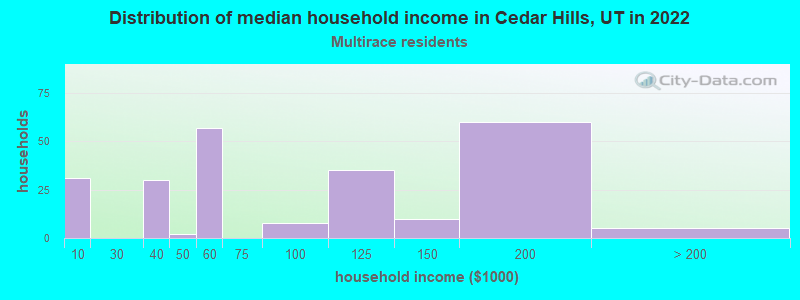
Income and house value in Cedar Hills Median household income in 2022 $136,930 White non-Hispanic householders$78,432 Two or more races householdersMedian 2022 house value $690,960 White Non-Hispanic householders$525,578 Native Hawaiian and other Pacific Islander householders$481,780 Some other race householders$656,972 Two or more races householders$569,376 Hispanic or Latino householders
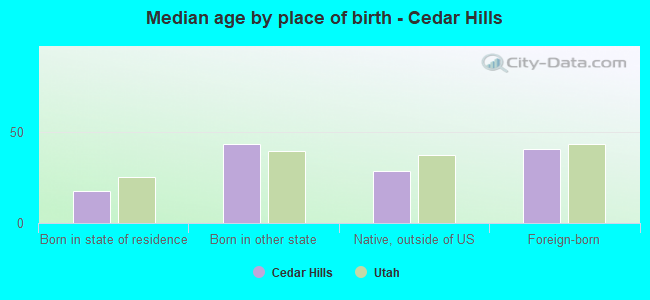
Median age by race in Cedar Hills
28.2 Median age for White residents29.6 26.5 -591,194,968.0 Median age for Black or African American residents-545,722,713.3 -640,650,405.9 20.9 Median age for American Indian / Alaska Native residents20.2 -706,192,357.7 27.7 Median age for Asian residents20.1 33.2 38.1 Median age for Native Hawaiian / Pacific Islander residents-749,999,999.2 -583,006,535.4 8.3 Median age for Other race residents20.0 4.1 17.9 Median age for Two or more races residents20.4 16.6 30.1 Median age for White alone residents30.5 28.9 14.7 Median age for Hispanic or Latino residents16.3 14.1
Owner/renter occupied households by race in Cedar Hills
House owners and renters - White residents 2,030 86.6% Owner occupied314 13.4% Renter occupiedHouse owners and renters - American Indian / Alaska Native residents 13 100.0% Owner occupiedHouse owners and renters - Asian residents 13 47.4% Owner occupied14 52.6% Renter occupiedHouse owners and renters - Native Hawaiian / Pacific Islander residents 39 100.0% Owner occupiedHouse owners and renters - Other race residents 54 100.0% Owner occupiedHouse owners and renters - Two or more races residents 187 85.9% Owner occupied31 14.1% Renter occupiedHouse owners and renters - White alone residents 2,032 87.7% Owner occupied286 12.3% Renter occupiedHouse owners and renters - Hispanic or Latino residents 143 66.9% Owner occupied71 33.1% Renter occupied
Language usage in Cedar Hills
English speakers - Total 91.2% of residents of Cedar Hills speak English at home.
5.9% of residents speak Spanish at home 283 49.8% Speak English very well285 50.2% Speak English less than very well2.8% of residents speak other language at home 215 78.2% Speak English very well60 21.8% Speak English less than very well
English speakers - Born in the United States 96.4% of residents of Cedar Hills speak English at home.
1.7% of residents speak Spanish at home 61 100.0% Speak English very well1.7% of residents speak other language at home 47 75.8% Speak English very well15 24.2% Speak English less than very well
English speakers - Native, born elsewhere 98.3% of residents of Cedar Hills speak English at home.
8.3% of residents speak other language at home 10 100.0% Speak English very well
English speakers - Foreign-born 28.9% of residents of Cedar Hills speak English at home.
54.9% of residents speak Spanish at home 108 39.0% Speak English very well169 61.0% Speak English less than very well15.4% of residents speak other language at home 37 47.4% Speak English very well41 52.6% Speak English less than very well
White (Caucasian) - Speak only English Native:
97.4% (7,725)Foreign-born:
93.8% (70)
White (Caucasian) - Speak another language Native:
3.2% (254)Foreign-born:
36.2% (27)
Asian - Speak only English Native:
69.7% (35)Foreign-born:
28.8% (21)
Asian - Speak another language Native:
25.0% (12)Foreign-born:
71.7% (53)
Other race - Speak only English Native:
8.4% (11)Foreign-born:
6.7% (4)
Other race - Speak another language Native:
100.0% (129)Foreign-born:
91.7% (54)
Two or more races - Speak only English Native:
92.6% (629)Foreign-born:
14.0% (50)
White alone - Speak only English Native:
96.3% (7,330)Foreign-born:
84.7% (80)
White alone - Speak another language Native:
3.7% (285)Foreign-born:
21.2% (20)
Hispanic or Latino - Speak only English Native:
90.1% (831)Foreign-born:
6.3% (20)
Hispanic or Latino - Speak another language Native:
10.5% (97)Foreign-born:
91.8% (284)
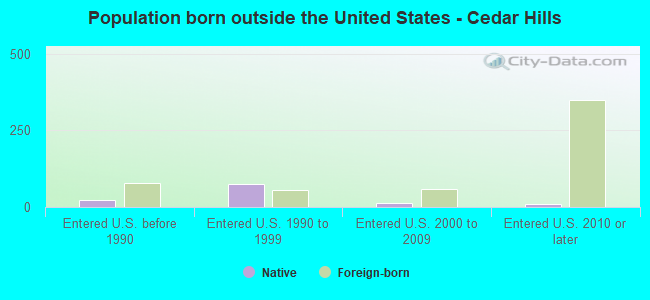
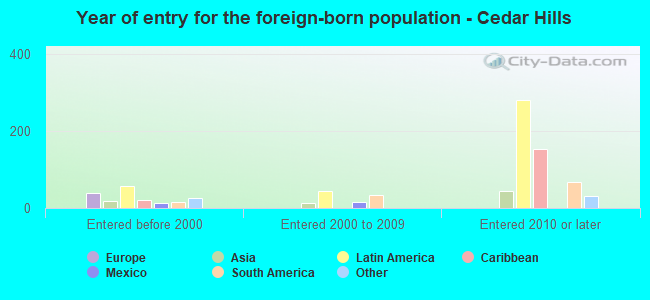
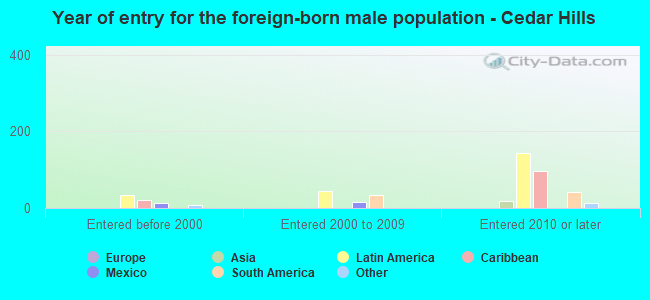
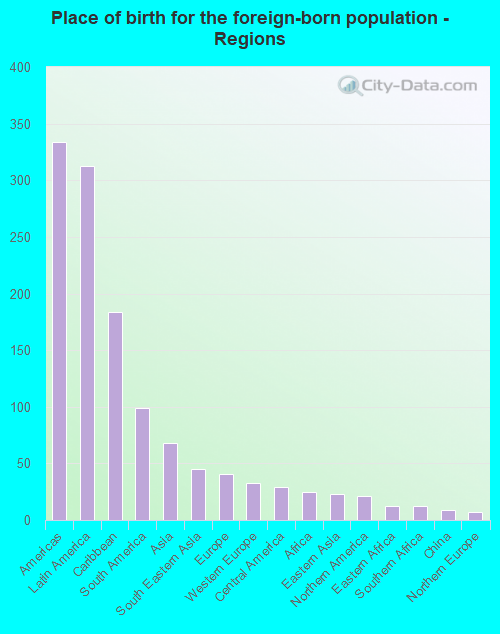
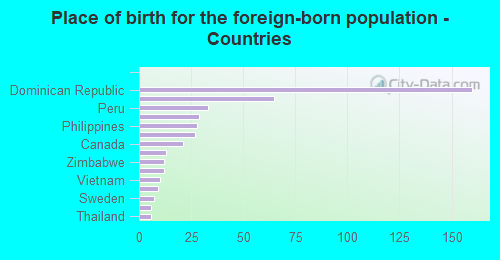
Foreign-born residents in Cedar Hills 470 residents are foreign born (3.0% Latin America , 0.6% Asia ).
Marital status for residents in Cedar Hills Marital status - White (Caucasian) population 15 years and over
Males 30.4% Never married65.9% Now married0.5% Separated0.8% Widowed2.4% DivorcedFemales 24.9% Never married66.2% Now married0.9% Separated2.6% Widowed5.4% DivorcedWomen who gave birth in the past 12 months Now married:
100.0% (179)Unmarried:
0.0% (0)
Women who did not give birth in the past 12 months Now married:
56.7% (1,088)Unmarried:
43.3% (829)
Marital status - American Indian / Alaska Native population 15 years and over
Males 100.0% Never married0.0% Now married0.0% Separated0.0% Widowed0.0% DivorcedFemales 67.9% Never married0.0% Now married0.0% Separated0.0% Widowed32.1% DivorcedWomen who did not give birth in the past 12 months Now married:
0.0% (0)Unmarried:
100.0% (39)
Marital status - Asian population 15 years and over
Males 63.2% Never married36.8% Now married0.0% Separated0.0% Widowed0.0% DivorcedFemales 0.0% Never married100.0% Now married0.0% Separated0.0% Widowed0.0% DivorcedWomen who gave birth in the past 12 months Now married:
100.0% (15)Unmarried:
0.0% (0)
Women who did not give birth in the past 12 months Now married:
100.0% (33)Unmarried:
0.0% (0)
Marital status - Native Hawaiian / Pacific Islander population 15 years and over
Males 0.0% Never married100.0% Now married0.0% Separated0.0% Widowed0.0% DivorcedFemales 0.0% Never married100.0% Now married0.0% Separated0.0% Widowed0.0% DivorcedWomen who did not give birth in the past 12 months Now married:
100.0% (30)Unmarried:
0.0% (0)
Marital status - Other race population 15 years and over
Males 20.0% Never married80.0% Now married0.0% Separated0.0% Widowed0.0% DivorcedFemales 100.0% Never married0.0% Now married0.0% Separated0.0% Widowed0.0% DivorcedWomen who did not give birth in the past 12 months Now married:
0.0% (0)Unmarried:
100.0% (7)
Marital status - Two or more races population 15 years and over
Males 57.2% Never married29.3% Now married0.0% Separated13.5% Widowed0.0% DivorcedFemales 50.0% Never married34.9% Now married7.9% Separated5.9% Widowed1.3% DivorcedWomen who did not give birth in the past 12 months Now married:
36.3% (115)Unmarried:
63.7% (201)
Marital status - White alone, not Hispanic / Latino population 15 years and over
Males 30.9% Never married65.3% Now married0.5% Separated0.9% Widowed2.5% DivorcedFemales 24.0% Never married68.0% Now married1.0% Separated2.7% Widowed4.3% DivorcedWomen who gave birth in the past 12 months Now married:
100.0% (172)Unmarried:
0.0% (0)
Women who did not give birth in the past 12 months Now married:
58.6% (1,083)Unmarried:
41.4% (764)
Marital status - Hispanic or Latino population 15 years and over
Males 40.6% Never married51.3% Now married0.0% Separated8.2% Widowed0.0% DivorcedFemales 55.0% Never married23.3% Now married8.0% Separated0.0% Widowed13.7% DivorcedWomen who gave birth in the past 12 months Now married:
100.0% (13)Unmarried:
0.0% (0)
Women who did not give birth in the past 12 months Now married:
24.4% (68)Unmarried:
75.6% (209)
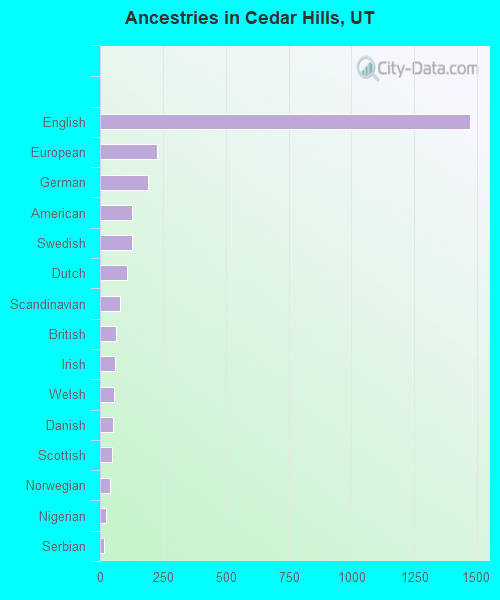
Ancestries in Cedar Hills
1,474 38.2% English227 5.9% European190 4.9% German128 3.3% American127 3.3% Swedish106 2.8% Dutch81 2.1% Scandinavian64 1.7% British58 1.5% Irish56 1.5% Welsh52 1.3% Danish47 1.2% Scottish40 1.0% Norwegian24 0.6% Nigerian16 0.4% Serbian13 0.3% Scotch-Irish13 0.3% Slavic9 0.2% Australian9 0.2% Italian6 0.2% French
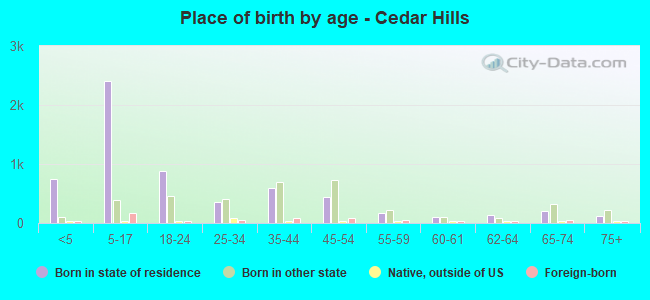
Children Nativity (place of birth) in Cedar Hills
Children under 6 years - Living with two parents Both parents native 822 100.0% NativeBoth parents foreign-born 8 100.0% NativeOne native, one foreign-born parent 105 100.0% NativeChildren under 6 years - Living with one parent Native parent 73 100.0% NativeChildren 6 to 17 years - Living with two parents Both parents native 2,051 99.9% Native2 0.1% Foreign-bornBoth parents foreign-born 23 100.0% Foreign-bornOne native, one foreign-born parent 127 100.0% NativeChildren 6 to 17 years - Living with one parent Native parent 281 84.0% Native53 16.0% Foreign-bornForeign-born parent 93 84.0% Native18 16.0% Foreign-born
Grandparents responsible for own grandchildren in Cedar Hills
Grandparents (30 to 59 years) White / Caucasian 65 39.9% Responsible for grandchildren98 60.1% Not responsible for grandchildrenWhite alone, not Hispanic / Latino 71 38.4% Responsible for grandchildren113 61.6% Not responsible for grandchildrenGrandparents (60 years and over) White / Caucasian 10 8.6% Responsible for grandchildren102 91.4% Not responsible for grandchildrenWhite alone, not Hispanic / Latino 10 9.6% Responsible for grandchildren92 90.4% Not responsible for grandchildren