Races in Castleton, Vermont (VT) Detailed Stats
Ancestries, Foreign-born residents, place of birth

Data:
Latest news about races in Castleton, VT collected exclusively by city-data.com from local newspapers, TV, and radio stations
1.7% of Castleton, VT residents are foreign-born , which is 136.1% less than the foreign-born rate of 4.0% across the entire state of Vermont.
Race distribution in Castleton

- 4,25197.3%White alone
- 471.1%Hispanic
- 250.6%Asian alone
- 210.5%Two or more races
- 140.3%American Indian alone
- 40.09%Black alone
- 40.09%Other race alone
- 10.02%Native Hawaiian and Other
Pacific Islander alone
2000
2022
-
- 585,43196.2%White alone
- 6,8091.1%Two or more races
- 5,5040.9%Hispanic
- 5,1600.8%Asian alone
- 2,9210.5%Black alone
- 2,3250.4%American Indian alone
- 5570.09%Other race alone
- 1200.02%Native Hawaiian and Other
Pacific Islander alone
-
- 583,54690.2%White alone
- 27,3404.2%Two or more races
- 14,7702.3%Hispanic
- 11,5121.8%Asian alone
- 6,2641.0%Black alone
- 2,5210.4%Other race alone
- 1,0520.2%American Indian alone
- 590.01%Native Hawaiian and Other
Pacific Islander alone
Income and house value in Castleton
- Median household income in 2022
- $70,953White non-Hispanic householders
- over $200,000Hispanic or Latino race householders
- Median 2022 house value
- $234,187White Non-Hispanic householders
- $322,007Hispanic or Latino householders
Foreign-born residents in Castleton
74 residents are foreign born
| This city: | 1.7% |
| Vermont: | 3.8% |
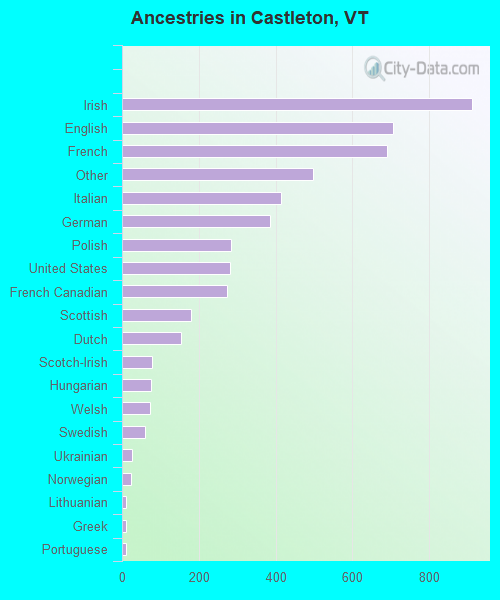
Ancestries in Castleton

- 91017.6%Irish
- 70513.7%English
- 69113.4%French
- 4989.6%Other
- 4138.0%Italian
- 3867.5%German
- 2855.5%Polish
- 2805.4%United States
- 2735.3%French Canadian
- 1793.5%Scottish
- 1533.0%Dutch
- 791.5%Scotch-Irish
- 751.5%Hungarian
- 721.4%Welsh
- 611.2%Swedish
- 270.5%Ukrainian
- 230.4%Norwegian
- 110.2%Lithuanian
- 100.2%Greek
- 100.2%Portuguese
- 70.1%Slovak
- 60.1%Danish
- 50.10%Czech
- 30.06%Russian