Races in Casselberry, Florida (FL) Detailed Stats
Data:
Races - White alone (%)
Races - White alone (% change since 2000)
Races - Black alone (%)
Races - Black alone (% change since 2000)
Races - American Indian alone (%)
Races - American Indian alone (% change since 2000)
Races - Asian alone (%)
Races - Asian alone (% change since 2000)
Races - Hispanic (%)
Races - Hispanic (% change since 2000)
Races - Native Hawaiian and Other Pacific Islander alone (%)
Races - Native Hawaiian and Other Pacific Islander alone (% change since 2000)
Races - Two or more races(%)
Races - Two or more races(% change since 2000)
Races - Other race alone (%)
Races - Other race alone (% change since 2000)
Racial diversity
Place of birth - Born in state of residence (%)
Place of birth - Born in state of residence (%) - White
Place of birth - Born in state of residence (%) - Black or African American
Place of birth - Born in state of residence (%) - Asian
Place of birth - Born in state of residence (%) - Hispanic or Latino
Place of birth - Born in state of residence (%) - American Indian and Alaska Native
Place of birth - Born in state of residence (%) - Multirace
Place of birth - Born in state of residence (%) - Other Race
Place of birth - Born in other state (%)
Place of birth - Born in other state (%) - White
Place of birth - Born in other state (%) - Black or African American
Place of birth - Born in other state (%) - Asian
Place of birth - Born in other state (%) - Hispanic or Latino
Place of birth - Born in other state (%) - American Indian and Alaska Native
Place of birth - Born in other state (%) - Multirace
Place of birth - Born in other state (%) - Other Race
Place of birth - Native, outside of US (%)
Place of birth - Native, outside of US (%) - White
Place of birth - Native, outside of US (%) - Black or African American
Place of birth - Native, outside of US (%) - Asian
Place of birth - Native, outside of US (%) - Hispanic or Latino
Place of birth - Native, outside of US (%) - American Indian and Alaska Native
Place of birth - Native, outside of US (%) - Multirace
Place of birth - Native, outside of US (%) - Other Race
Place of birth - Foreign born (%)
Place of birth - Foreign born (%) - White
Place of birth - Foreign born (%) - Black or African American
Place of birth - Foreign born (%) - Asian
Place of birth - Foreign born (%) - Hispanic or Latino
Place of birth - Foreign born (%) - American Indian and Alaska Native
Place of birth - Foreign born (%) - Multirace
Place of birth - Foreign born (%) - Other Race
Residents speaking English at home (%)
Residents speaking English at home - Born in the United States (%)
Residents speaking English at home - Native, born elsewhere (%)
Residents speaking English at home - Foreign born (%)
Residents speaking Spanish at home (%)
Residents speaking Spanish at home - Born in the United States (%)
Residents speaking Spanish at home - Native, born elsewhere (%)
Residents speaking Spanish at home - Foreign born (%)
Residents speaking other language at home (%)
Residents speaking other language at home - Born in the United States (%)
Residents speaking other language at home - Native, born elsewhere (%)
Residents speaking other language at home - Foreign born (%)
Marital status - Never married (%)
Marital status - Now married (%)
Marital status - Separated (%)
Marital status - Widowed (%)
Marital status - Divorced (%)
Ancestries Reported - Arab (%)
Ancestries Reported - Czech (%)
Ancestries Reported - Danish (%)
Ancestries Reported - Dutch (%)
Ancestries Reported - English (%)
Ancestries Reported - French (%)
Ancestries Reported - French Canadian (%)
Ancestries Reported - German (%)
Ancestries Reported - Greek (%)
Ancestries Reported - Hungarian (%)
Ancestries Reported - Irish (%)
Ancestries Reported - Italian (%)
Ancestries Reported - Lithuanian (%)
Ancestries Reported - Norwegian (%)
Ancestries Reported - Polish (%)
Ancestries Reported - Portuguese (%)
Ancestries Reported - Russian (%)
Ancestries Reported - Scotch-Irish (%)
Ancestries Reported - Scottish (%)
Ancestries Reported - Slovak (%)
Ancestries Reported - Subsaharan African (%)
Ancestries Reported - Swedish (%)
Ancestries Reported - Swiss (%)
Ancestries Reported - Ukrainian (%)
Ancestries Reported - United States (%)
Ancestries Reported - Welsh (%)
Ancestries Reported - West Indian (%)
Ancestries Reported - Other (%)
Geographical mobility - Same house 1 year ago (%)
Geographical mobility - Same house 1 year ago (%) - White
Geographical mobility - Same house 1 year ago (%) - Black or African American
Geographical mobility - Same house 1 year ago (%) - Asian
Geographical mobility - Same house 1 year ago (%) - Hispanic or Latino
Geographical mobility - Same house 1 year ago (%) - American Indian and Alaska Native
Geographical mobility - Same house 1 year ago (%) - Multirace
Geographical mobility - Same house 1 year ago (%) - Other Race
Geographical mobility - Moved within same county (%)
Geographical mobility - Moved within same county (%) - White
Geographical mobility - Moved within same county (%) - Black or African American
Geographical mobility - Moved within same county (%) - Asian
Geographical mobility - Moved within same county (%) - Hispanic or Latino
Geographical mobility - Moved within same county (%) - American Indian and Alaska Native
Geographical mobility - Moved within same county (%) - Multirace
Geographical mobility - Moved within same county (%) - Other Race
Geographical mobility - Moved from different county within same state (%)
Geographical mobility - Moved from different county within same state (%) - White
Geographical mobility - Moved from different county within same state (%) - Black or African American
Geographical mobility - Moved from different county within same state (%) - Asian
Geographical mobility - Moved from different county within same state (%) - Hispanic or Latino
Geographical mobility - Moved from different county within same state (%) - American Indian and Alaska Native
Geographical mobility - Moved from different county within same state (%) - Multirace
Geographical mobility - Moved from different county within same state (%) - Other Race
Geographical mobility - Moved from different state (%)
Geographical mobility - Moved from different state (%) - White
Geographical mobility - Moved from different state (%) - Black or African American
Geographical mobility - Moved from different state (%) - Asian
Geographical mobility - Moved from different state (%) - Hispanic or Latino
Geographical mobility - Moved from different state (%) - American Indian and Alaska Native
Geographical mobility - Moved from different state (%) - Multirace
Geographical mobility - Moved from different state (%) - Other Race
Geographical mobility - Moved from abroad (%)
Geographical mobility - Moved from abroad (%) - White
Geographical mobility - Moved from abroad (%) - Black or African American
Geographical mobility - Moved from abroad (%) - Asian
Geographical mobility - Moved from abroad (%) - Hispanic or Latino
Geographical mobility - Moved from abroad (%) - American Indian and Alaska Native
Geographical mobility - Moved from abroad (%) - Multirace
Geographical mobility - Moved from abroad (%) - Other Race
Place of birth for the foreign-born population - Ireland (%)
Place of birth for the foreign-born population - Denmark (%)
Place of birth for the foreign-born population - Norway (%)
Place of birth for the foreign-born population - Sweden (%)
Place of birth for the foreign-born population - United Kingdom (%)
Place of birth for the foreign-born population - England (%)
Place of birth for the foreign-born population - Scotland (%)
Place of birth for the foreign-born population - Other Northern Europe (%)
Place of birth for the foreign-born population - Austria (%)
Place of birth for the foreign-born population - Belgium (%)
Place of birth for the foreign-born population - France (%)
Place of birth for the foreign-born population - Germany (%)
Place of birth for the foreign-born population - Netherlands (%)
Place of birth for the foreign-born population - Switzerland (%)
Place of birth for the foreign-born population - Other Western Europe (%)
Place of birth for the foreign-born population - Greece (%)
Place of birth for the foreign-born population - Italy (%)
Place of birth for the foreign-born population - Portugal (%)
Place of birth for the foreign-born population - Spain (%)
Place of birth for the foreign-born population - Other Southern Europe (%)
Place of birth for the foreign-born population - Albania (%)
Place of birth for the foreign-born population - Belarus (%)
Place of birth for the foreign-born population - Bosnia and Herzegovina (%)
Place of birth for the foreign-born population - Bulgaria (%)
Place of birth for the foreign-born population - Croatia (%)
Place of birth for the foreign-born population - Czechoslovakia (%)
Place of birth for the foreign-born population - Hungary (%)
Place of birth for the foreign-born population - Latvia (%)
Place of birth for the foreign-born population - Lithuania (%)
Place of birth for the foreign-born population - North Macedonia (Macedonia) (%)
Place of birth for the foreign-born population - Moldova (%)
Place of birth for the foreign-born population - Poland (%)
Place of birth for the foreign-born population - Romania (%)
Place of birth for the foreign-born population - Russia (%)
Place of birth for the foreign-born population - Serbia (%)
Place of birth for the foreign-born population - Ukraine (%)
Place of birth for the foreign-born population - Other Eastern Europe (%)
Place of birth for the foreign-born population - China (%)
Place of birth for the foreign-born population - Hong Kong (%)
Place of birth for the foreign-born population - Taiwan (%)
Place of birth for the foreign-born population - Japan (%)
Place of birth for the foreign-born population - Korea (%)
Place of birth for the foreign-born population - Other Eastern Asia (%)
Place of birth for the foreign-born population - Afghanistan (%)
Place of birth for the foreign-born population - Bangladesh (%)
Place of birth for the foreign-born population - India (%)
Place of birth for the foreign-born population - Iran (%)
Place of birth for the foreign-born population - Kazakhstan (%)
Place of birth for the foreign-born population - Nepal (%)
Place of birth for the foreign-born population - Pakistan (%)
Place of birth for the foreign-born population - Sri Lanka (%)
Place of birth for the foreign-born population - Uzbekistan (%)
Place of birth for the foreign-born population - Other South Central Asia (%)
Place of birth for the foreign-born population - Burma (%)
Place of birth for the foreign-born population - Cambodia (%)
Place of birth for the foreign-born population - Indonesia (%)
Place of birth for the foreign-born population - Laos (%)
Place of birth for the foreign-born population - Malaysia (%)
Place of birth for the foreign-born population - Philippines (%)
Place of birth for the foreign-born population - Singapore (%)
Place of birth for the foreign-born population - Thailand (%)
Place of birth for the foreign-born population - Vietnam (%)
Place of birth for the foreign-born population - Other South Eastern Asia (%)
Place of birth for the foreign-born population - Armenia (%)
Place of birth for the foreign-born population - Iraq (%)
Place of birth for the foreign-born population - Israel (%)
Place of birth for the foreign-born population - Jordan (%)
Place of birth for the foreign-born population - Kuwait (%)
Place of birth for the foreign-born population - Lebanon (%)
Place of birth for the foreign-born population - Saudi Arabia (%)
Place of birth for the foreign-born population - Syria (%)
Place of birth for the foreign-born population - Turkey (%)
Place of birth for the foreign-born population - Yemen (%)
Place of birth for the foreign-born population - Other Western Asia (%)
Place of birth for the foreign-born population - Eritrea (%)
Place of birth for the foreign-born population - Ethiopia (%)
Place of birth for the foreign-born population - Kenya (%)
Place of birth for the foreign-born population - Somalia (%)
Place of birth for the foreign-born population - Uganda (%)
Place of birth for the foreign-born population - Zimbabwe (%)
Place of birth for the foreign-born population - Other Eastern Africa (%)
Place of birth for the foreign-born population - Cameroon (%)
Place of birth for the foreign-born population - Congo (%)
Place of birth for the foreign-born population - Democratic Republic of Congo (Zaire) (%)
Place of birth for the foreign-born population - Other Middle Africa (%)
Place of birth for the foreign-born population - Egypt (%)
Place of birth for the foreign-born population - Morocco (%)
Place of birth for the foreign-born population - Sudan (%)
Place of birth for the foreign-born population - Other Northern Africa (%)
Place of birth for the foreign-born population - South Africa (%)
Place of birth for the foreign-born population - Other Southern Africa (%)
Place of birth for the foreign-born population - Cabo Verde (%)
Place of birth for the foreign-born population - Ghana (%)
Place of birth for the foreign-born population - Liberia (%)
Place of birth for the foreign-born population - Nigeria (%)
Place of birth for the foreign-born population - Senegal (%)
Place of birth for the foreign-born population - Sierra Leone (%)
Place of birth for the foreign-born population - Other Western Africa (%)
Place of birth for the foreign-born population - Australia (%)
Place of birth for the foreign-born population - New Zealand (%)
Place of birth for the foreign-born population - Fiji (%)
Place of birth for the foreign-born population - Micronesia (%)
Place of birth for the foreign-born population - Bahamas (%)
Place of birth for the foreign-born population - Barbados (%)
Place of birth for the foreign-born population - Cuba (%)
Place of birth for the foreign-born population - Dominica (%)
Place of birth for the foreign-born population - Dominican Republic (%)
Place of birth for the foreign-born population - Grenada (%)
Place of birth for the foreign-born population - Haiti (%)
Place of birth for the foreign-born population - Jamaica (%)
Place of birth for the foreign-born population - St. Vincent and the Grenadines (%)
Place of birth for the foreign-born population - Trinidad and Tobago (%)
Place of birth for the foreign-born population - West Indies (%)
Place of birth for the foreign-born population - Other Caribbean (%)
Place of birth for the foreign-born population - Belize (%)
Place of birth for the foreign-born population - Costa Rica (%)
Place of birth for the foreign-born population - El Salvador (%)
Place of birth for the foreign-born population - Guatemala (%)
Place of birth for the foreign-born population - Honduras (%)
Place of birth for the foreign-born population - Mexico (%)
Place of birth for the foreign-born population - Nicaragua (%)
Place of birth for the foreign-born population - Panama (%)
Place of birth for the foreign-born population - Other Central America (%)
Place of birth for the foreign-born population - Argentina (%)
Place of birth for the foreign-born population - Bolivia (%)
Place of birth for the foreign-born population - Brazil (%)
Place of birth for the foreign-born population - Chile (%)
Place of birth for the foreign-born population - Colombia (%)
Place of birth for the foreign-born population - Ecuador (%)
Place of birth for the foreign-born population - Guyana (%)
Place of birth for the foreign-born population - Peru (%)
Place of birth for the foreign-born population - Uruguay (%)
Place of birth for the foreign-born population - Venezuela (%)
Place of birth for the foreign-born population - Other South America (%)
Place of birth for the foreign-born population - Canada (%)
Place of birth for the foreign-born population - Other Northern America (%)
Place of birth for the foreign-born population - Other (%)
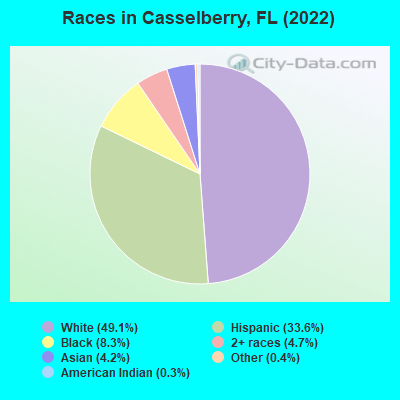
According to 2022 data, the most numerous races in Casselberry, FL are White alone (14,505 residents), Hispanic (9,934 residents), and Black alone (2,451 residents). 67.1% of Casselberry residents speak English at home. 21.4% of Casselberry, FL residents are foreign-born (16.1% born in Latin America), which is about the same as the foreign-born rate of 21.0% across the entire state of Florida.
Race distribution in Casselberry
2000 2022
10,458,509 65.4% White alone 2,682,715 16.8% Hispanic 2,264,268 14.2% Black alone 261,693 1.6% Asian alone 236,954 1.5% Two or more races 42,358 0.3% American Indian alone 28,994 0.2% Other race alone 6,887 0.04% Native Hawaiian and Other
11,309,403 50.8% White alone 6,025,039 27.1% Hispanic 3,241,015 14.6% Black alone 861,630 3.9% Two or more races 623,692 2.8% Asian alone 152,054 0.7% Other race alone 22,504 0.1% American Indian alone 9,486 0.04% Native Hawaiian and Other
Income and house value in Casselberry Median household income in 2022 $63,556 White non-Hispanic householders$51,159 Black householders$78,995 Asian householders$60,946 Some other race householders$57,093 Two or more races householders$59,022 Hispanic or Latino race householdersMedian 2022 house value $309,690 White Non-Hispanic householders$275,395 Black or African American householders$329,089 American Indian or Alaska Native householders $321,121 Asian householders$270,892 Some other race householders$264,310 Two or more races householders$315,232 Hispanic or Latino householders
Median age by race in Casselberry
43.4 Median age for White residents42.9 44.3 34.0 Median age for Black or African American residents33.8 33.1 50.0 Median age for American Indian / Alaska Native residents40.6 -503,171,246.9 44.1 Median age for Asian residents45.9 42.4 -679,849,340.2 Median age for Native Hawaiian / Pacific Islander residents-858,307,848.3 -443,298,968.6 34.9 Median age for Other race residents37.0 29.1 34.8 Median age for Two or more races residents32.9 39.2 44.9 Median age for White alone residents45.4 44.9 36.9 Median age for Hispanic or Latino residents36.4 37.6
Owner/renter occupied households by race in Casselberry
House owners and renters - White residents 5,254 65.0% Owner occupied2,829 35.0% Renter occupiedHouse owners and renters - Black or African American residents 423 33.6% Owner occupied834 66.4% Renter occupiedHouse owners and renters - American Indian / Alaska Native residents 41 100.0% Renter occupiedHouse owners and renters - Asian residents 262 80.8% Owner occupied62 19.2% Renter occupiedHouse owners and renters - Other race residents 492 42.6% Owner occupied663 57.4% Renter occupiedHouse owners and renters - Two or more races residents 1,337 61.0% Owner occupied855 39.0% Renter occupiedHouse owners and renters - White alone residents 4,881 67.1% Owner occupied2,399 32.9% Renter occupiedHouse owners and renters - Hispanic or Latino residents 1,756 48.3% Owner occupied1,882 51.7% Renter occupied
Language usage in Casselberry
English speakers - Total 67.1% of residents of Casselberry speak English at home.
24.2% of residents speak Spanish at home 3,605 54.7% Speak English very well2,984 45.3% Speak English less than very well8.8% of residents speak other language at home 1,450 60.7% Speak English very well939 39.3% Speak English less than very well
English speakers - Born in the United States 85.8% of residents of Casselberry speak English at home.
10.5% of residents speak Spanish at home 1,110 91.5% Speak English very well103 8.5% Speak English less than very well3.7% of residents speak other language at home 285 66.1% Speak English very well146 33.9% Speak English less than very well
English speakers - Native, born elsewhere 38.8% of residents of Casselberry speak English at home.
58.3% of residents speak Spanish at home 629 60.1% Speak English very well417 39.9% Speak English less than very well1.3% of residents speak other language at home 24 100.0% Speak English very well
English speakers - Foreign-born 15.1% of residents of Casselberry speak English at home.
56.3% of residents speak Spanish at home 1,382 37.9% Speak English very well2,266 62.1% Speak English less than very well28.0% of residents speak other language at home 1,014 55.8% Speak English very well802 44.2% Speak English less than very well
White (Caucasian) - Speak only English Native:
94.7% (13,382)Foreign-born:
17.0% (250)
White (Caucasian) - Speak another language Native:
5.1% (725)Foreign-born:
84.5% (1,240)
Black or African American - Speak only English Native:
80.2% (1,252)Foreign-born:
29.9% (307)
Black or African American - Speak another language Native:
25.5% (398)Foreign-born:
79.6% (815)
American Indian / Alaska Native - Speak another language Native:
100.0% (56)Foreign-born:
100.0% (46)
Asian - Speak only English Native:
68.3% (371)Foreign-born:
29.1% (204)
Asian - Speak another language Native:
30.9% (168)Foreign-born:
67.7% (475)
Other race - Speak only English Native:
38.6% (688)Foreign-born:
6.3% (64)
Other race - Speak another language Native:
61.6% (1,099)Foreign-born:
100.0% (1,014)
Two or more races - Speak only English Native:
57.6% (1,645)Foreign-born:
7.9% (131)
Two or more races - Speak another language Native:
42.9% (1,225)Foreign-born:
90.4% (1,499)
White alone - Speak only English Native:
97.9% (12,576)Foreign-born:
29.2% (225)
White alone - Speak another language Native:
2.2% (286)Foreign-born:
71.5% (552)
Hispanic or Latino - Speak only English Native:
46.9% (2,453)Foreign-born:
5.8% (228)
Hispanic or Latino - Speak another language Native:
52.3% (2,734)Foreign-born:
93.6% (3,697)
Foreign-born residents in Casselberry 6,313 residents are foreign born (16.1% Latin America ).
This city:
21.4%Florida:
21.1%
Marital status for residents in Casselberry Marital status - White (Caucasian) population 15 years and over
Males 32.4% Never married44.9% Now married0.6% Separated3.8% Widowed18.3% DivorcedFemales 28.6% Never married42.8% Now married2.3% Separated9.3% Widowed17.0% DivorcedWomen who gave birth in the past 12 months Now married:
98.6% (184)Unmarried:
1.4% (3)
Women who did not give birth in the past 12 months Now married:
43.3% (1,617)Unmarried:
56.7% (2,120)
Marital status - Black or African American population 15 years and over
Males 32.5% Never married54.8% Now married0.0% Separated2.7% Widowed10.0% DivorcedFemales 49.0% Never married34.5% Now married0.0% Separated5.7% Widowed10.7% DivorcedWomen who gave birth in the past 12 months Now married:
51.9% (30)Unmarried:
48.1% (27)
Women who did not give birth in the past 12 months Now married:
32.3% (232)Unmarried:
67.7% (487)
Marital status - American Indian / Alaska Native population 15 years and over
Males 62.8% Never married37.2% Now married0.0% Separated0.0% Widowed0.0% DivorcedFemales 100.0% Never married0.0% Now married0.0% Separated0.0% Widowed0.0% DivorcedMarital status - Asian population 15 years and over
Males 45.8% Never married46.9% Now married0.0% Separated0.0% Widowed7.2% DivorcedFemales 22.7% Never married64.1% Now married1.4% Separated1.9% Widowed9.9% DivorcedWomen who gave birth in the past 12 months Now married:
100.0% (7)Unmarried:
0.0% (0)
Women who did not give birth in the past 12 months Now married:
57.0% (135)Unmarried:
43.0% (102)
Marital status - Other race population 15 years and over
Males 45.7% Never married27.8% Now married0.0% Separated0.3% Widowed26.2% DivorcedFemales 45.8% Never married35.3% Now married5.5% Separated9.1% Widowed4.3% DivorcedWomen who gave birth in the past 12 months Now married:
100.0% (83)Unmarried:
0.0% (0)
Women who did not give birth in the past 12 months Now married:
34.0% (209)Unmarried:
66.0% (406)
Marital status - Two or more races population 15 years and over
Males 45.3% Never married42.0% Now married0.0% Separated3.5% Widowed9.2% DivorcedFemales 20.3% Never married51.6% Now married4.4% Separated7.6% Widowed16.2% DivorcedWomen who gave birth in the past 12 months Now married:
100.0% (346)Unmarried:
0.0% (0)
Women who did not give birth in the past 12 months Now married:
35.2% (301)Unmarried:
64.8% (554)
Marital status - White alone, not Hispanic / Latino population 15 years and over
Males 32.2% Never married43.0% Now married0.6% Separated4.6% Widowed19.7% DivorcedFemales 28.2% Never married42.4% Now married2.4% Separated9.9% Widowed17.2% DivorcedWomen who gave birth in the past 12 months Now married:
97.2% (101)Unmarried:
2.8% (3)
Women who did not give birth in the past 12 months Now married:
45.1% (1,477)Unmarried:
54.9% (1,795)
Marital status - Hispanic or Latino population 15 years and over
Males 38.0% Never married43.4% Now married0.2% Separated0.9% Widowed17.5% DivorcedFemales 32.5% Never married43.4% Now married2.6% Separated8.1% Widowed13.3% DivorcedWomen who gave birth in the past 12 months Now married:
88.8% (213)Unmarried:
11.2% (27)
Women who did not give birth in the past 12 months Now married:
37.8% (756)Unmarried:
62.2% (1,241)
Ancestries in Casselberry
1,610 10.3% American948 6.1% Italian916 5.9% Haitian818 5.2% English669 4.3% German637 4.1% Irish326 2.1% Jamaican251 1.6% Polish155 1.0% British West Indian133 0.9% Scottish123 0.8% European120 0.8% Croatian118 0.8% Yugoslavian78 0.5% French75 0.5% French Canadian66 0.4% British63 0.4% Norwegian48 0.3% Scotch-Irish47 0.3% Hungarian33 0.2% Ukrainian30 0.2% Russian27 0.2% Austrian25 0.2% Egyptian24 0.2% Swiss23 0.1% Dutch23 0.1% West Indian22 0.1% Portuguese21 0.1% Brazilian21 0.1% Czech20 0.1% Moroccan20 0.1% Romanian20 0.1% Welsh13 0.08% Swedish13 0.08% Eastern European12 0.08% Macedonian11 0.07% African10 0.06% Bulgarian10 0.06% Northern European10 0.06% Scandinavian10 0.06% Greek9 0.06% Lithuanian
Geographical mobility in Casselberry Same house 1 year ago 14,094 85.0% White (Caucasian)2,219 81.6% Black or African American68 68.3% American Indian / Alaska Native1,259 98.5% Asian2,671 81.2% Other race4,346 86.1% Two or more races12,165 84.1% White alone, not Hispanic / Latino8,168 84.2% Hispanic or LatinoMoved within same county 1,188 7.2% White / Caucasian67 2.5% Black or African American185 5.6% Other race257 5.1% Two or more races1,204 8.3% White alone, not Hispanic / Latino591 6.1% Hispanic or LatinoMoved within same state 592 3.6% White / Caucasian398 14.6% Black or African American29 29.1% American Indian / Alaska Native8 0.7% Asian361 11.0% Other race442 8.7% Two or more races452 3.1% White alone, not Hispanic / Latino749 7.7% Hispanic or LatinoMoved from different state 627 3.8% White / Caucasian19 1.5% Asian8 0.3% Other race20 0.4% Two or more races572 4.0% White alone, not Hispanic / Latino83 0.9% Hispanic or LatinoMoved from abroad 69 0.4% White79 2.9% Black or African American23 0.7% Other race29 0.6% Two or more races75 0.8% Hispanic or Latino
Children Nativity (place of birth) in Casselberry
Children under 6 years - Living with two parents Both parents native 1,270 100.0% NativeBoth parents foreign-born 248 82.8% Native52 17.2% Foreign-bornOne native, one foreign-born parent 70 100.0% NativeChildren under 6 years - Living with one parent Native parent 523 100.0% NativeForeign-born parent 167 100.0% NativeChildren 6 to 17 years - Living with two parents Both parents native 1,201 100.0% NativeBoth parents foreign-born 371 62.4% Native224 37.6% Foreign-bornOne native, one foreign-born parent 332 96.5% Native12 3.5% Foreign-bornChildren 6 to 17 years - Living with one parent Native parent 630 100.0% NativeForeign-born parent 212 65.0% Native114 35.0% Foreign-born
Grandparents responsible for own grandchildren in Casselberry
Grandparents (30 to 59 years) White / Caucasian 8 10.3% Responsible for grandchildren72 89.7% Not responsible for grandchildrenBlack or African American 17 100.0% Not responsible for grandchildrenOther race 270 100.0% Responsible for grandchildrenTwo or more races 63 100.0% Not responsible for grandchildrenWhite alone, not Hispanic / Latino 10 100.0% Responsible for grandchildrenHispanic or Latino 211 59.9% Responsible for grandchildren142 40.1% Not responsible for grandchildrenGrandparents (60 years and over) White / Caucasian 64 40.3% Responsible for grandchildren95 59.7% Not responsible for grandchildrenOther race 35 100.0% Not responsible for grandchildrenWhite alone, not Hispanic / Latino 56 39.4% Responsible for grandchildren86 60.6% Not responsible for grandchildrenHispanic or Latino 19 28.4% Responsible for grandchildren48 71.6% Not responsible for grandchildren