Races in Carnegie, Pennsylvania (PA) Detailed Stats
Ancestries, Foreign-born residents, place of birth
Settings
X


Recent posts about races in Carnegie, Pennsylvania on our local forum with over 2,400,000 registered users:
 | Census 2020 results available by ethnicity for census tract. Interesting results for the Pittsburgh area. (4 replies) |
| Dating as an Asian man (27 replies) |
| Moving to Pittsburgh or Philly (36 replies) |
| City Population Breakdown by Neighborhood 2000-2010; Predictions for 2010-2020? (305 replies) |
| Pittsburgh MSA municipal population data (2020) (125 replies) |
| Carnegie Safety? (5 replies) |
Latest news about races in Carnegie, PA collected exclusively by city-data.com from local newspapers, TV, and radio stations
According to 2022 data, the most numerous races in Carnegie, PA are White alone (6,216 residents), Black alone (804 residents), and Hispanic (263 residents). 93.7% of Carnegie residents speak English at home. 4.4% of Carnegie, PA residents are foreign-born (2.5% born in Asia, 1.3% born in Europe), which is 59.3% less than the foreign-born rate of 7.0% across the entire state of Pennsylvania.
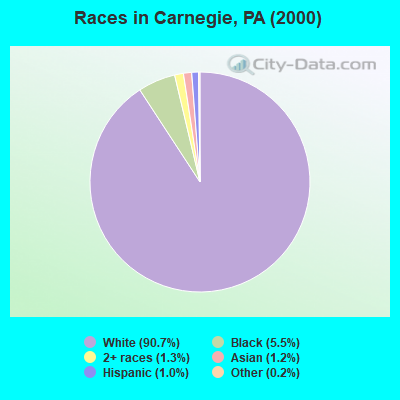
Race distribution in Carnegie
2000
2022

- 7,60590.7%White alone
- 4605.5%Black alone
- 1071.3%Two or more races
- 1031.2%Asian alone
- 831.0%Hispanic
- 200.2%Other race alone
- 70.08%American Indian alone
- 40.05%Native Hawaiian and Other
Pacific Islander alone
-
- 6,21677.8%White alone
- 80410.1%Black alone
- 5066.3%Two or more races
- 2633.3%Hispanic
- 1992.5%Asian alone
- 200.3%American Indian alone
- 90.1%Other race alone

2000
2022
-
- 10,322,45584.1%White alone
- 1,202,4379.8%Black alone
- 394,0883.2%Hispanic
- 218,2961.8%Asian alone
- 113,0970.9%Two or more races
- 13,0860.1%Other race alone
- 14,9040.1%American Indian alone
- 2,6910.02%Native Hawaiian and Other
Pacific Islander alone

-
- 9,487,22873.1%White alone
- 1,311,58110.1%Black alone
- 1,115,9978.6%Hispanic
- 493,9423.8%Two or more races
- 487,1243.8%Asian alone
- 63,5820.5%Other race alone
- 10,1300.08%American Indian alone
- 2,4240.02%Native Hawaiian and Other
Pacific Islander alone

Income and house value in Carnegie
- Median household income in 2022
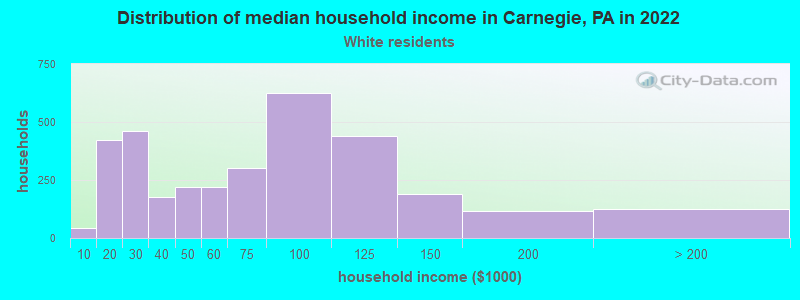
- $62,742White non-Hispanic householders
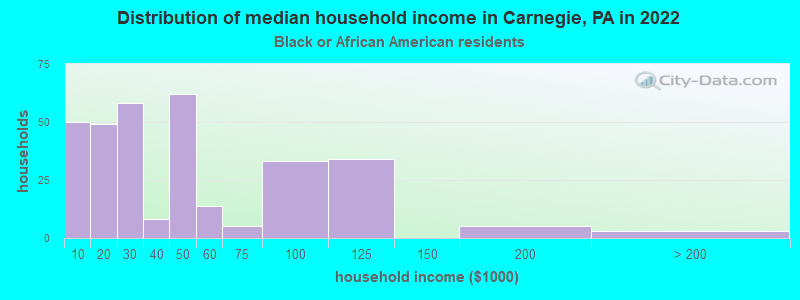
- $41,047Black householders
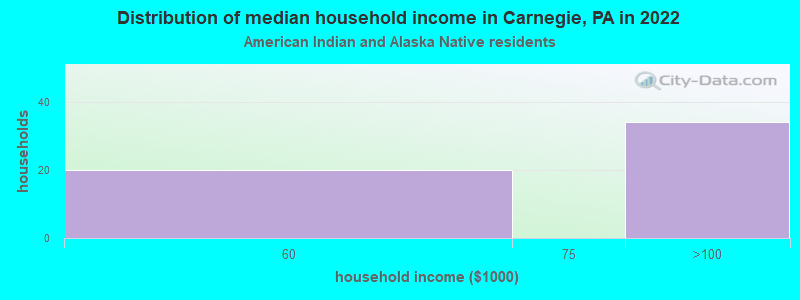
- $85,302American Indian and Alaska Native householders
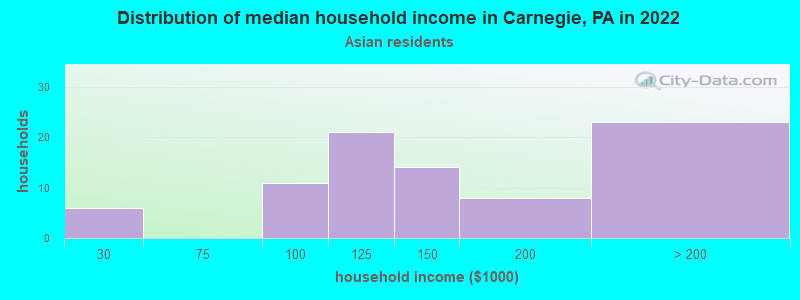
- $110,372Asian householders
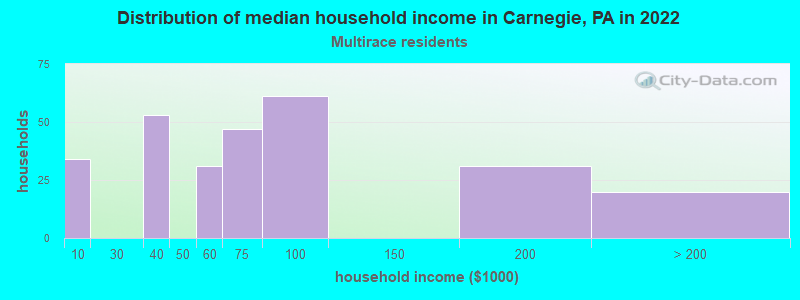
- $70,983Two or more races householders
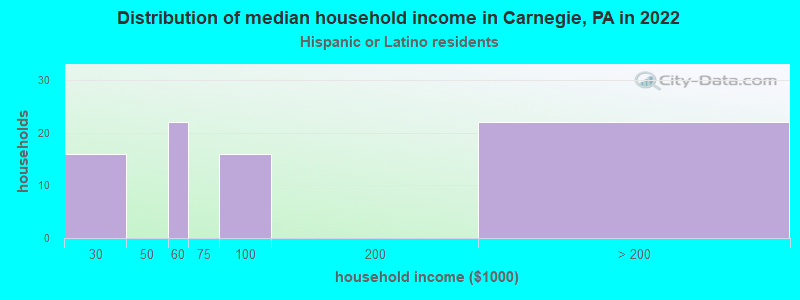
- $52,431Hispanic or Latino race householders
- Median 2022 house value
- $175,591White Non-Hispanic householders
- $145,316Black or African American householders
- $230,084Asian householders
Household income for White non-Hispanic householders
Household income for Black householders
Household income for American Indian and Alaska Native householders
Household income for Asian householders
Household income for Two or more races householders
Household income for Hispanic or Latino race householders
Median age by race in Carnegie
- 49.3Median age for White residents
- 40.3Males
- 55.4Females
- 31.2Median age for Black or African American residents
- 12.9Males
- 45.4Females
- 42.4Median age for American Indian / Alaska Native residents
- -714,583,332.6Males
- -577,519,379.3Females
- 32.3Median age for Asian residents
- 33.7Males
- 30.6Females
- -656,534,953.8Median age for Native Hawaiian / Pacific Islander residents
- -919,148,935.3Males
- -747,474,746.7Females
- 29.5Median age for Other race residents
- 29.1Males
- -681,623,930.9Females
- 16.0Median age for Two or more races residents
- 16.6Males
- 17.9Females
- 49.1Median age for White alone residents
- 39.8Males
- 55.4Females
- 25.7Median age for Hispanic or Latino residents
- 29.4Males
- 17.2Females
Owner/renter occupied households by race in Carnegie
- House owners and renters - White residents
- 2,05961.9%Owner occupied
- 1,26538.1%Renter occupied
- House owners and renters - Black or African American residents
- 329.7%Owner occupied
- 29790.3%Renter occupied
- House owners and renters - American Indian / Alaska Native residents
- 22.9%Owner occupied
- 7397.1%Renter occupied
- House owners and renters - Asian residents
- 3840.5%Owner occupied
- 5559.5%Renter occupied
- House owners and renters - Other race residents
- 10100.0%Renter occupied
- House owners and renters - Two or more races residents
- 17769.0%Owner occupied
- 7931.0%Renter occupied
- House owners and renters - White alone residents
- 2,05262.2%Owner occupied
- 1,24837.8%Renter occupied
- House owners and renters - Hispanic or Latino residents
- 4744.3%Owner occupied
- 5955.7%Renter occupied
Language usage in Carnegie
- English speakers - Total
- 93.7% of residents of Carnegie speak English at home.
- 1.1% of residents speak Spanish at home
- 7898.7%Speak English very well
- 11.3%Speak English less than very well
- 5.1% of residents speak other language at home
- 29979.3%Speak English very well
- 7820.7%Speak English less than very well
- English speakers - Born in the United States
- 93.3% of residents of Carnegie speak English at home.
- 2.3% of residents speak Spanish at home
- 35100.0%Speak English very well
- 3.5% of residents speak other language at home
- 54100.0%Speak English very well
- English speakers - Native, born elsewhere
- 71.0% of residents of Carnegie speak English at home.
- 20.3% of residents speak Spanish at home
- 1392.9%Speak English very well
- 17.1%Speak English less than very well
- English speakers - Foreign-born
- 17.9% of residents of Carnegie speak English at home.
- 6.7% of residents speak Spanish at home
- 21100.0%Speak English very well
- 72.8% of residents speak other language at home
- 17175.3%Speak English very well
- 5624.7%Speak English less than very well
White (Caucasian) - Speak only English
| Native: | 98.4% (5,754) |
| Foreign-born: | 33.5% (34) |
White (Caucasian) - Speak another language
| Native: | 1.6% (94) |
| Foreign-born: | 66.2% (67) |
Black or African American - Speak only English
| Native: | 95.7% (614) |
| Foreign-born: | 100.0% (9) |
Other race - Speak only English
| Native: | 97.2% (26) |
| Foreign-born: | 45.7% (0) |
Two or more races - Speak only English
| Native: | 87.1% (530) |
| Foreign-born: | 68.2% (10) |
White alone - Speak only English
| Native: | 98.3% (5,729) |
| Foreign-born: | 31.8% (35) |
White alone - Speak another language
| Native: | 1.7% (101) |
| Foreign-born: | 68.3% (75) |
Hispanic or Latino - Speak only English
| Native: | 68.5% (126) |
| Foreign-born: | 29.7% (10) |
Hispanic or Latino - Speak another language
| Native: | 30.6% (56) |
| Foreign-born: | 62.6% (20) |
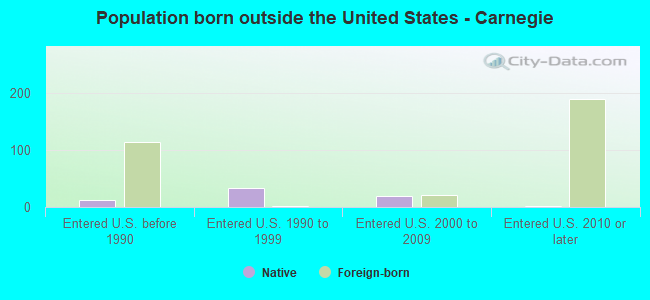
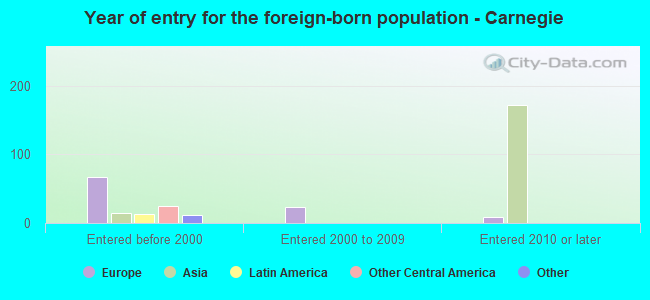
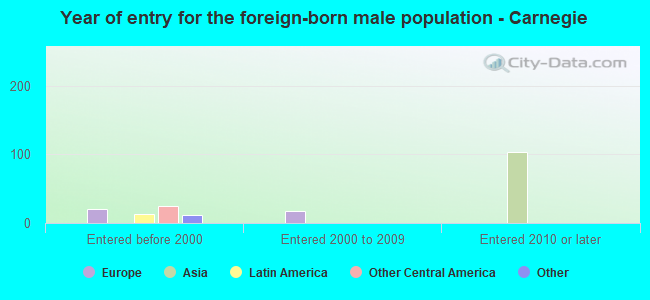
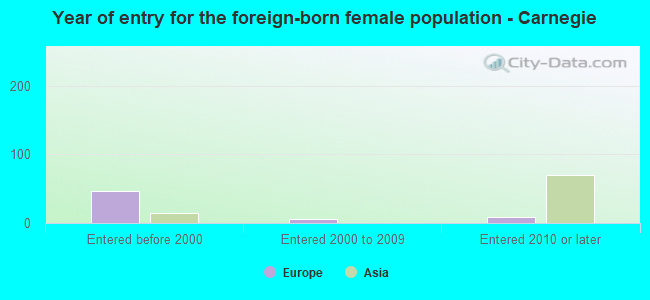
Foreign-born residents in Carnegie
351 residents are foreign born (2.5% Asia, 1.3% Europe).
| This city: | 4.4% |
| Pennsylvania: | 7.3% |

Marital status for residents in Carnegie
Marital status - White (Caucasian) population 15 years and over
- Males
- 41.7%Never married
- 43.0%Now married
- 0.4%Separated
- 4.3%Widowed
- 10.6%Divorced
- Females
- 30.4%Never married
- 39.9%Now married
- 0.5%Separated
- 13.0%Widowed
- 16.2%Divorced
Women who gave birth in the past 12 months
| Now married: | 92.0% (45) |
| Unmarried: | 8.0% (4) |
Women who did not give birth in the past 12 months
| Now married: | 42.7% (497) |
| Unmarried: | 57.3% (669) |
Marital status - Black or African American population 15 years and over
- Males
- 65.9%Never married
- 11.5%Now married
- 6.7%Separated
- 4.1%Widowed
- 11.9%Divorced
- Females
- 40.5%Never married
- 27.7%Now married
- 0.0%Separated
- 9.7%Widowed
- 22.1%Divorced
Women who did not give birth in the past 12 months
| Now married: | 42.8% (73) |
| Unmarried: | 57.2% (97) |
Marital status - American Indian / Alaska Native population 15 years and over
- Males
- 46.9%Never married
- 53.1%Now married
- 0.0%Separated
- 0.0%Widowed
- 0.0%Divorced
- Females
- 100.0%Never married
- 0.0%Now married
- 0.0%Separated
- 0.0%Widowed
- 0.0%Divorced
Women who did not give birth in the past 12 months
| Now married: | 0.0% (0) |
| Unmarried: | 100.0% (4) |
Marital status - Asian population 15 years and over
- Males
- 22.8%Never married
- 77.2%Now married
- 0.0%Separated
- 0.0%Widowed
- 0.0%Divorced
- Females
- 9.3%Never married
- 90.7%Now married
- 0.0%Separated
- 0.0%Widowed
- 0.0%Divorced
Women who did not give birth in the past 12 months
| Now married: | 100.0% (62) |
| Unmarried: | 0.0% (0) |
Marital status - Two or more races population 15 years and over
- Males
- 100.0%Never married
- 0.0%Now married
- 0.0%Separated
- 0.0%Widowed
- 0.0%Divorced
- Females
- 28.3%Never married
- 41.2%Now married
- 8.6%Separated
- 13.9%Widowed
- 8.0%Divorced
Women who did not give birth in the past 12 months
| Now married: | 51.4% (98) |
| Unmarried: | 48.6% (93) |
Marital status - White alone, not Hispanic / Latino population 15 years and over
- Males
- 41.2%Never married
- 43.3%Now married
- 0.4%Separated
- 4.4%Widowed
- 10.7%Divorced
- Females
- 30.3%Never married
- 39.9%Now married
- 0.5%Separated
- 13.0%Widowed
- 16.2%Divorced
Women who gave birth in the past 12 months
| Now married: | 92.0% (45) |
| Unmarried: | 8.0% (4) |
Women who did not give birth in the past 12 months
| Now married: | 42.7% (499) |
| Unmarried: | 57.3% (669) |
Marital status - Hispanic or Latino population 15 years and over
- Males
- 75.5%Never married
- 24.5%Now married
- 0.0%Separated
- 0.0%Widowed
- 0.0%Divorced
- Females
- 34.9%Never married
- 15.9%Now married
- 25.4%Separated
- 0.0%Widowed
- 23.8%Divorced
Women who did not give birth in the past 12 months
| Now married: | 21.3% (11) |
| Unmarried: | 78.7% (39) |
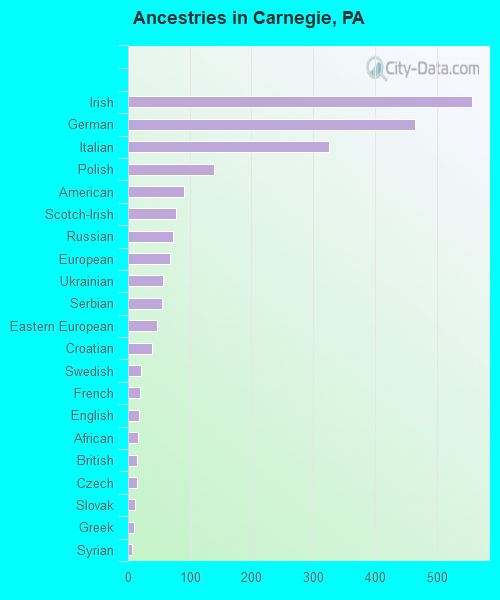
Ancestries in Carnegie

- 55718.0%Irish
- 46515.0%German
- 32510.5%Italian
- 1394.5%Polish
- 912.9%American
- 782.5%Scotch-Irish
- 732.4%Russian
- 682.2%European
- 561.8%Ukrainian
- 551.8%Serbian
- 471.5%Eastern European
- 391.3%Croatian
- 210.7%Swedish
- 190.6%French
- 180.6%English
- 160.5%African
- 150.5%British
- 150.5%Czech
- 120.4%Slovak
- 90.3%Greek
- 60.2%Syrian
- 50.2%Czechoslovakian
- 30.10%Scandinavian
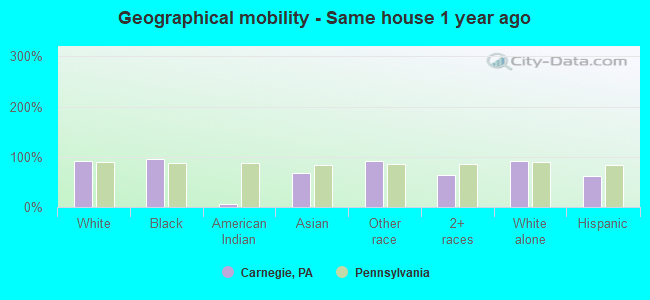
Geographical mobility in Carnegie

- Same house 1 year ago
- 5,64191.0%White (Caucasian)
- 76495.3%Black or African American
- 35.9%American Indian / Alaska Native
- 13567.3%Asian
- 2391.6%Other race
- 47663.0%Two or more races
- 5,65891.3%White alone, not Hispanic / Latino
- 16462.5%Hispanic or Latino
-
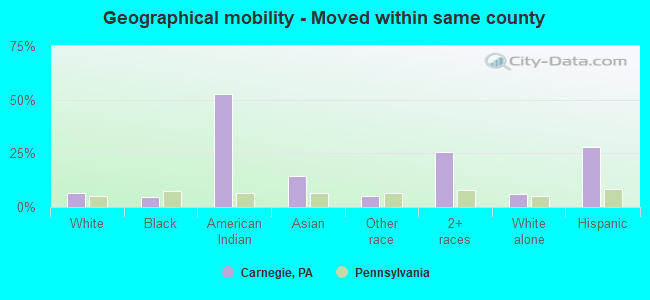
- Moved within same county
- 4046.5%White / Caucasian
- 394.9%Black or African American
- 3052.5%American Indian / Alaska Native
- 2914.6%Asian
- 14.9%Other race
- 19425.7%Two or more races
- 3886.3%White alone, not Hispanic / Latino
- 7327.8%Hispanic or Latino
-
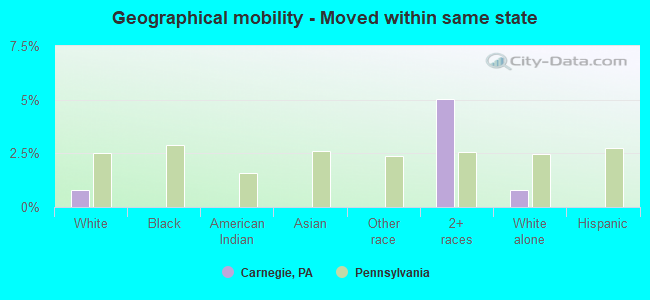
- Moved within same state
- 480.8%White / Caucasian
- 385.0%Two or more races
- 490.8%White alone, not Hispanic / Latino
-
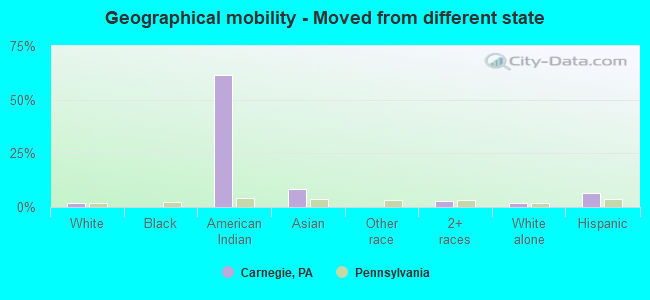
- Moved from different state
- 1051.7%White / Caucasian
- 3561.3%American Indian / Alaska Native
- 178.6%Asian
- 202.6%Two or more races
- 1061.7%White alone, not Hispanic / Latino
- 186.7%Hispanic or Latino
-
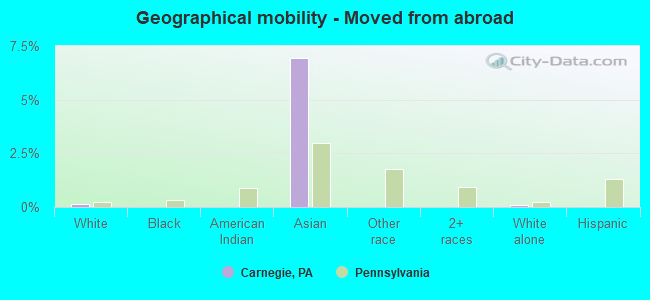
- Moved from abroad
- 70.1%White
- 146.9%Asian
- 60.1%White alone, not Hispanic / Latino
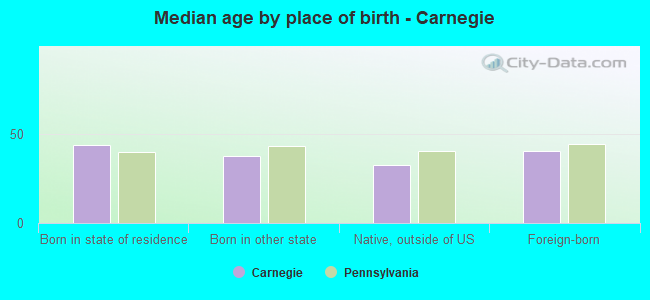
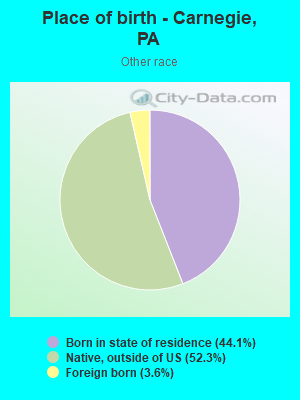
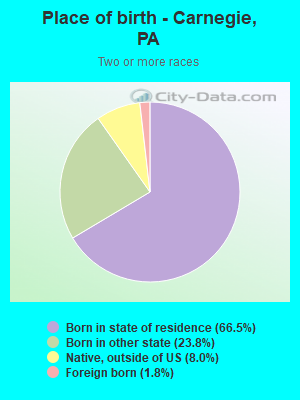
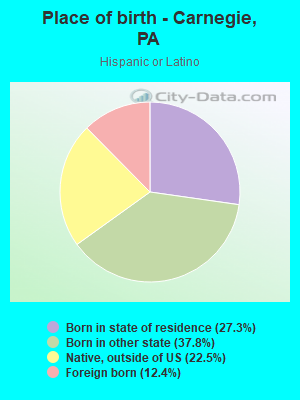
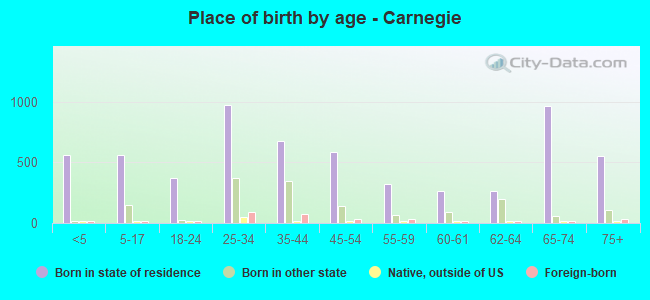
Children Nativity (place of birth) in Carnegie
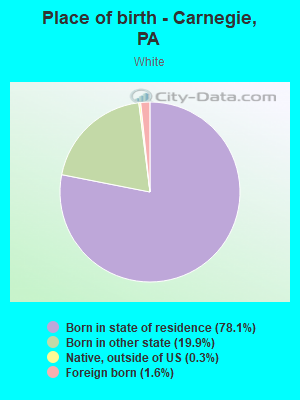
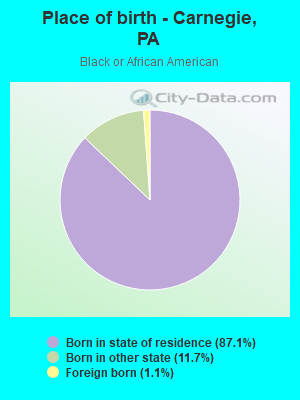
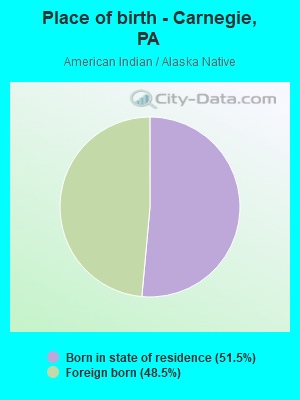
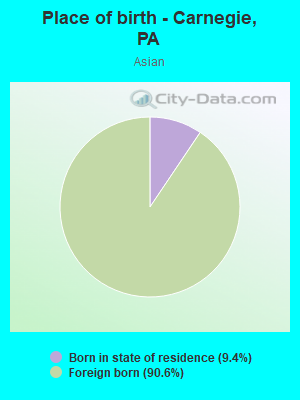
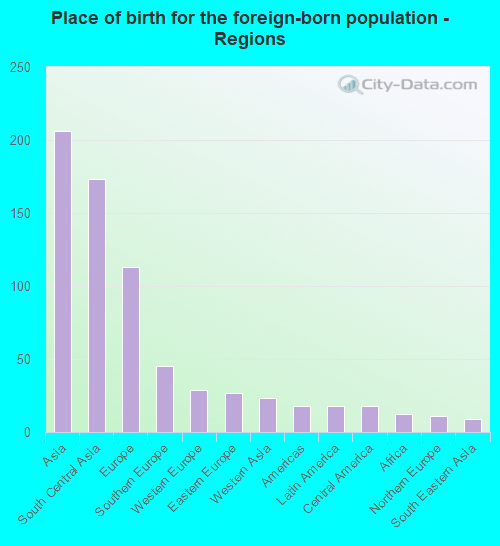
Place of birth for residents in Carnegie
![Place of birth for the foreign-born population - Regions]()
- 206Asia
- 173South Central Asia
- 113Europe
- 45Southern Europe
- 29Western Europe
- 27Eastern Europe
- 23Western Asia
- 18Americas
- 18Latin America
- 18Central America
- 12Africa
- 11Northern Europe
- 9South Eastern Asia
- 1Eastern Africa
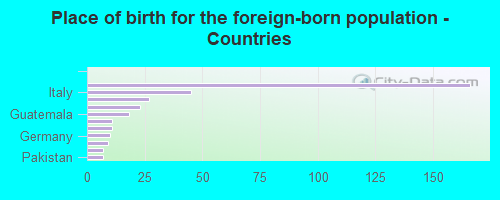
![Place of birth for the foreign-born population - Countries]()
- 166India
- 45Italy
- 27Ukraine
- 23Syria
- 18Guatemala
- 11England
- 11France
- 10Germany
- 9Thailand
- 7Switzerland
- 7Pakistan
- 1Tanzania
Grandparents responsible for own grandchildren in Carnegie
Zip codes: 15106.