Races in Carbondale, Illinois (IL) Detailed Stats
Data:
Races - White alone (%)
Races - White alone (% change since 2000)
Races - Black alone (%)
Races - Black alone (% change since 2000)
Races - American Indian alone (%)
Races - American Indian alone (% change since 2000)
Races - Asian alone (%)
Races - Asian alone (% change since 2000)
Races - Hispanic (%)
Races - Hispanic (% change since 2000)
Races - Native Hawaiian and Other Pacific Islander alone (%)
Races - Native Hawaiian and Other Pacific Islander alone (% change since 2000)
Races - Two or more races(%)
Races - Two or more races(% change since 2000)
Races - Other race alone (%)
Races - Other race alone (% change since 2000)
Racial diversity
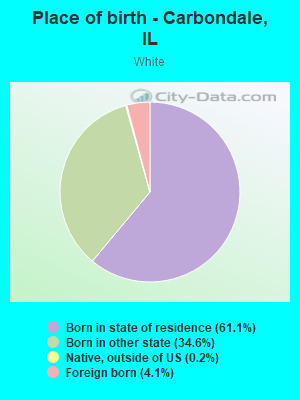
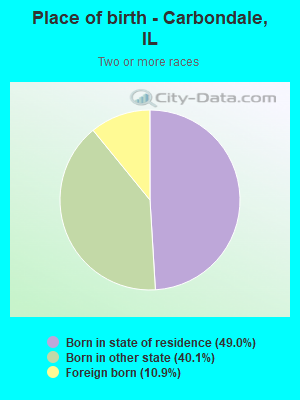
Place of birth - Born in state of residence (%)
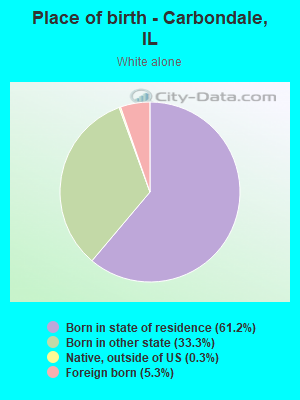
Place of birth - Born in state of residence (%) - White
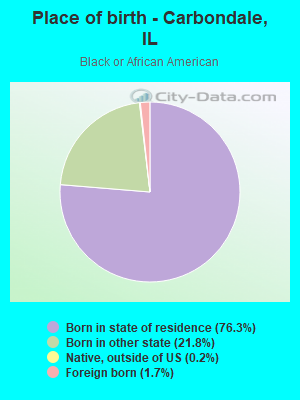
Place of birth - Born in state of residence (%) - Black or African American
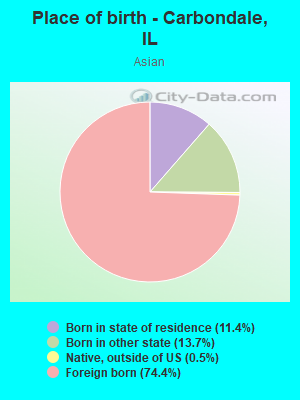
Place of birth - Born in state of residence (%) - Asian
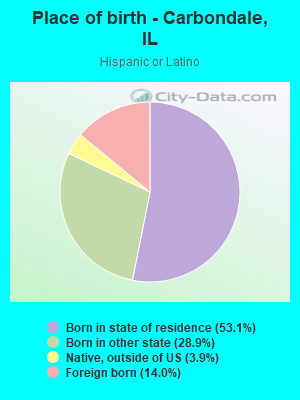
Place of birth - Born in state of residence (%) - Hispanic or Latino
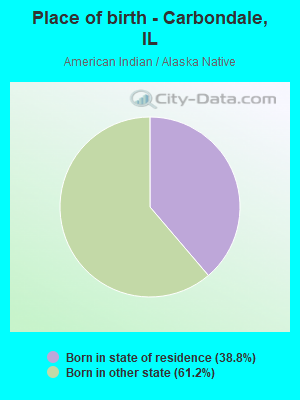
Place of birth - Born in state of residence (%) - American Indian and Alaska Native
Place of birth - Born in state of residence (%) - Multirace
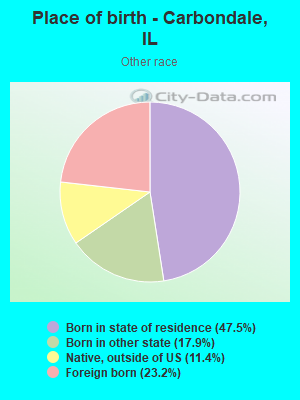
Place of birth - Born in state of residence (%) - Other Race
Place of birth - Born in other state (%)
Place of birth - Born in other state (%) - White
Place of birth - Born in other state (%) - Black or African American
Place of birth - Born in other state (%) - Asian
Place of birth - Born in other state (%) - Hispanic or Latino
Place of birth - Born in other state (%) - American Indian and Alaska Native
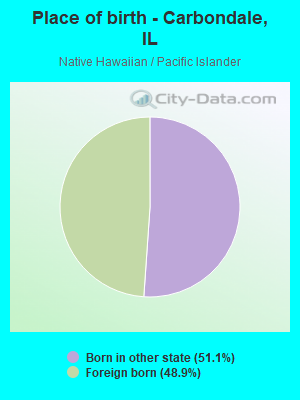
Place of birth - Born in other state (%) - Multirace
Place of birth - Born in other state (%) - Other Race
Place of birth - Native, outside of US (%)
Place of birth - Native, outside of US (%) - White
Place of birth - Native, outside of US (%) - Black or African American
Place of birth - Native, outside of US (%) - Asian
Place of birth - Native, outside of US (%) - Hispanic or Latino
Place of birth - Native, outside of US (%) - American Indian and Alaska Native
Place of birth - Native, outside of US (%) - Multirace
Place of birth - Native, outside of US (%) - Other Race
Place of birth - Foreign born (%)
Place of birth - Foreign born (%) - White
Place of birth - Foreign born (%) - Black or African American
Place of birth - Foreign born (%) - Asian
Place of birth - Foreign born (%) - Hispanic or Latino
Place of birth - Foreign born (%) - American Indian and Alaska Native
Place of birth - Foreign born (%) - Multirace
Place of birth - Foreign born (%) - Other Race
Residents speaking English at home (%)
Residents speaking English at home - Born in the United States (%)
Residents speaking English at home - Native, born elsewhere (%)
Residents speaking English at home - Foreign born (%)
Residents speaking Spanish at home (%)
Residents speaking Spanish at home - Born in the United States (%)
Residents speaking Spanish at home - Native, born elsewhere (%)
Residents speaking Spanish at home - Foreign born (%)
Residents speaking other language at home (%)
Residents speaking other language at home - Born in the United States (%)
Residents speaking other language at home - Native, born elsewhere (%)
Residents speaking other language at home - Foreign born (%)
Marital status - Never married (%)
Marital status - Now married (%)
Marital status - Separated (%)
Marital status - Widowed (%)
Marital status - Divorced (%)
Ancestries Reported - Arab (%)
Ancestries Reported - Czech (%)
Ancestries Reported - Danish (%)
Ancestries Reported - Dutch (%)
Ancestries Reported - English (%)
Ancestries Reported - French (%)
Ancestries Reported - French Canadian (%)
Ancestries Reported - German (%)
Ancestries Reported - Greek (%)
Ancestries Reported - Hungarian (%)
Ancestries Reported - Irish (%)
Ancestries Reported - Italian (%)
Ancestries Reported - Lithuanian (%)
Ancestries Reported - Norwegian (%)
Ancestries Reported - Polish (%)
Ancestries Reported - Portuguese (%)
Ancestries Reported - Russian (%)
Ancestries Reported - Scotch-Irish (%)
Ancestries Reported - Scottish (%)
Ancestries Reported - Slovak (%)
Ancestries Reported - Subsaharan African (%)
Ancestries Reported - Swedish (%)
Ancestries Reported - Swiss (%)
Ancestries Reported - Ukrainian (%)
Ancestries Reported - United States (%)
Ancestries Reported - Welsh (%)
Ancestries Reported - West Indian (%)
Ancestries Reported - Other (%)
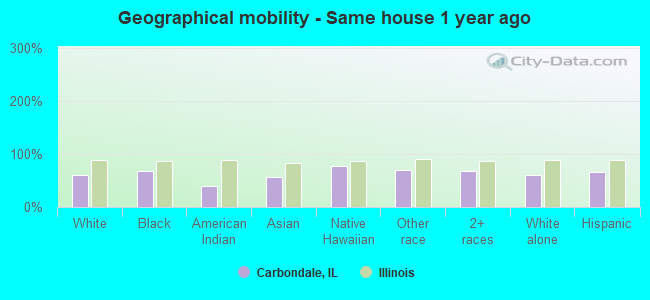
Geographical mobility - Same house 1 year ago (%)
Geographical mobility - Same house 1 year ago (%) - White
Geographical mobility - Same house 1 year ago (%) - Black or African American
Geographical mobility - Same house 1 year ago (%) - Asian
Geographical mobility - Same house 1 year ago (%) - Hispanic or Latino
Geographical mobility - Same house 1 year ago (%) - American Indian and Alaska Native
Geographical mobility - Same house 1 year ago (%) - Multirace
Geographical mobility - Same house 1 year ago (%) - Other Race
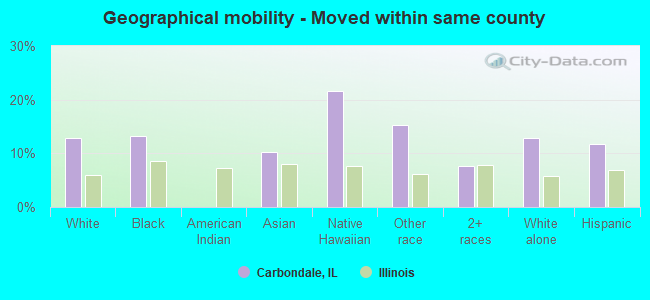
Geographical mobility - Moved within same county (%)
Geographical mobility - Moved within same county (%) - White
Geographical mobility - Moved within same county (%) - Black or African American
Geographical mobility - Moved within same county (%) - Asian
Geographical mobility - Moved within same county (%) - Hispanic or Latino
Geographical mobility - Moved within same county (%) - American Indian and Alaska Native
Geographical mobility - Moved within same county (%) - Multirace
Geographical mobility - Moved within same county (%) - Other Race
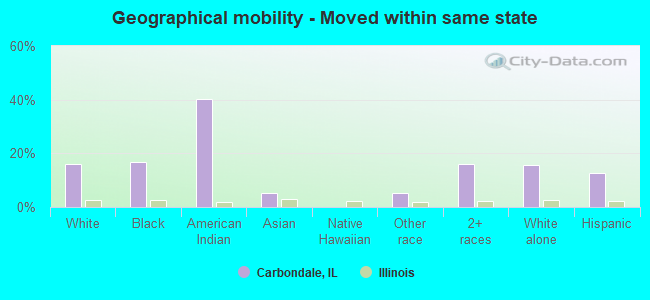
Geographical mobility - Moved from different county within same state (%)
Geographical mobility - Moved from different county within same state (%) - White
Geographical mobility - Moved from different county within same state (%) - Black or African American
Geographical mobility - Moved from different county within same state (%) - Asian
Geographical mobility - Moved from different county within same state (%) - Hispanic or Latino
Geographical mobility - Moved from different county within same state (%) - American Indian and Alaska Native
Geographical mobility - Moved from different county within same state (%) - Multirace
Geographical mobility - Moved from different county within same state (%) - Other Race
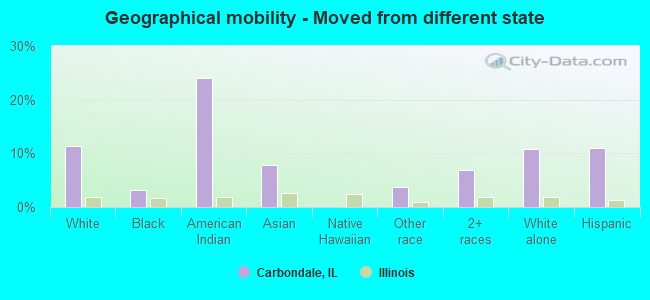
Geographical mobility - Moved from different state (%)
Geographical mobility - Moved from different state (%) - White
Geographical mobility - Moved from different state (%) - Black or African American
Geographical mobility - Moved from different state (%) - Asian
Geographical mobility - Moved from different state (%) - Hispanic or Latino
Geographical mobility - Moved from different state (%) - American Indian and Alaska Native
Geographical mobility - Moved from different state (%) - Multirace
Geographical mobility - Moved from different state (%) - Other Race
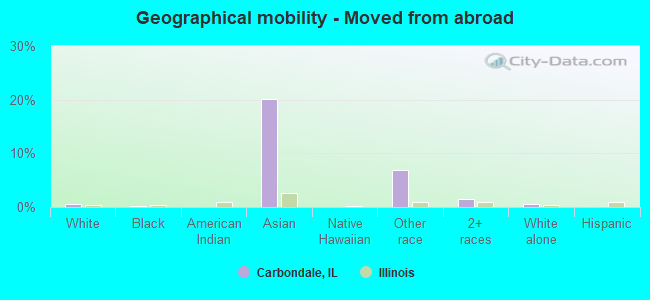
Geographical mobility - Moved from abroad (%)
Geographical mobility - Moved from abroad (%) - White
Geographical mobility - Moved from abroad (%) - Black or African American
Geographical mobility - Moved from abroad (%) - Asian
Geographical mobility - Moved from abroad (%) - Hispanic or Latino
Geographical mobility - Moved from abroad (%) - American Indian and Alaska Native
Geographical mobility - Moved from abroad (%) - Multirace
Geographical mobility - Moved from abroad (%) - Other Race
Place of birth for the foreign-born population - Ireland (%)
Place of birth for the foreign-born population - Denmark (%)
Place of birth for the foreign-born population - Norway (%)
Place of birth for the foreign-born population - Sweden (%)
Place of birth for the foreign-born population - United Kingdom (%)
Place of birth for the foreign-born population - England (%)
Place of birth for the foreign-born population - Scotland (%)
Place of birth for the foreign-born population - Other Northern Europe (%)
Place of birth for the foreign-born population - Austria (%)
Place of birth for the foreign-born population - Belgium (%)
Place of birth for the foreign-born population - France (%)
Place of birth for the foreign-born population - Germany (%)
Place of birth for the foreign-born population - Netherlands (%)
Place of birth for the foreign-born population - Switzerland (%)
Place of birth for the foreign-born population - Other Western Europe (%)
Place of birth for the foreign-born population - Greece (%)
Place of birth for the foreign-born population - Italy (%)
Place of birth for the foreign-born population - Portugal (%)
Place of birth for the foreign-born population - Spain (%)
Place of birth for the foreign-born population - Other Southern Europe (%)
Place of birth for the foreign-born population - Albania (%)
Place of birth for the foreign-born population - Belarus (%)
Place of birth for the foreign-born population - Bosnia and Herzegovina (%)
Place of birth for the foreign-born population - Bulgaria (%)
Place of birth for the foreign-born population - Croatia (%)
Place of birth for the foreign-born population - Czechoslovakia (%)
Place of birth for the foreign-born population - Hungary (%)
Place of birth for the foreign-born population - Latvia (%)
Place of birth for the foreign-born population - Lithuania (%)
Place of birth for the foreign-born population - North Macedonia (Macedonia) (%)
Place of birth for the foreign-born population - Moldova (%)
Place of birth for the foreign-born population - Poland (%)
Place of birth for the foreign-born population - Romania (%)
Place of birth for the foreign-born population - Russia (%)
Place of birth for the foreign-born population - Serbia (%)
Place of birth for the foreign-born population - Ukraine (%)
Place of birth for the foreign-born population - Other Eastern Europe (%)
Place of birth for the foreign-born population - China (%)
Place of birth for the foreign-born population - Hong Kong (%)
Place of birth for the foreign-born population - Taiwan (%)
Place of birth for the foreign-born population - Japan (%)
Place of birth for the foreign-born population - Korea (%)
Place of birth for the foreign-born population - Other Eastern Asia (%)
Place of birth for the foreign-born population - Afghanistan (%)
Place of birth for the foreign-born population - Bangladesh (%)
Place of birth for the foreign-born population - India (%)
Place of birth for the foreign-born population - Iran (%)
Place of birth for the foreign-born population - Kazakhstan (%)
Place of birth for the foreign-born population - Nepal (%)
Place of birth for the foreign-born population - Pakistan (%)
Place of birth for the foreign-born population - Sri Lanka (%)
Place of birth for the foreign-born population - Uzbekistan (%)
Place of birth for the foreign-born population - Other South Central Asia (%)
Place of birth for the foreign-born population - Burma (%)
Place of birth for the foreign-born population - Cambodia (%)
Place of birth for the foreign-born population - Indonesia (%)
Place of birth for the foreign-born population - Laos (%)
Place of birth for the foreign-born population - Malaysia (%)
Place of birth for the foreign-born population - Philippines (%)
Place of birth for the foreign-born population - Singapore (%)
Place of birth for the foreign-born population - Thailand (%)
Place of birth for the foreign-born population - Vietnam (%)
Place of birth for the foreign-born population - Other South Eastern Asia (%)
Place of birth for the foreign-born population - Armenia (%)
Place of birth for the foreign-born population - Iraq (%)
Place of birth for the foreign-born population - Israel (%)
Place of birth for the foreign-born population - Jordan (%)
Place of birth for the foreign-born population - Kuwait (%)
Place of birth for the foreign-born population - Lebanon (%)
Place of birth for the foreign-born population - Saudi Arabia (%)
Place of birth for the foreign-born population - Syria (%)
Place of birth for the foreign-born population - Turkey (%)
Place of birth for the foreign-born population - Yemen (%)
Place of birth for the foreign-born population - Other Western Asia (%)
Place of birth for the foreign-born population - Eritrea (%)
Place of birth for the foreign-born population - Ethiopia (%)
Place of birth for the foreign-born population - Kenya (%)
Place of birth for the foreign-born population - Somalia (%)
Place of birth for the foreign-born population - Uganda (%)
Place of birth for the foreign-born population - Zimbabwe (%)
Place of birth for the foreign-born population - Other Eastern Africa (%)
Place of birth for the foreign-born population - Cameroon (%)
Place of birth for the foreign-born population - Congo (%)
Place of birth for the foreign-born population - Democratic Republic of Congo (Zaire) (%)
Place of birth for the foreign-born population - Other Middle Africa (%)
Place of birth for the foreign-born population - Egypt (%)
Place of birth for the foreign-born population - Morocco (%)
Place of birth for the foreign-born population - Sudan (%)
Place of birth for the foreign-born population - Other Northern Africa (%)
Place of birth for the foreign-born population - South Africa (%)
Place of birth for the foreign-born population - Other Southern Africa (%)
Place of birth for the foreign-born population - Cabo Verde (%)
Place of birth for the foreign-born population - Ghana (%)
Place of birth for the foreign-born population - Liberia (%)
Place of birth for the foreign-born population - Nigeria (%)
Place of birth for the foreign-born population - Senegal (%)
Place of birth for the foreign-born population - Sierra Leone (%)
Place of birth for the foreign-born population - Other Western Africa (%)
Place of birth for the foreign-born population - Australia (%)
Place of birth for the foreign-born population - New Zealand (%)
Place of birth for the foreign-born population - Fiji (%)
Place of birth for the foreign-born population - Micronesia (%)
Place of birth for the foreign-born population - Bahamas (%)
Place of birth for the foreign-born population - Barbados (%)
Place of birth for the foreign-born population - Cuba (%)
Place of birth for the foreign-born population - Dominica (%)
Place of birth for the foreign-born population - Dominican Republic (%)
Place of birth for the foreign-born population - Grenada (%)
Place of birth for the foreign-born population - Haiti (%)
Place of birth for the foreign-born population - Jamaica (%)
Place of birth for the foreign-born population - St. Vincent and the Grenadines (%)
Place of birth for the foreign-born population - Trinidad and Tobago (%)
Place of birth for the foreign-born population - West Indies (%)
Place of birth for the foreign-born population - Other Caribbean (%)
Place of birth for the foreign-born population - Belize (%)
Place of birth for the foreign-born population - Costa Rica (%)
Place of birth for the foreign-born population - El Salvador (%)
Place of birth for the foreign-born population - Guatemala (%)
Place of birth for the foreign-born population - Honduras (%)
Place of birth for the foreign-born population - Mexico (%)
Place of birth for the foreign-born population - Nicaragua (%)
Place of birth for the foreign-born population - Panama (%)
Place of birth for the foreign-born population - Other Central America (%)
Place of birth for the foreign-born population - Argentina (%)
Place of birth for the foreign-born population - Bolivia (%)
Place of birth for the foreign-born population - Brazil (%)
Place of birth for the foreign-born population - Chile (%)
Place of birth for the foreign-born population - Colombia (%)
Place of birth for the foreign-born population - Ecuador (%)
Place of birth for the foreign-born population - Guyana (%)
Place of birth for the foreign-born population - Peru (%)
Place of birth for the foreign-born population - Uruguay (%)
Place of birth for the foreign-born population - Venezuela (%)
Place of birth for the foreign-born population - Other South America (%)
Place of birth for the foreign-born population - Canada (%)
Place of birth for the foreign-born population - Other Northern America (%)
Place of birth for the foreign-born population - Other (%)
Latest news about races in Carbondale, IL collected exclusively by city-data.com from local newspapers, TV, and radio stations
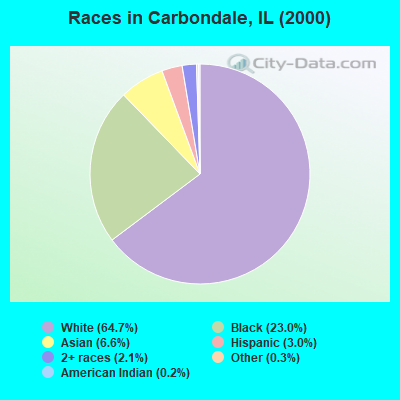
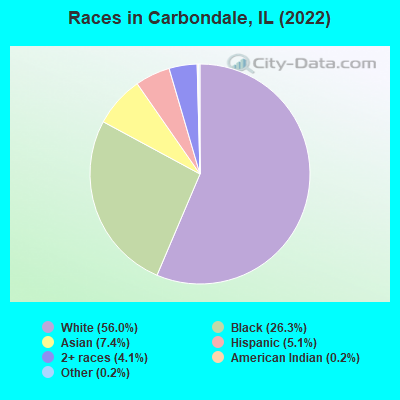
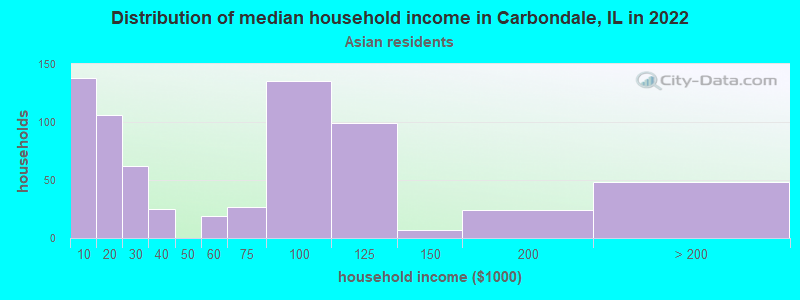
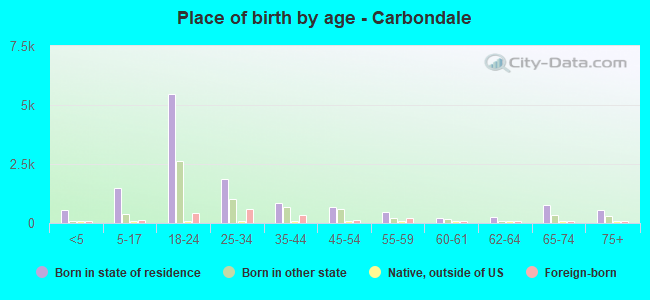
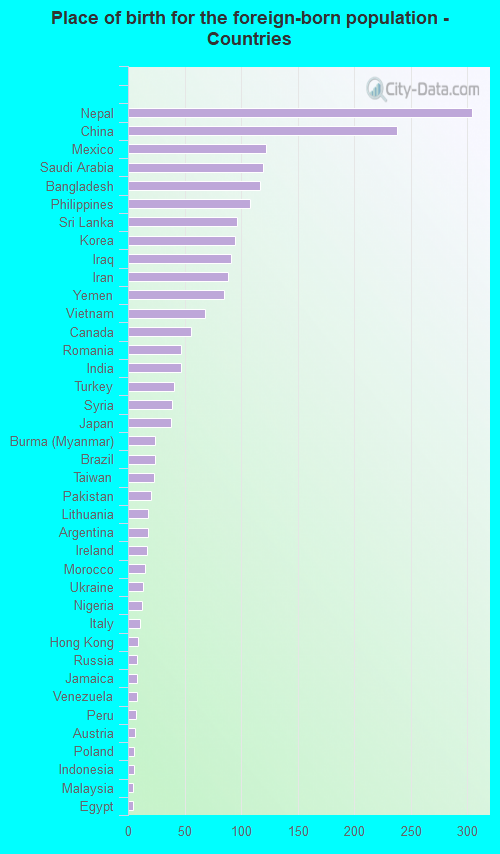
According to 2022 data, the most numerous races in Carbondale, IL are White alone (12,166 residents), Hispanic (1,111 residents), and Black alone (5,723 residents). 86.6% of Carbondale residents speak English at home. 10.0% of Carbondale, IL residents are foreign-born (7.6% born in Asia), which is 39.6% less than the foreign-born rate of 14.0% across the entire state of Illinois.
Race distribution in Carbondale
2000 2022
8,424,140 67.8% White alone 1,856,152 14.9% Black alone 1,530,262 12.3% Hispanic 419,916 3.4% Asian alone 153,996 1.2% Two or more races 13,479 0.1% Other race alone 18,232 0.1% American Indian alone 3,116 0.03% Native Hawaiian and Other
7,356,301 58.5% White alone 2,299,726 18.3% Hispanic 1,660,423 13.2% Black alone 747,296 5.9% Asian alone 458,599 3.6% Two or more races 45,386 0.4% Other race alone 10,405 0.08% American Indian alone 3,896 0.03% Native Hawaiian and Other
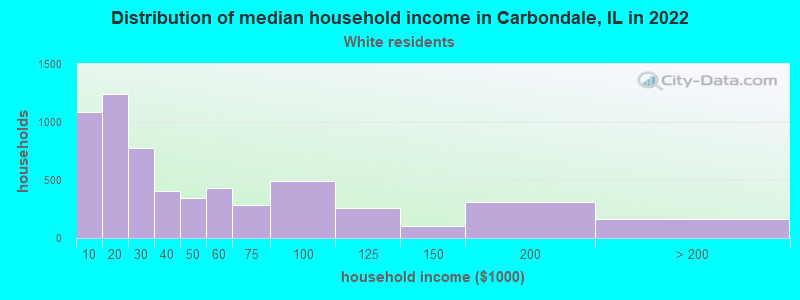
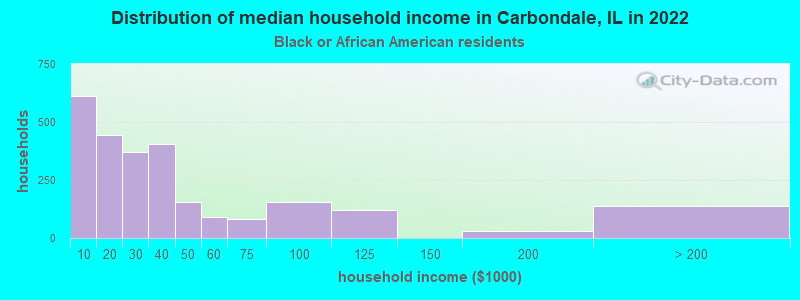
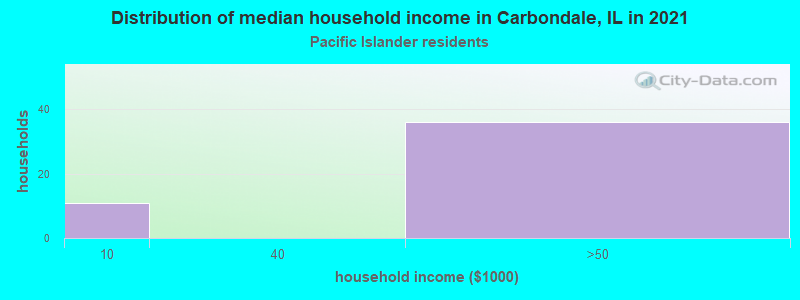
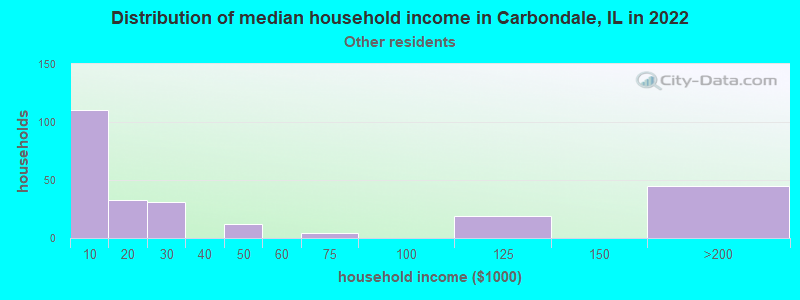
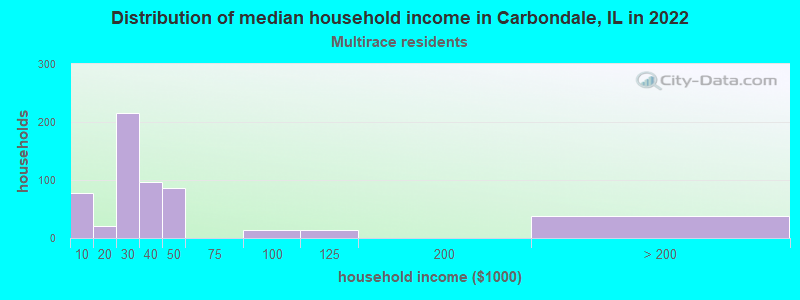
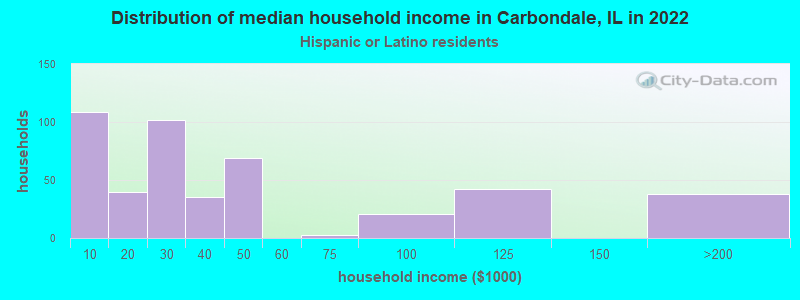
Income and house value in Carbondale Median household income in 2022 $26,197 White non-Hispanic householders$27,416 Black householders$25,680 Two or more races householders$26,284 Hispanic or Latino race householdersMedian 2022 house value $141,366 White Non-Hispanic householders$121,680 Black or African American householders$84,369 American Indian or Alaska Native householders $148,491 Asian householders$189,363 Some other race householders$103,118 Two or more races householders$141,741 Hispanic or Latino householders
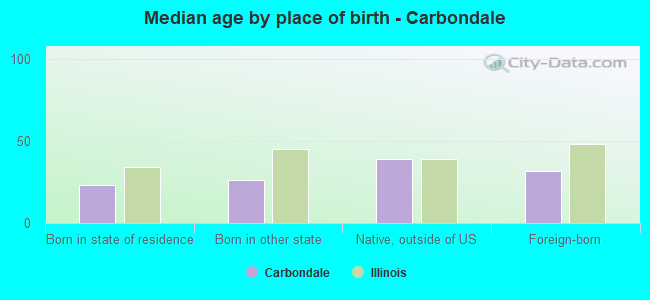
Median age by race in Carbondale
25.7 Median age for White residents24.9 29.8 24.5 Median age for Black or African American residents22.8 25.3 64.4 Median age for American Indian / Alaska Native residents-720,238,094.5 -688,956,432.9 28.5 Median age for Asian residents26.6 30.0 19.5 Median age for Native Hawaiian / Pacific Islander residents-658,536,584.7 47.7 24.0 Median age for Other race residents36.9 23.3 24.5 Median age for Two or more races residents24.7 24.1 25.2 Median age for White alone residents24.5 29.9 22.7 Median age for Hispanic or Latino residents24.1 22.5
Owner/renter occupied households by race in Carbondale
House owners and renters - White residents 1,792 31.3% Owner occupied3,941 68.7% Renter occupiedHouse owners and renters - Black or African American residents 477 18.3% Owner occupied2,125 81.7% Renter occupiedHouse owners and renters - American Indian / Alaska Native residents 27 100.0% Renter occupiedHouse owners and renters - Asian residents 94 14.5% Owner occupied551 85.5% Renter occupiedHouse owners and renters - Native Hawaiian / Pacific Islander residents 27 72.7% Owner occupied10 27.3% Renter occupiedHouse owners and renters - Other race residents 33 12.6% Owner occupied230 87.4% Renter occupiedHouse owners and renters - Two or more races residents 160 29.4% Owner occupied384 70.6% Renter occupiedHouse owners and renters - White alone residents 1,832 30.9% Owner occupied4,096 69.1% Renter occupiedHouse owners and renters - Hispanic or Latino residents 106 23.2% Owner occupied349 76.8% Renter occupied
Language usage in Carbondale
English speakers - Total 86.6% of residents of Carbondale speak English at home.
3.8% of residents speak Spanish at home 551 69.0% Speak English very well247 31.0% Speak English less than very well9.5% of residents speak other language at home 1,362 68.0% Speak English very well642 32.0% Speak English less than very well
English speakers - Born in the United States 94.9% of residents of Carbondale speak English at home.
2.2% of residents speak Spanish at home 132 95.0% Speak English very well7 5.0% Speak English less than very well2.8% of residents speak other language at home 176 100.0% Speak English very well
English speakers - Native, born elsewhere 47.4% of residents of Carbondale speak English at home.
46.3% of residents speak Spanish at home 44 100.0% Speak English very well6.3% of residents speak other language at home 6 100.0% Speak English very well
English speakers - Foreign-born 17.6% of residents of Carbondale speak English at home.
7.6% of residents speak Spanish at home 56 33.9% Speak English very well109 66.1% Speak English less than very well74.2% of residents speak other language at home 1,001 61.8% Speak English very well618 38.2% Speak English less than very well
White (Caucasian) - Speak only English Native:
98.7% (10,980)Foreign-born:
32.1% (159)
White (Caucasian) - Speak another language Native:
2.4% (272)Foreign-born:
69.6% (344)
Black or African American - Speak only English Native:
98.5% (5,425)Foreign-born:
53.7% (53)
Black or African American - Speak another language Native:
1.6% (86)Foreign-born:
49.3% (49)
Asian - Speak only English Native:
71.8% (302)Foreign-born:
11.4% (135)
Asian - Speak another language Native:
27.7% (117)Foreign-born:
88.6% (1,056)
Native Hawaiian / Pacific Islander - Speak another language Native:
41.2% (19)Foreign-born:
100.0% (51)
Other race - Speak another language Native:
72.9% (258)Foreign-born:
99.9% (109)
Two or more races - Speak only English Native:
80.1% (970)Foreign-born:
11.3% (18)
Two or more races - Speak another language Native:
18.8% (228)Foreign-born:
88.5% (145)
White alone - Speak only English Native:
96.8% (10,890)Foreign-born:
26.7% (172)
White alone - Speak another language Native:
3.2% (355)Foreign-born:
72.6% (469)
Hispanic or Latino - Speak only English Native:
55.2% (523)Foreign-born:
1.3% (2)
Hispanic or Latino - Speak another language Native:
45.6% (433)Foreign-born:
98.9% (155)
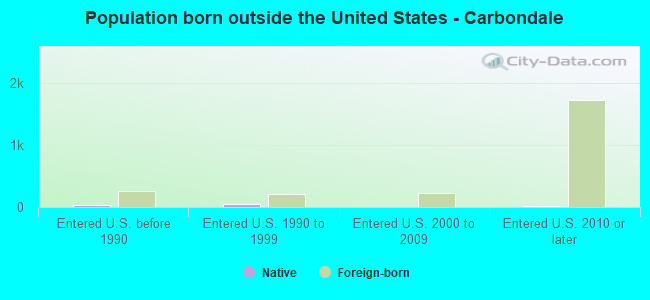
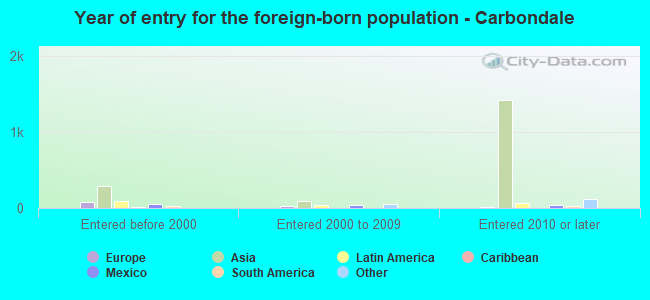
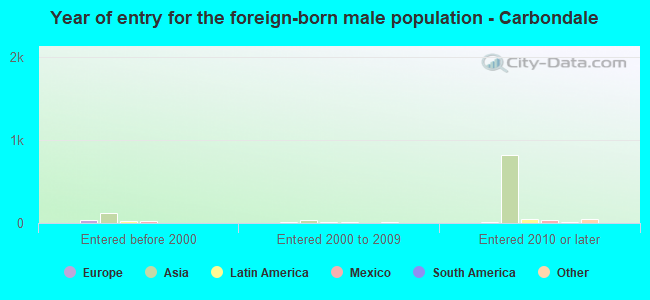
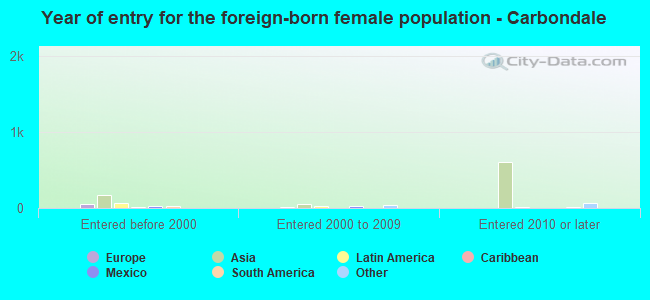
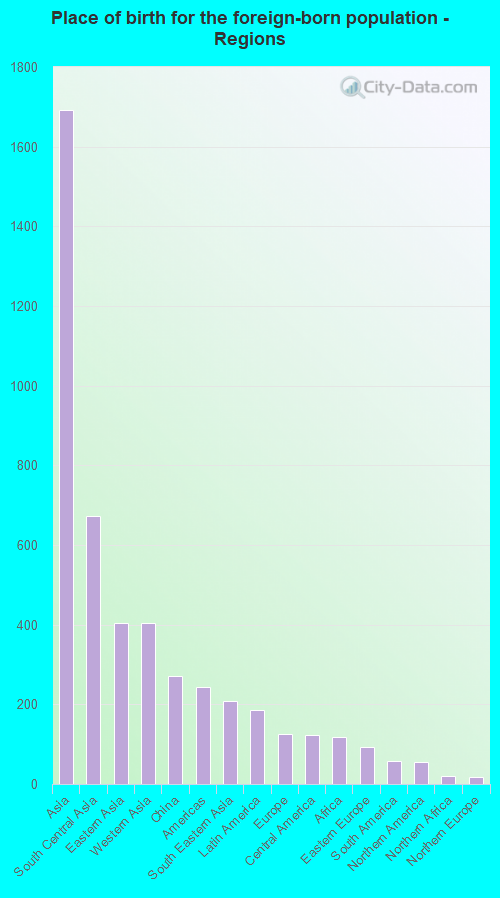
Foreign-born residents in Carbondale 2,180 residents are foreign born (7.6% Asia ).
This city:
10.0%Illinois:
14.1%
Marital status for residents in Carbondale Marital status - White (Caucasian) population 15 years and over
Males 73.4% Never married18.4% Now married0.7% Separated1.6% Widowed5.8% DivorcedFemales 56.5% Never married23.5% Now married3.2% Separated7.0% Widowed9.9% DivorcedWomen who gave birth in the past 12 months Now married:
100.0% (96)Unmarried:
0.0% (0)
Women who did not give birth in the past 12 months Now married:
19.6% (638)Unmarried:
80.4% (2,611)
Marital status - Black or African American population 15 years and over
Males 76.9% Never married14.3% Now married3.1% Separated1.7% Widowed4.0% DivorcedFemales 69.7% Never married15.7% Now married3.1% Separated2.8% Widowed8.8% DivorcedWomen who gave birth in the past 12 months Now married:
0.0% (0)Unmarried:
100.0% (7)
Women who did not give birth in the past 12 months Now married:
8.7% (181)Unmarried:
91.3% (1,899)
Marital status - American Indian / Alaska Native population 15 years and over
Males 0.0% Never married38.5% Now married0.0% Separated61.5% Widowed0.0% DivorcedFemales 100.0% Never married0.0% Now married0.0% Separated0.0% Widowed0.0% DivorcedMarital status - Asian population 15 years and over
Males 63.0% Never married34.9% Now married2.1% Separated0.0% Widowed0.0% DivorcedFemales 37.4% Never married49.9% Now married0.0% Separated6.8% Widowed5.8% DivorcedWomen who did not give birth in the past 12 months Now married:
41.6% (194)Unmarried:
58.4% (272)
Marital status - Native Hawaiian / Pacific Islander population 15 years and over
Males 100.0% Never married0.0% Now married0.0% Separated0.0% Widowed0.0% DivorcedFemales 100.0% Never married0.0% Now married0.0% Separated0.0% Widowed0.0% DivorcedWomen who did not give birth in the past 12 months Now married:
0.0% (0)Unmarried:
100.0% (24)
Marital status - Other race population 15 years and over
Males 59.3% Never married21.5% Now married16.4% Separated0.0% Widowed2.8% DivorcedFemales 85.0% Never married10.6% Now married4.3% Separated0.0% Widowed0.0% DivorcedWomen who did not give birth in the past 12 months Now married:
13.0% (29)Unmarried:
87.0% (194)
Marital status - Two or more races population 15 years and over
Males 75.8% Never married24.2% Now married0.0% Separated0.0% Widowed0.0% DivorcedFemales 76.6% Never married11.9% Now married0.7% Separated2.6% Widowed8.2% DivorcedWomen who gave birth in the past 12 months Now married:
15.8% (4)Unmarried:
84.2% (23)
Women who did not give birth in the past 12 months Now married:
10.5% (68)Unmarried:
89.5% (584)
Marital status - White alone, not Hispanic / Latino population 15 years and over
Males 73.4% Never married18.3% Now married0.7% Separated1.7% Widowed6.0% DivorcedFemales 55.8% Never married24.0% Now married3.3% Separated7.2% Widowed9.8% DivorcedWomen who gave birth in the past 12 months Now married:
100.0% (102)Unmarried:
0.0% (0)
Women who did not give birth in the past 12 months Now married:
20.2% (677)Unmarried:
79.8% (2,677)
Marital status - Hispanic or Latino population 15 years and over
Males 72.6% Never married20.3% Now married6.1% Separated0.0% Widowed1.1% DivorcedFemales 89.7% Never married5.4% Now married1.6% Separated0.0% Widowed3.3% DivorcedWomen who did not give birth in the past 12 months Now married:
3.2% (15)Unmarried:
96.8% (468)
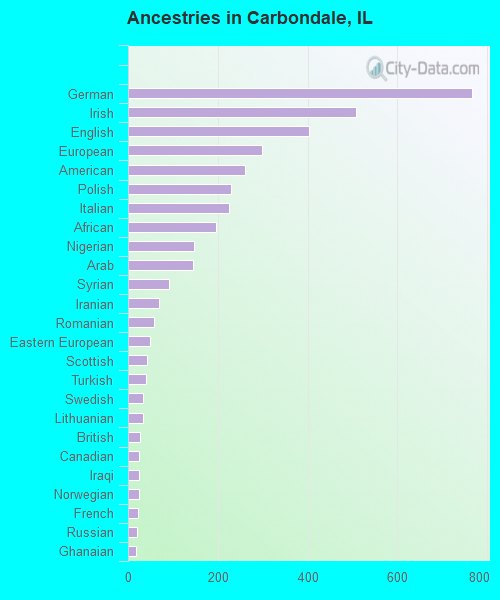
Ancestries in Carbondale
766 7.9% German507 5.2% Irish404 4.2% English298 3.1% European261 2.7% American229 2.4% Polish225 2.3% Italian195 2.0% African147 1.5% Nigerian144 1.5% Arab91 0.9% Syrian68 0.7% Iranian57 0.6% Romanian50 0.5% Eastern European42 0.4% Scottish41 0.4% Turkish34 0.4% Swedish33 0.3% Lithuanian26 0.3% British25 0.3% Canadian24 0.2% Iraqi24 0.2% Norwegian23 0.2% French20 0.2% Russian17 0.2% Ghanaian14 0.1% Moroccan14 0.1% Scotch-Irish14 0.1% Croatian13 0.1% Northern European11 0.1% Brazilian11 0.1% Czech11 0.1% Scandinavian11 0.1% West Indian4 0.04% Austrian3 0.03% Egyptian
Geographical mobility in Carbondale Same house 1 year ago 7,033 60.6% White (Caucasian)3,871 67.3% Black or African American25 38.9% American Indian / Alaska Native924 57.4% Asian58 78.0% Native Hawaiian / Pacific Islander319 69.0% Other race1,002 67.3% Two or more races7,323 61.1% White alone, not Hispanic / Latino729 66.0% Hispanic or LatinoMoved within same county 1,490 12.8% White / Caucasian763 13.3% Black or African American164 10.2% Asian16 21.6% Native Hawaiian / Pacific Islander70 15.2% Other race113 7.6% Two or more races1,537 12.8% White alone, not Hispanic / Latino129 11.7% Hispanic or LatinoMoved within same state 1,845 15.9% White / Caucasian974 16.9% Black or African American26 40.2% American Indian / Alaska Native85 5.3% Asian25 5.4% Other race237 15.9% Two or more races1,861 15.5% White alone, not Hispanic / Latino140 12.7% Hispanic or LatinoMoved from different state 1,325 11.4% White / Caucasian181 3.1% Black or African American15 24.0% American Indian / Alaska Native127 7.9% Asian17 3.7% Other race102 6.8% Two or more races1,286 10.7% White alone, not Hispanic / Latino121 10.9% Hispanic or LatinoMoved from abroad 57 0.5% White11 0.2% Black or African American324 20.1% Asian32 6.9% Other race23 1.5% Two or more races62 0.5% White alone, not Hispanic / Latino
Children Nativity (place of birth) in Carbondale
Children under 6 years - Living with two parents Both parents native 247 100.0% NativeBoth parents foreign-born 169 90.5% Native18 9.5% Foreign-bornOne native, one foreign-born parent 6 100.0% NativeChildren under 6 years - Living with one parent Native parent 335 100.0% NativeForeign-born parent 19 100.0% NativeChildren 6 to 17 years - Living with two parents Both parents native 353 96.0% Native15 4.0% Foreign-bornBoth parents foreign-born 148 65.0% Native80 35.0% Foreign-bornOne native, one foreign-born parent 64 100.0% NativeChildren 6 to 17 years - Living with one parent Native parent 812 97.8% Native18 2.2% Foreign-bornForeign-born parent 47 78.2% Native13 21.8% Foreign-born
Grandparents responsible for own grandchildren in Carbondale
Grandparents (30 to 59 years) White / Caucasian 14 66.7% Responsible for grandchildren7 33.3% Not responsible for grandchildrenBlack or African American 33 100.0% Responsible for grandchildrenTwo or more races 7 100.0% Responsible for grandchildrenWhite alone, not Hispanic / Latino 9 100.0% Not responsible for grandchildrenHispanic or Latino 20 100.0% Responsible for grandchildrenGrandparents (60 years and over) White / Caucasian 8 100.0% Not responsible for grandchildrenBlack or African American 12 38.3% Responsible for grandchildren20 61.7% Not responsible for grandchildrenWhite alone, not Hispanic / Latino 9 100.0% Not responsible for grandchildren