Races in Canyon Rim, Utah (UT) Detailed Stats
Ancestries, Foreign-born residents, place of birth

Recent posts about races in Canyon Rim, Utah on our local forum with over 2,400,000 registered users:
 | SLC Real Estate, Am I Clueless? (21 replies) |
| Would I like Salt Lake City? (nerd, nature, rent) (11 replies) |
| Yet another possibly moving to SLC! (12 replies) |
| HELP PLEASE! Huge opportunity to relocate to SLC BUT...... (7 replies) |
| Wedding in SLC (12 replies) |
| how are these homes and their schools? (27 replies) |
5.1% of Canyon Rim, UT residents are foreign-born (2.3% born in Europe, 1.2% born in Asia, 0.7% born in North America), which is 57.4% less than the foreign-born rate of 8.0% across the entire state of Utah.
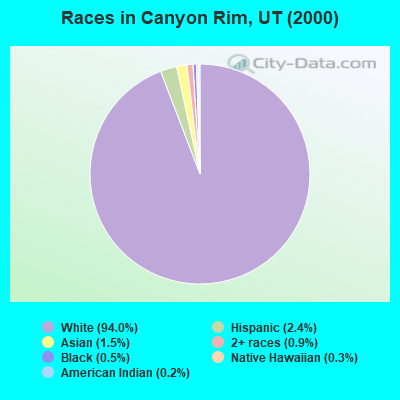
Race distribution in Canyon Rim

- 9,80194.0%White alone
- 2502.4%Hispanic
- 1601.5%Asian alone
- 980.9%Two or more races
- 530.5%Black alone
- 330.3%Native Hawaiian and Other
Pacific Islander alone - 250.2%American Indian alone
- 80.08%Other race alone
2000
2022
-
- 1,904,26585.3%White alone
- 201,5599.0%Hispanic
- 36,4831.6%Asian alone
- 31,3081.4%Two or more races
- 26,6631.2%American Indian alone
- 14,8060.7%Native Hawaiian and Other
Pacific Islander alone - 16,1370.7%Black alone
- 1,9480.09%Other race alone

-
- 2,557,46675.6%White alone
- 512,08615.1%Hispanic
- 119,3083.5%Two or more races
- 82,3882.4%Asian alone
- 36,9781.1%Native Hawaiian and Other
Pacific Islander alone - 34,8731.0%Black alone
- 22,8030.7%American Indian alone
- 14,8980.4%Other race alone

Income and house value in Canyon Rim
- Median household income in 2022
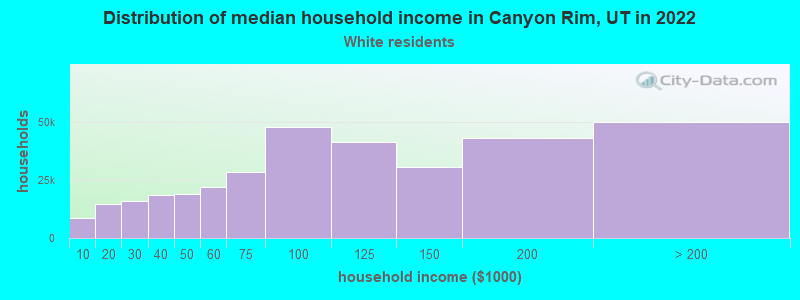
- $99,729White non-Hispanic householders
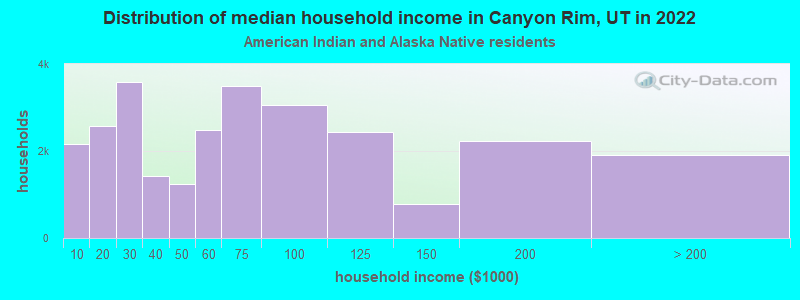
- $152,405American Indian and Alaska Native householders
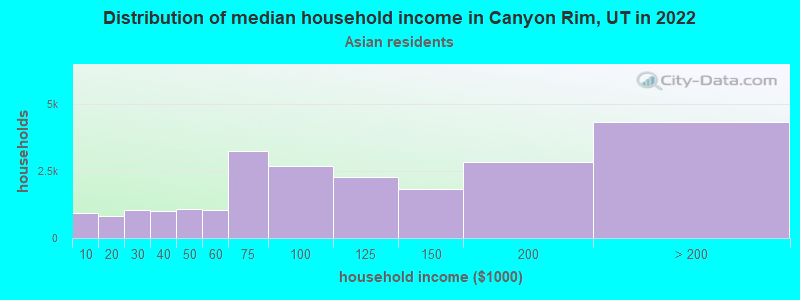
- $126,368Asian householders
- over $200,000Native Hawaiian and other Pacific Islander householders
- $68,278Some other race householders
- $48,363Two or more races householders
- $92,720Hispanic or Latino race householders
- Median 2022 house value
- $592,696White Non-Hispanic householders
- $392,687American Indian or Alaska Native householders
- $785,374Asian householders
- $567,214Native Hawaiian and other Pacific Islander householders
- $584,667Hispanic or Latino householders
Household income for White non-Hispanic householders
Household income for American Indian and Alaska Native householders
Household income for Asian householders
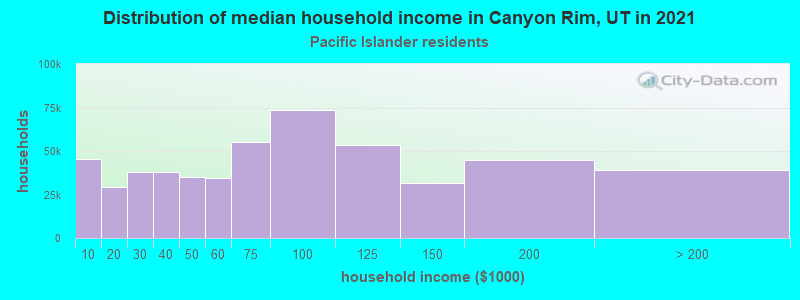
Household income for Native Hawaiian and other Pacific Islander householders
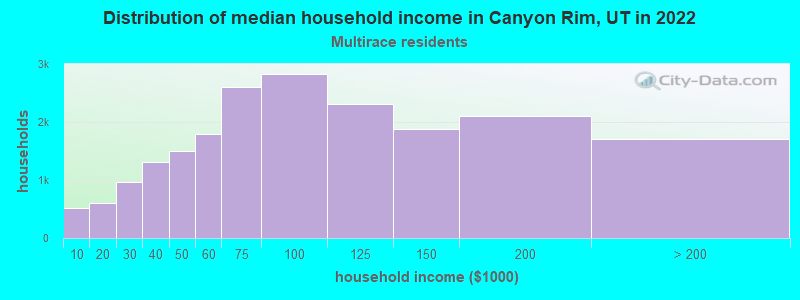
Household income for Two or more races householders
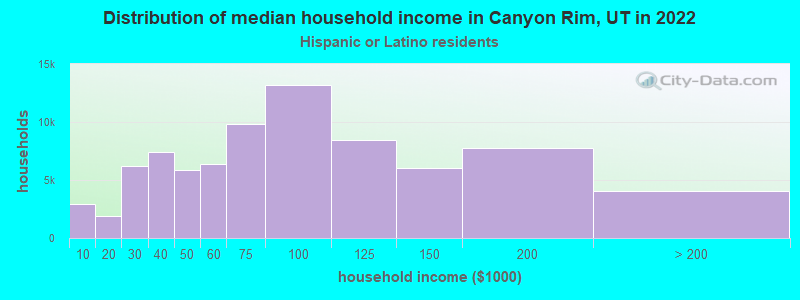
Household income for Hispanic or Latino race householders
Foreign-born residents in Canyon Rim
530 residents are foreign born (2.3% Europe, 1.2% Asia, 0.7% North America).
| This city: | 5.1% |
| Utah: | 7.1% |
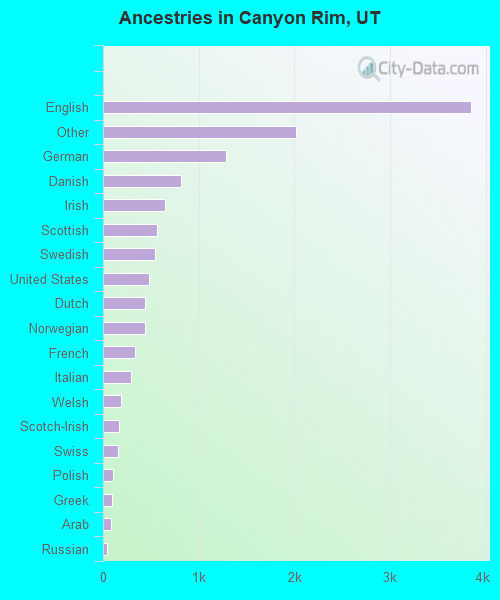
Ancestries in Canyon Rim

- 3,84430.5%English
- 2,01516.0%Other
- 1,28710.2%German
- 8126.4%Danish
- 6525.2%Irish
- 5614.5%Scottish
- 5424.3%Swedish
- 4803.8%United States
- 4443.5%Dutch
- 4373.5%Norwegian
- 3392.7%French
- 2922.3%Italian
- 1911.5%Welsh
- 1691.3%Scotch-Irish
- 1551.2%Swiss
- 1060.8%Polish
- 920.7%Greek
- 870.7%Arab
- 400.3%Russian
- 170.1%French Canadian
- 140.1%Subsaharan African
- 110.09%Lithuanian
- 70.06%Slovak
- 50.04%Czech
- 40.03%West Indian
Zip codes: 84109.