Races in Caneadea, New York (NY) Detailed Stats
Ancestries, Foreign-born residents, place of birth

Recent posts about races in Caneadea, New York on our local forum with over 2,400,000 registered users:
 | Raise your hand if you like Cuba (10 replies) |
4.5% of Caneadea, NY residents are foreign-born (2.0% born in Asia, 1.1% born in North America, 0.7% born in Latin America), which is 385.8% less than the foreign-born rate of 22.0% across the entire state of New York.
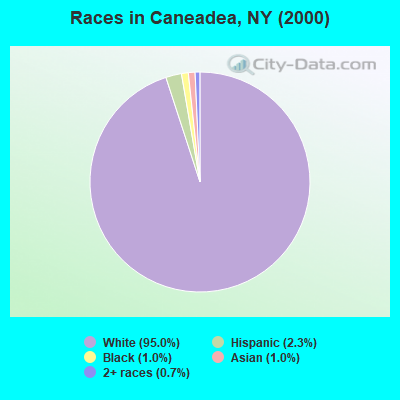
Race distribution in Caneadea

- 2,55895.0%White alone
- 612.3%Hispanic
- 271.0%Black alone
- 261.0%Asian alone
- 200.7%Two or more races
- 20.07%American Indian alone
2000
2022
-
- 11,760,98162.0%White alone
- 2,867,58315.1%Hispanic
- 2,812,62314.8%Black alone
- 1,035,9265.5%Asian alone
- 366,1161.9%Two or more races
- 75,4990.4%Other race alone
- 52,4990.3%American Indian alone
- 5,2300.03%Native Hawaiian and Other
Pacific Islander alone

-
- 10,408,93352.9%White alone
- 3,867,29919.7%Hispanic
- 2,633,84013.4%Black alone
- 1,776,2869.0%Asian alone
- 732,6703.7%Two or more races
- 216,1101.1%Other race alone
- 35,0820.2%American Indian alone
- 6,9310.04%Native Hawaiian and Other
Pacific Islander alone

Income and house value in Caneadea
- Median household income in 2022
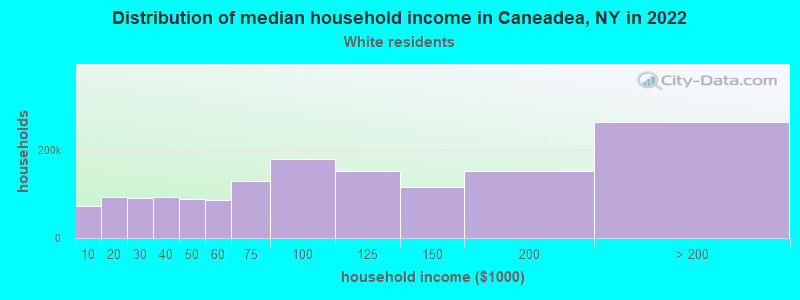
- $55,331White non-Hispanic householders
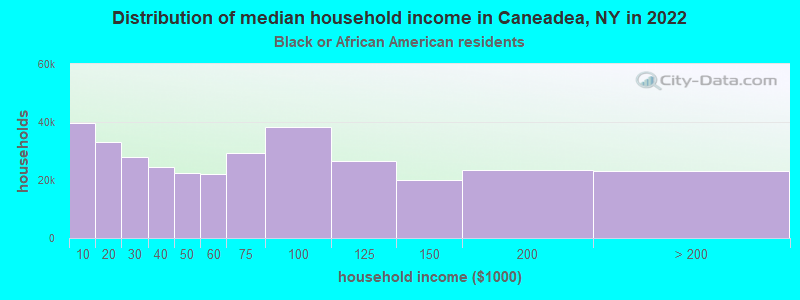
- $41,900Black householders
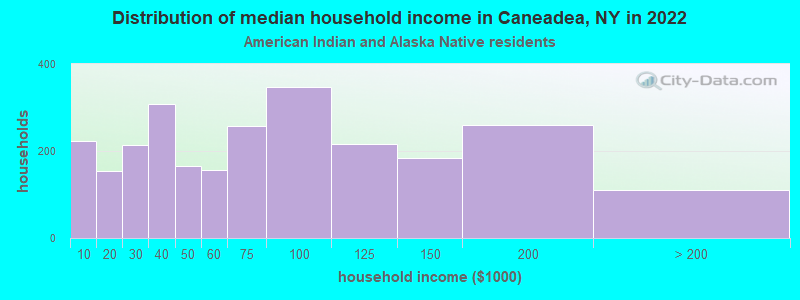
- $6,152American Indian and Alaska Native householders
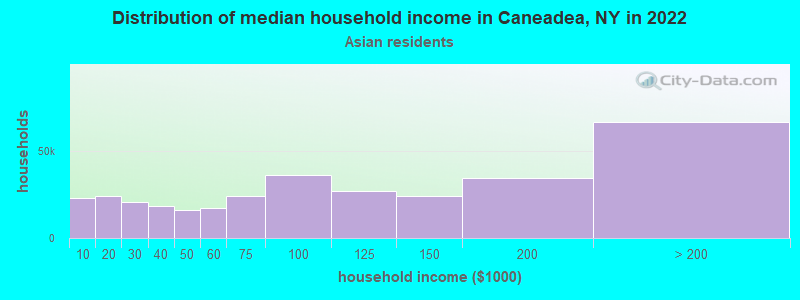
- $76,341Asian householders
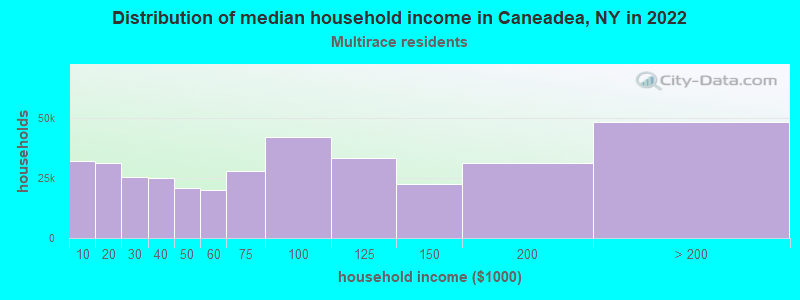
- $75,655Two or more races householders
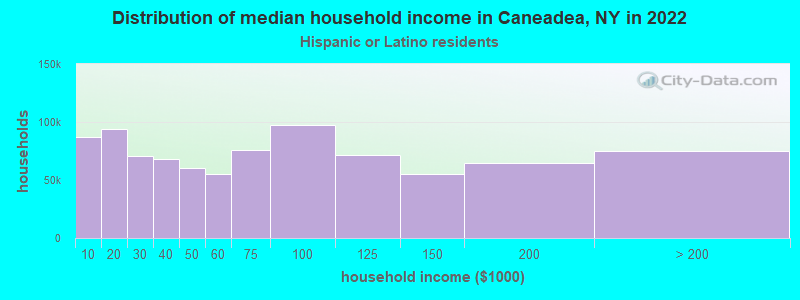
- $81,973Hispanic or Latino race householders
- Median 2022 house value
- $123,101White Non-Hispanic householders
Household income for White non-Hispanic householders
Household income for Black householders
Household income for American Indian and Alaska Native householders
Household income for Asian householders
Household income for Two or more races householders
Household income for Hispanic or Latino race householders
Foreign-born residents in Caneadea
122 residents are foreign born (2.0% Asia, 1.1% North America, 0.7% Latin America).
| This city: | 4.5% |
| New York: | 20.4% |
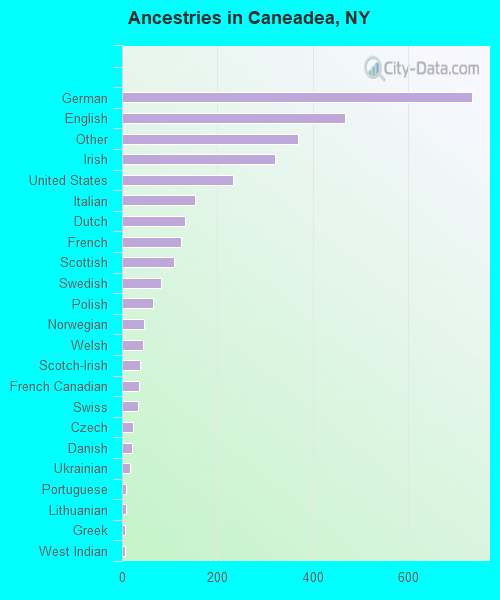
Ancestries in Caneadea

- 73223.8%German
- 46715.2%English
- 36812.0%Other
- 32110.4%Irish
- 2327.5%United States
- 1524.9%Italian
- 1314.3%Dutch
- 1234.0%French
- 1083.5%Scottish
- 812.6%Swedish
- 642.1%Polish
- 461.5%Norwegian
- 431.4%Welsh
- 371.2%Scotch-Irish
- 351.1%French Canadian
- 331.1%Swiss
- 240.8%Czech
- 210.7%Danish
- 160.5%Ukrainian
- 90.3%Portuguese
- 80.3%Lithuanian
- 70.2%Greek
- 70.2%West Indian
- 60.2%Hungarian
- 40.1%Arab
- 20.06%Subsaharan African
- 10.03%Russian
Zip codes: 14744.