Races in Canby, Oregon (OR) Detailed Stats
Data:
Races - White alone (%)
Races - White alone (% change since 2000)
Races - Black alone (%)
Races - Black alone (% change since 2000)
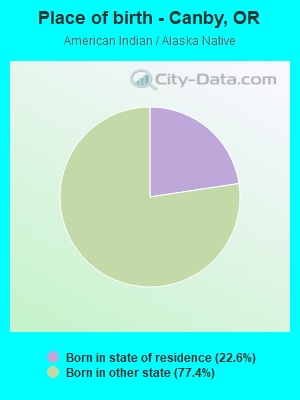
Races - American Indian alone (%)
Races - American Indian alone (% change since 2000)
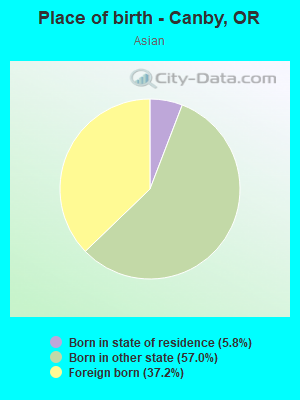
Races - Asian alone (%)
Races - Asian alone (% change since 2000)
Races - Hispanic (%)
Races - Hispanic (% change since 2000)
Races - Native Hawaiian and Other Pacific Islander alone (%)
Races - Native Hawaiian and Other Pacific Islander alone (% change since 2000)
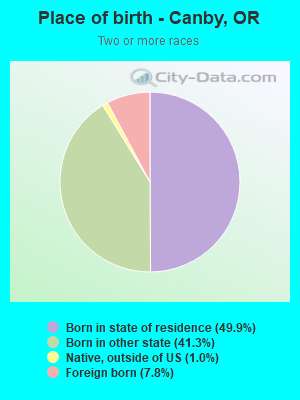
Races - Two or more races(%)
Races - Two or more races(% change since 2000)
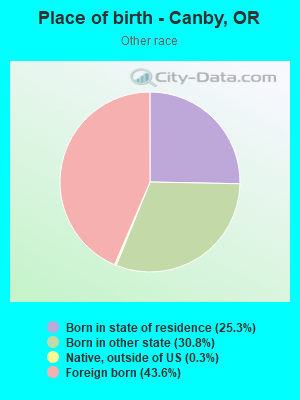
Races - Other race alone (%)
Races - Other race alone (% change since 2000)
Racial diversity
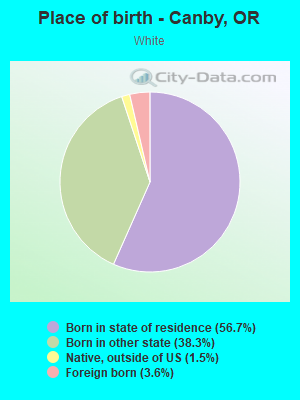
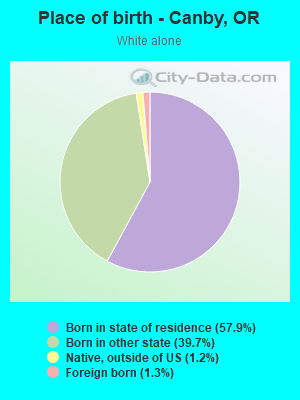
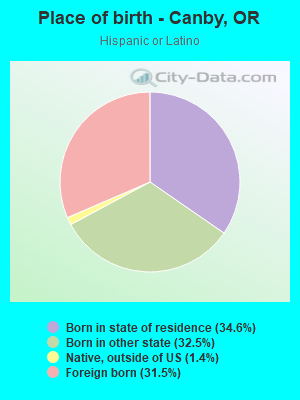
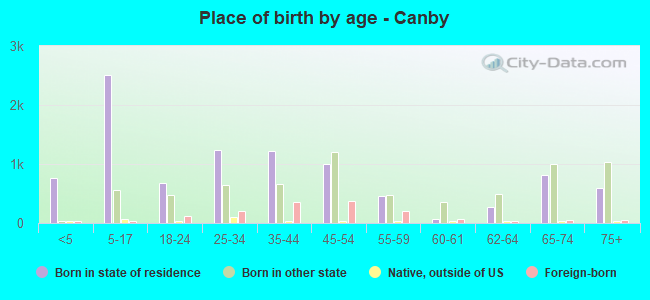
Place of birth - Born in state of residence (%)
Place of birth - Born in state of residence (%) - White
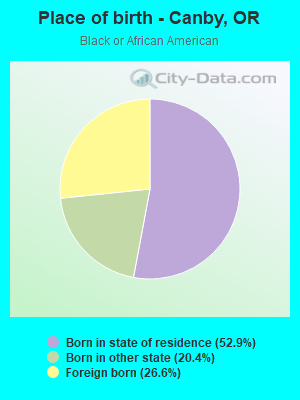
Place of birth - Born in state of residence (%) - Black or African American
Place of birth - Born in state of residence (%) - Asian
Place of birth - Born in state of residence (%) - Hispanic or Latino
Place of birth - Born in state of residence (%) - American Indian and Alaska Native
Place of birth - Born in state of residence (%) - Multirace
Place of birth - Born in state of residence (%) - Other Race
Place of birth - Born in other state (%)
Place of birth - Born in other state (%) - White
Place of birth - Born in other state (%) - Black or African American
Place of birth - Born in other state (%) - Asian
Place of birth - Born in other state (%) - Hispanic or Latino
Place of birth - Born in other state (%) - American Indian and Alaska Native
Place of birth - Born in other state (%) - Multirace
Place of birth - Born in other state (%) - Other Race
Place of birth - Native, outside of US (%)
Place of birth - Native, outside of US (%) - White
Place of birth - Native, outside of US (%) - Black or African American
Place of birth - Native, outside of US (%) - Asian
Place of birth - Native, outside of US (%) - Hispanic or Latino
Place of birth - Native, outside of US (%) - American Indian and Alaska Native
Place of birth - Native, outside of US (%) - Multirace
Place of birth - Native, outside of US (%) - Other Race
Place of birth - Foreign born (%)
Place of birth - Foreign born (%) - White
Place of birth - Foreign born (%) - Black or African American
Place of birth - Foreign born (%) - Asian
Place of birth - Foreign born (%) - Hispanic or Latino
Place of birth - Foreign born (%) - American Indian and Alaska Native
Place of birth - Foreign born (%) - Multirace
Place of birth - Foreign born (%) - Other Race
Residents speaking English at home (%)
Residents speaking English at home - Born in the United States (%)
Residents speaking English at home - Native, born elsewhere (%)
Residents speaking English at home - Foreign born (%)
Residents speaking Spanish at home (%)
Residents speaking Spanish at home - Born in the United States (%)
Residents speaking Spanish at home - Native, born elsewhere (%)
Residents speaking Spanish at home - Foreign born (%)
Residents speaking other language at home (%)
Residents speaking other language at home - Born in the United States (%)
Residents speaking other language at home - Native, born elsewhere (%)
Residents speaking other language at home - Foreign born (%)
Marital status - Never married (%)
Marital status - Now married (%)
Marital status - Separated (%)
Marital status - Widowed (%)
Marital status - Divorced (%)
Ancestries Reported - Arab (%)
Ancestries Reported - Czech (%)
Ancestries Reported - Danish (%)
Ancestries Reported - Dutch (%)
Ancestries Reported - English (%)
Ancestries Reported - French (%)
Ancestries Reported - French Canadian (%)
Ancestries Reported - German (%)
Ancestries Reported - Greek (%)
Ancestries Reported - Hungarian (%)
Ancestries Reported - Irish (%)
Ancestries Reported - Italian (%)
Ancestries Reported - Lithuanian (%)
Ancestries Reported - Norwegian (%)
Ancestries Reported - Polish (%)
Ancestries Reported - Portuguese (%)
Ancestries Reported - Russian (%)
Ancestries Reported - Scotch-Irish (%)
Ancestries Reported - Scottish (%)
Ancestries Reported - Slovak (%)
Ancestries Reported - Subsaharan African (%)
Ancestries Reported - Swedish (%)
Ancestries Reported - Swiss (%)
Ancestries Reported - Ukrainian (%)
Ancestries Reported - United States (%)
Ancestries Reported - Welsh (%)
Ancestries Reported - West Indian (%)
Ancestries Reported - Other (%)
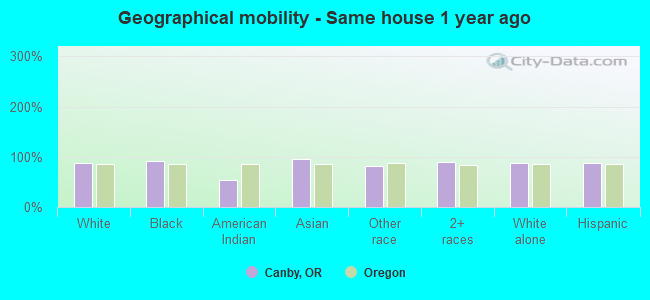
Geographical mobility - Same house 1 year ago (%)
Geographical mobility - Same house 1 year ago (%) - White
Geographical mobility - Same house 1 year ago (%) - Black or African American
Geographical mobility - Same house 1 year ago (%) - Asian
Geographical mobility - Same house 1 year ago (%) - Hispanic or Latino
Geographical mobility - Same house 1 year ago (%) - American Indian and Alaska Native
Geographical mobility - Same house 1 year ago (%) - Multirace
Geographical mobility - Same house 1 year ago (%) - Other Race
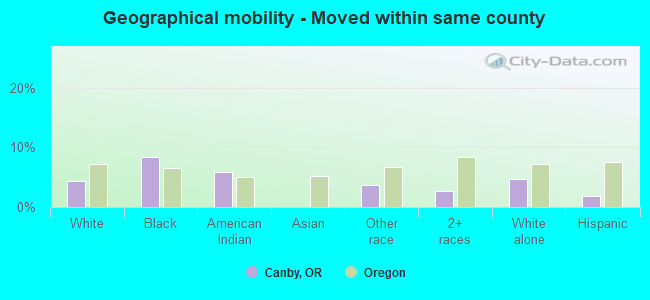
Geographical mobility - Moved within same county (%)
Geographical mobility - Moved within same county (%) - White
Geographical mobility - Moved within same county (%) - Black or African American
Geographical mobility - Moved within same county (%) - Asian
Geographical mobility - Moved within same county (%) - Hispanic or Latino
Geographical mobility - Moved within same county (%) - American Indian and Alaska Native
Geographical mobility - Moved within same county (%) - Multirace
Geographical mobility - Moved within same county (%) - Other Race
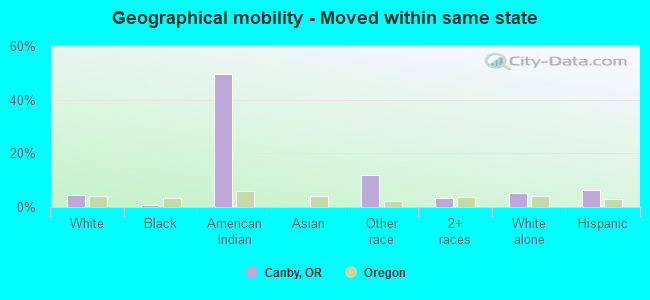
Geographical mobility - Moved from different county within same state (%)
Geographical mobility - Moved from different county within same state (%) - White
Geographical mobility - Moved from different county within same state (%) - Black or African American
Geographical mobility - Moved from different county within same state (%) - Asian
Geographical mobility - Moved from different county within same state (%) - Hispanic or Latino
Geographical mobility - Moved from different county within same state (%) - American Indian and Alaska Native
Geographical mobility - Moved from different county within same state (%) - Multirace
Geographical mobility - Moved from different county within same state (%) - Other Race
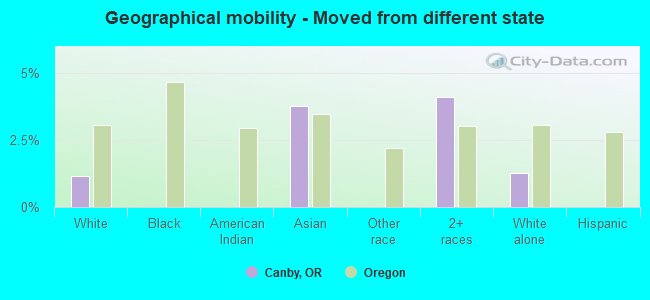
Geographical mobility - Moved from different state (%)
Geographical mobility - Moved from different state (%) - White
Geographical mobility - Moved from different state (%) - Black or African American
Geographical mobility - Moved from different state (%) - Asian
Geographical mobility - Moved from different state (%) - Hispanic or Latino
Geographical mobility - Moved from different state (%) - American Indian and Alaska Native
Geographical mobility - Moved from different state (%) - Multirace
Geographical mobility - Moved from different state (%) - Other Race
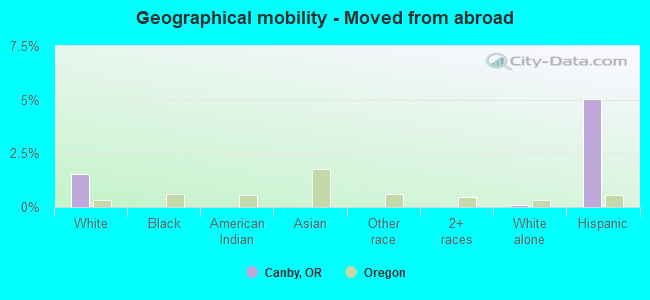
Geographical mobility - Moved from abroad (%)
Geographical mobility - Moved from abroad (%) - White
Geographical mobility - Moved from abroad (%) - Black or African American
Geographical mobility - Moved from abroad (%) - Asian
Geographical mobility - Moved from abroad (%) - Hispanic or Latino
Geographical mobility - Moved from abroad (%) - American Indian and Alaska Native
Geographical mobility - Moved from abroad (%) - Multirace
Geographical mobility - Moved from abroad (%) - Other Race
Place of birth for the foreign-born population - Ireland (%)
Place of birth for the foreign-born population - Denmark (%)
Place of birth for the foreign-born population - Norway (%)
Place of birth for the foreign-born population - Sweden (%)
Place of birth for the foreign-born population - United Kingdom (%)
Place of birth for the foreign-born population - England (%)
Place of birth for the foreign-born population - Scotland (%)
Place of birth for the foreign-born population - Other Northern Europe (%)
Place of birth for the foreign-born population - Austria (%)
Place of birth for the foreign-born population - Belgium (%)
Place of birth for the foreign-born population - France (%)
Place of birth for the foreign-born population - Germany (%)
Place of birth for the foreign-born population - Netherlands (%)
Place of birth for the foreign-born population - Switzerland (%)
Place of birth for the foreign-born population - Other Western Europe (%)
Place of birth for the foreign-born population - Greece (%)
Place of birth for the foreign-born population - Italy (%)
Place of birth for the foreign-born population - Portugal (%)
Place of birth for the foreign-born population - Spain (%)
Place of birth for the foreign-born population - Other Southern Europe (%)
Place of birth for the foreign-born population - Albania (%)
Place of birth for the foreign-born population - Belarus (%)
Place of birth for the foreign-born population - Bosnia and Herzegovina (%)
Place of birth for the foreign-born population - Bulgaria (%)
Place of birth for the foreign-born population - Croatia (%)
Place of birth for the foreign-born population - Czechoslovakia (%)
Place of birth for the foreign-born population - Hungary (%)
Place of birth for the foreign-born population - Latvia (%)
Place of birth for the foreign-born population - Lithuania (%)
Place of birth for the foreign-born population - North Macedonia (Macedonia) (%)
Place of birth for the foreign-born population - Moldova (%)
Place of birth for the foreign-born population - Poland (%)
Place of birth for the foreign-born population - Romania (%)
Place of birth for the foreign-born population - Russia (%)
Place of birth for the foreign-born population - Serbia (%)
Place of birth for the foreign-born population - Ukraine (%)
Place of birth for the foreign-born population - Other Eastern Europe (%)
Place of birth for the foreign-born population - China (%)
Place of birth for the foreign-born population - Hong Kong (%)
Place of birth for the foreign-born population - Taiwan (%)
Place of birth for the foreign-born population - Japan (%)
Place of birth for the foreign-born population - Korea (%)
Place of birth for the foreign-born population - Other Eastern Asia (%)
Place of birth for the foreign-born population - Afghanistan (%)
Place of birth for the foreign-born population - Bangladesh (%)
Place of birth for the foreign-born population - India (%)
Place of birth for the foreign-born population - Iran (%)
Place of birth for the foreign-born population - Kazakhstan (%)
Place of birth for the foreign-born population - Nepal (%)
Place of birth for the foreign-born population - Pakistan (%)
Place of birth for the foreign-born population - Sri Lanka (%)
Place of birth for the foreign-born population - Uzbekistan (%)
Place of birth for the foreign-born population - Other South Central Asia (%)
Place of birth for the foreign-born population - Burma (%)
Place of birth for the foreign-born population - Cambodia (%)
Place of birth for the foreign-born population - Indonesia (%)
Place of birth for the foreign-born population - Laos (%)
Place of birth for the foreign-born population - Malaysia (%)
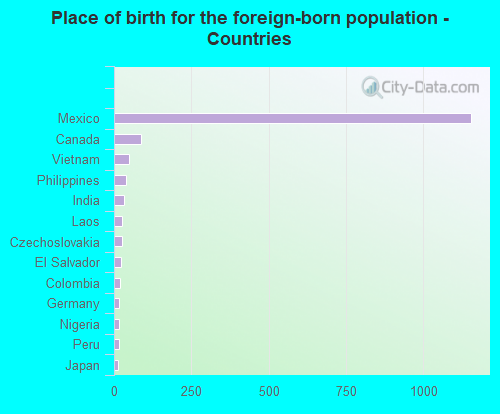
Place of birth for the foreign-born population - Philippines (%)
Place of birth for the foreign-born population - Singapore (%)
Place of birth for the foreign-born population - Thailand (%)
Place of birth for the foreign-born population - Vietnam (%)
Place of birth for the foreign-born population - Other South Eastern Asia (%)
Place of birth for the foreign-born population - Armenia (%)
Place of birth for the foreign-born population - Iraq (%)
Place of birth for the foreign-born population - Israel (%)
Place of birth for the foreign-born population - Jordan (%)
Place of birth for the foreign-born population - Kuwait (%)
Place of birth for the foreign-born population - Lebanon (%)
Place of birth for the foreign-born population - Saudi Arabia (%)
Place of birth for the foreign-born population - Syria (%)
Place of birth for the foreign-born population - Turkey (%)
Place of birth for the foreign-born population - Yemen (%)
Place of birth for the foreign-born population - Other Western Asia (%)
Place of birth for the foreign-born population - Eritrea (%)
Place of birth for the foreign-born population - Ethiopia (%)
Place of birth for the foreign-born population - Kenya (%)
Place of birth for the foreign-born population - Somalia (%)
Place of birth for the foreign-born population - Uganda (%)
Place of birth for the foreign-born population - Zimbabwe (%)
Place of birth for the foreign-born population - Other Eastern Africa (%)
Place of birth for the foreign-born population - Cameroon (%)
Place of birth for the foreign-born population - Congo (%)
Place of birth for the foreign-born population - Democratic Republic of Congo (Zaire) (%)
Place of birth for the foreign-born population - Other Middle Africa (%)
Place of birth for the foreign-born population - Egypt (%)
Place of birth for the foreign-born population - Morocco (%)
Place of birth for the foreign-born population - Sudan (%)
Place of birth for the foreign-born population - Other Northern Africa (%)
Place of birth for the foreign-born population - South Africa (%)
Place of birth for the foreign-born population - Other Southern Africa (%)
Place of birth for the foreign-born population - Cabo Verde (%)
Place of birth for the foreign-born population - Ghana (%)
Place of birth for the foreign-born population - Liberia (%)
Place of birth for the foreign-born population - Nigeria (%)
Place of birth for the foreign-born population - Senegal (%)
Place of birth for the foreign-born population - Sierra Leone (%)
Place of birth for the foreign-born population - Other Western Africa (%)
Place of birth for the foreign-born population - Australia (%)
Place of birth for the foreign-born population - New Zealand (%)
Place of birth for the foreign-born population - Fiji (%)
Place of birth for the foreign-born population - Micronesia (%)
Place of birth for the foreign-born population - Bahamas (%)
Place of birth for the foreign-born population - Barbados (%)
Place of birth for the foreign-born population - Cuba (%)
Place of birth for the foreign-born population - Dominica (%)
Place of birth for the foreign-born population - Dominican Republic (%)
Place of birth for the foreign-born population - Grenada (%)
Place of birth for the foreign-born population - Haiti (%)
Place of birth for the foreign-born population - Jamaica (%)
Place of birth for the foreign-born population - St. Vincent and the Grenadines (%)
Place of birth for the foreign-born population - Trinidad and Tobago (%)
Place of birth for the foreign-born population - West Indies (%)
Place of birth for the foreign-born population - Other Caribbean (%)
Place of birth for the foreign-born population - Belize (%)
Place of birth for the foreign-born population - Costa Rica (%)
Place of birth for the foreign-born population - El Salvador (%)
Place of birth for the foreign-born population - Guatemala (%)
Place of birth for the foreign-born population - Honduras (%)
Place of birth for the foreign-born population - Mexico (%)
Place of birth for the foreign-born population - Nicaragua (%)
Place of birth for the foreign-born population - Panama (%)
Place of birth for the foreign-born population - Other Central America (%)
Place of birth for the foreign-born population - Argentina (%)
Place of birth for the foreign-born population - Bolivia (%)
Place of birth for the foreign-born population - Brazil (%)
Place of birth for the foreign-born population - Chile (%)
Place of birth for the foreign-born population - Colombia (%)
Place of birth for the foreign-born population - Ecuador (%)
Place of birth for the foreign-born population - Guyana (%)
Place of birth for the foreign-born population - Peru (%)
Place of birth for the foreign-born population - Uruguay (%)
Place of birth for the foreign-born population - Venezuela (%)
Place of birth for the foreign-born population - Other South America (%)
Place of birth for the foreign-born population - Canada (%)
Place of birth for the foreign-born population - Other Northern America (%)
Place of birth for the foreign-born population - Other (%)
Latest news about races in Canby, OR collected exclusively by city-data.com from local newspapers, TV, and radio stations
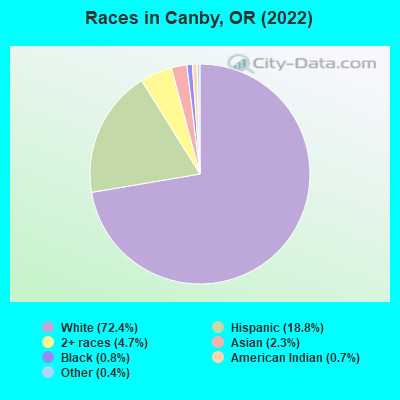
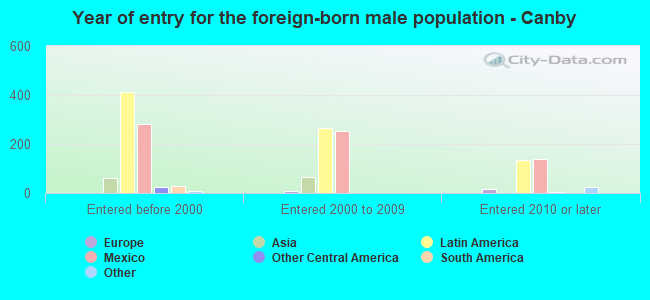
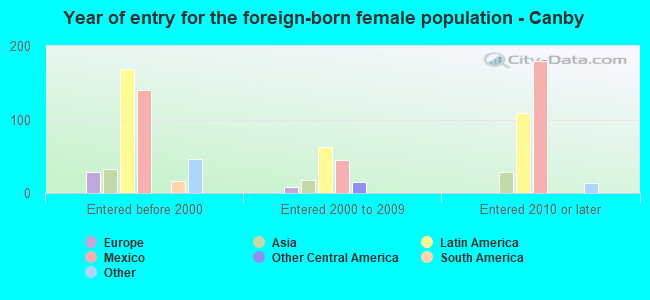
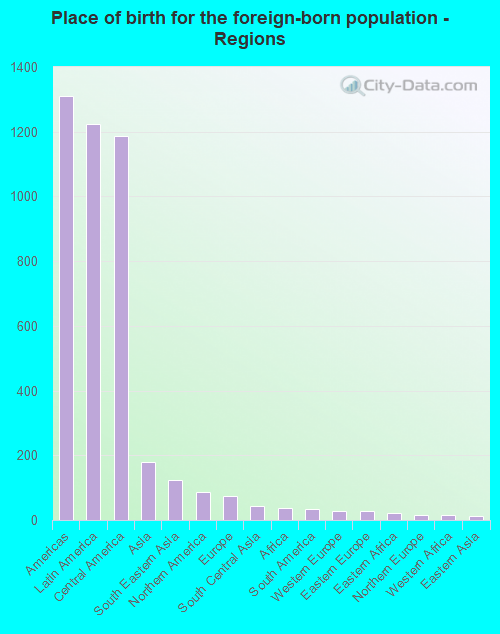
According to 2022 data, the most numerous races in Canby, OR are White alone (13,186 residents), Hispanic (3,423 residents), and Two or more races (855 residents). 86.9% of Canby residents speak English at home. 8.8% of Canby, OR residents are foreign-born (6.6% born in Latin America, 1.0% born in Asia), which is 2.3% less than the foreign-born rate of 9.0% across the entire state of Oregon.
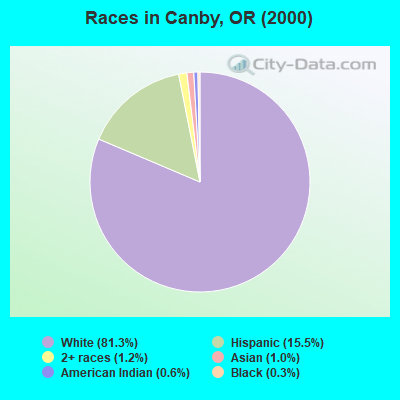
Race distribution in Canby
2000 2022
2,857,616 83.5% White alone 275,314 8.0% Hispanic 100,333 2.9% Asian alone 82,733 2.4% Two or more races 53,325 1.6% Black alone 40,130 1.2% American Indian alone 7,398 0.2% Native Hawaiian and Other 4,550 0.1% Other race alone
3,037,571 71.6% White alone 609,538 14.4% Hispanic 252,744 6.0% Two or more races 191,283 4.5% Asian alone 78,228 1.8% Black alone 29,399 0.7% American Indian alone 25,731 0.6% Other race alone 15,643 0.4% Native Hawaiian and Other
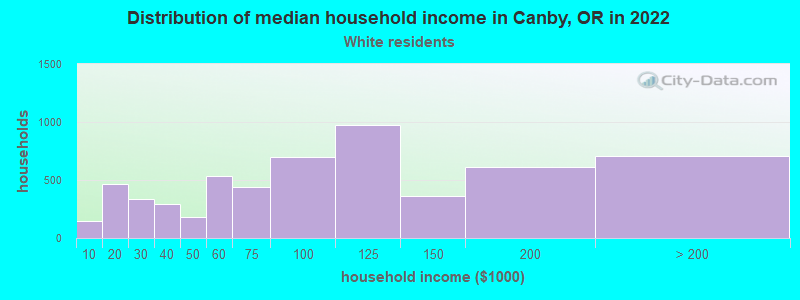
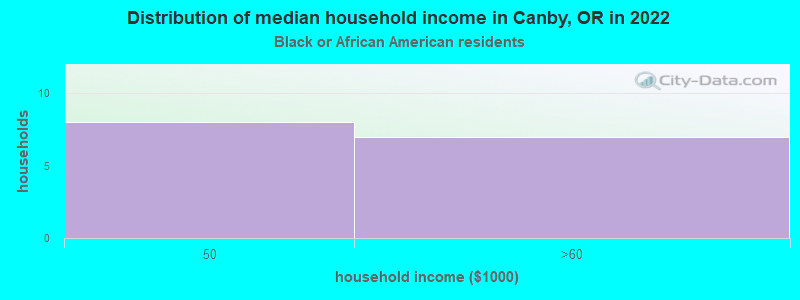
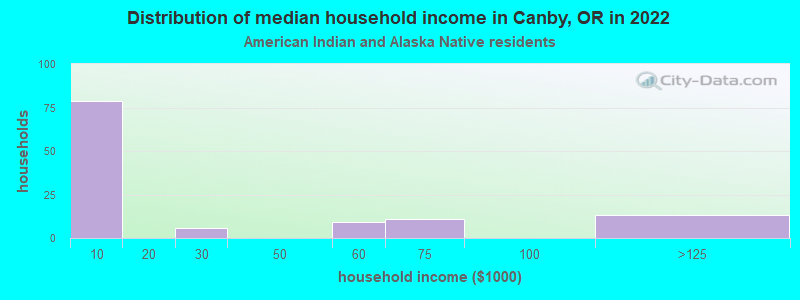
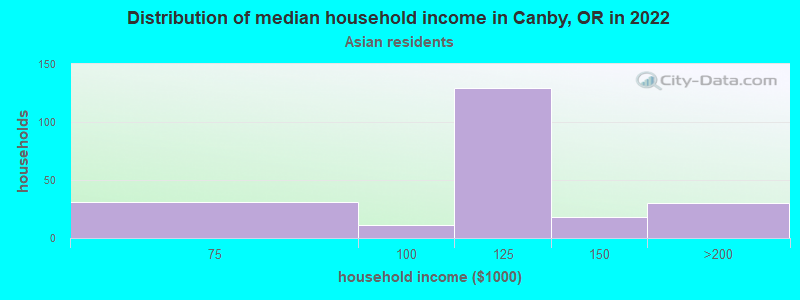
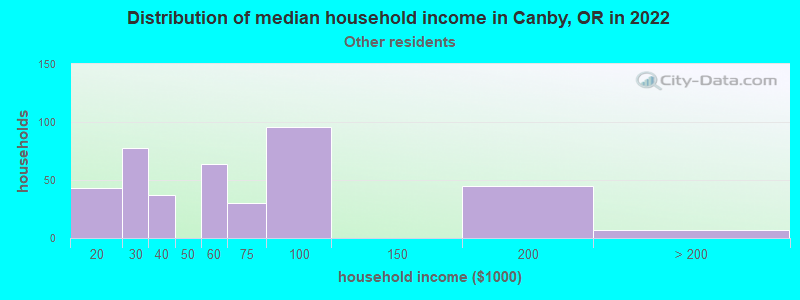
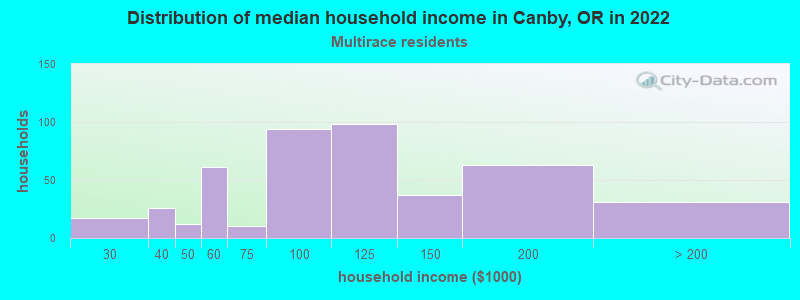
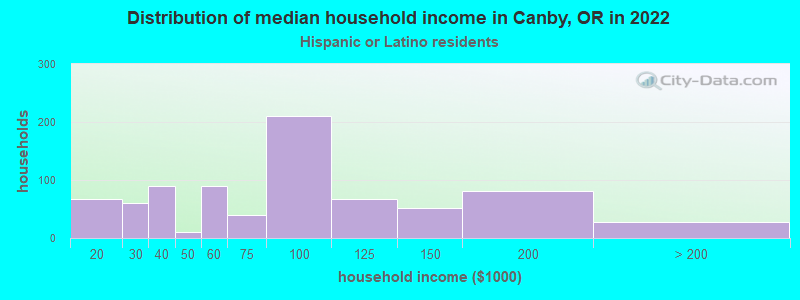
Income and house value in Canby Median household income in 2022 $93,108 White non-Hispanic householders$108,999 Asian householders$69,793 Some other race householders$101,368 Two or more races householders$90,090 Hispanic or Latino race householdersMedian 2022 house value $532,821 White Non-Hispanic householders$588,709 Black or African American householders $480,387 Asian householders$511,471 Some other race householders$490,748 Two or more races householders$518,692 Hispanic or Latino householders
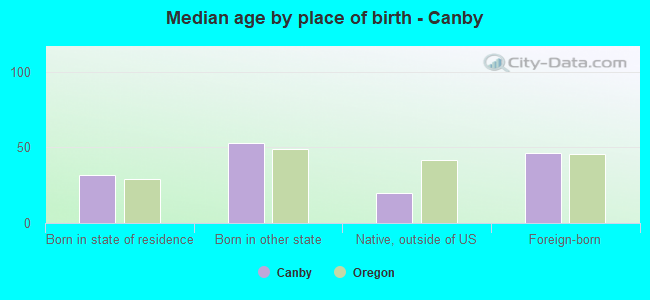
Median age by race in Canby
46.0 Median age for White residents42.2 48.8 25.5 Median age for Black or African American residents41.0 7.1 73.8 Median age for American Indian / Alaska Native residents75.8 74.6 39.5 Median age for Asian residents49.6 32.8 -764,705,881.6 Median age for Native Hawaiian / Pacific Islander residents-764,119,600.6 -774,891,774.1 24.9 Median age for Other race residents26.4 24.9 22.6 Median age for Two or more races residents28.9 22.7 48.1 Median age for White alone residents45.3 50.4 30.8 Median age for Hispanic or Latino residents31.5 25.5
Owner/renter occupied households by race in Canby
House owners and renters - White residents 4,215 72.4% Owner occupied1,606 27.6% Renter occupiedHouse owners and renters - Black or African American residents 12 48.7% Owner occupied13 51.3% Renter occupiedHouse owners and renters - American Indian / Alaska Native residents 29 23.4% Owner occupied97 76.6% Renter occupiedHouse owners and renters - Asian residents 63 41.3% Owner occupied90 58.7% Renter occupiedHouse owners and renters - Other race residents 124 28.7% Owner occupied308 71.3% Renter occupiedHouse owners and renters - Two or more races residents 308 66.2% Owner occupied157 33.8% Renter occupiedHouse owners and renters - White alone residents 4,112 73.3% Owner occupied1,498 26.7% Renter occupiedHouse owners and renters - Hispanic or Latino residents 332 43.8% Owner occupied426 56.2% Renter occupied
Language usage in Canby
English speakers - Total 86.9% of residents of Canby speak English at home.
10.4% of residents speak Spanish at home 821 45.3% Speak English very well990 54.7% Speak English less than very well1.7% of residents speak other language at home 246 81.5% Speak English very well56 18.5% Speak English less than very well
English speakers - Born in the United States 90.0% of residents of Canby speak English at home.
8.8% of residents speak Spanish at home 399 65.5% Speak English very well210 34.5% Speak English less than very well1.7% of residents speak other language at home 117 100.0% Speak English very well
English speakers - Native, born elsewhere 76.4% of residents of Canby speak English at home.
13.8% of residents speak Spanish at home 31 100.0% Speak English very well
English speakers - Foreign-born 29.2% of residents of Canby speak English at home.
57.1% of residents speak Spanish at home 75 8.9% Speak English very well769 91.1% Speak English less than very well11.4% of residents speak other language at home 105 62.1% Speak English very well64 37.9% Speak English less than very well
White (Caucasian) - Speak only English Native:
96.6% (12,794)Foreign-born:
34.1% (176)
White (Caucasian) - Speak another language Native:
3.3% (441)Foreign-born:
62.2% (322)
Black or African American - Speak only English Native:
99.5% (68)Foreign-born:
45.0% (13)
Asian - Speak only English Native:
69.5% (190)Foreign-born:
14.6% (24)
Asian - Speak another language Native:
29.8% (81)Foreign-born:
85.3% (139)
Other race - Speak only English Native:
45.3% (330)Foreign-born:
49.0% (274)
Other race - Speak another language Native:
54.7% (399)Foreign-born:
66.3% (371)
Two or more races - Speak only English Native:
75.2% (1,131)Foreign-born:
49.2% (76)
Two or more races - Speak another language Native:
24.8% (373)Foreign-born:
55.3% (85)
White alone - Speak only English Native:
97.9% (12,248)Foreign-born:
84.8% (140)
White alone - Speak another language Native:
2.1% (262)Foreign-born:
19.2% (32)
Hispanic or Latino - Speak only English Native:
60.4% (1,356)Foreign-born:
39.0% (410)
Hispanic or Latino - Speak another language Native:
37.2% (837)Foreign-born:
67.7% (712)
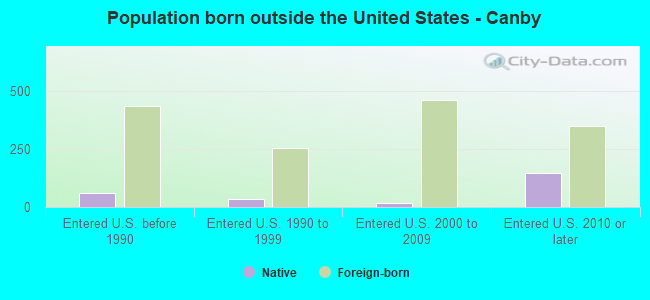
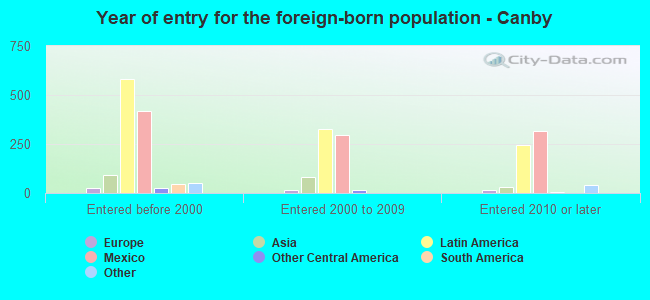
Foreign-born residents in Canby 1,604 residents are foreign born (6.6% Latin America , 1.0% Asia ).
This city:
8.8%Oregon:
9.8%
Marital status for residents in Canby Marital status - White (Caucasian) population 15 years and over
Males 24.7% Never married61.5% Now married1.6% Separated3.0% Widowed9.2% DivorcedFemales 19.4% Never married55.4% Now married1.2% Separated10.0% Widowed14.1% DivorcedWomen who gave birth in the past 12 months Now married:
55.3% (85)Unmarried:
44.7% (69)
Women who did not give birth in the past 12 months Now married:
52.4% (1,408)Unmarried:
47.6% (1,279)
Marital status - Black or African American population 15 years and over
Males 70.7% Never married29.3% Now married0.0% Separated0.0% Widowed0.0% DivorcedFemales 100.0% Never married0.0% Now married0.0% Separated0.0% Widowed0.0% DivorcedWomen who did not give birth in the past 12 months Now married:
0.0% (0)Unmarried:
100.0% (26)
Marital status - American Indian / Alaska Native population 15 years and over
Males 0.0% Never married100.0% Now married0.0% Separated0.0% Widowed0.0% DivorcedFemales 0.0% Never married18.4% Now married0.0% Separated5.3% Widowed76.3% DivorcedWomen who did not give birth in the past 12 months Now married:
100.0% (8)Unmarried:
0.0% (0)
Marital status - Asian population 15 years and over
Males 36.6% Never married63.4% Now married0.0% Separated0.0% Widowed0.0% DivorcedFemales 38.6% Never married55.9% Now married0.0% Separated5.5% Widowed0.0% DivorcedWomen who gave birth in the past 12 months Now married:
100.0% (32)Unmarried:
0.0% (0)
Women who did not give birth in the past 12 months Now married:
22.2% (16)Unmarried:
77.8% (57)
Marital status - Other race population 15 years and over
Males 60.6% Never married39.4% Now married0.0% Separated0.0% Widowed0.0% DivorcedFemales 49.3% Never married42.3% Now married7.4% Separated0.0% Widowed0.9% DivorcedWomen who did not give birth in the past 12 months Now married:
39.1% (195)Unmarried:
60.9% (305)
Marital status - Two or more races population 15 years and over
Males 18.9% Never married60.4% Now married0.0% Separated0.0% Widowed20.7% DivorcedFemales 39.9% Never married53.5% Now married0.6% Separated4.6% Widowed1.3% DivorcedWomen who did not give birth in the past 12 months Now married:
53.3% (324)Unmarried:
46.7% (284)
Marital status - White alone, not Hispanic / Latino population 15 years and over
Males 20.7% Never married65.5% Now married1.3% Separated3.0% Widowed9.5% DivorcedFemales 18.1% Never married55.6% Now married1.2% Separated10.7% Widowed14.5% DivorcedWomen who gave birth in the past 12 months Now married:
55.3% (87)Unmarried:
44.7% (70)
Women who did not give birth in the past 12 months Now married:
53.6% (1,297)Unmarried:
46.4% (1,124)
Marital status - Hispanic or Latino population 15 years and over
Males 49.2% Never married39.6% Now married1.8% Separated1.5% Widowed8.0% DivorcedFemales 48.0% Never married45.7% Now married2.7% Separated0.0% Widowed3.6% DivorcedWomen who did not give birth in the past 12 months Now married:
39.5% (426)Unmarried:
60.5% (654)
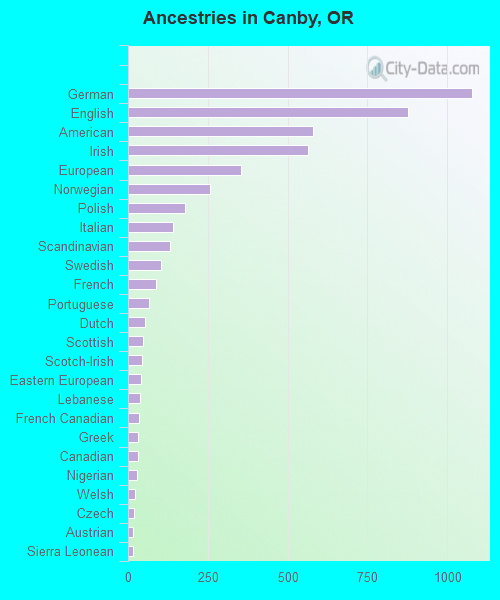
Ancestries in Canby
1,077 12.7% German877 10.3% English581 6.8% American565 6.7% Irish354 4.2% European258 3.0% Norwegian180 2.1% Polish140 1.6% Italian131 1.5% Scandinavian103 1.2% Swedish87 1.0% French65 0.8% Portuguese53 0.6% Dutch48 0.6% Scottish45 0.5% Scotch-Irish41 0.5% Eastern European37 0.4% Lebanese36 0.4% French Canadian32 0.4% Greek31 0.4% Canadian27 0.3% Nigerian23 0.3% Welsh18 0.2% Czech15 0.2% Austrian15 0.2% Sierra Leonean13 0.2% Danish10 0.1% Finnish10 0.1% Slovene9 0.1% Lithuanian8 0.09% Russian8 0.09% Iranian6 0.07% Belgian6 0.07% African6 0.07% Swiss5 0.06% British
Geographical mobility in Canby Same house 1 year ago 12,470 88.0% White (Caucasian)86 91.2% Black or African American62 53.3% American Indian / Alaska Native398 95.9% Asian1,232 82.4% Other race1,743 90.2% Two or more races11,501 87.9% White alone, not Hispanic / Latino3,048 88.3% Hispanic or LatinoMoved within same county 621 4.4% White / Caucasian8 8.3% Black or African American7 5.8% American Indian / Alaska Native55 3.7% Other race50 2.6% Two or more races619 4.7% White alone, not Hispanic / Latino65 1.9% Hispanic or LatinoMoved within same state 648 4.6% White / Caucasian1 0.9% Black or African American58 49.4% American Indian / Alaska Native178 11.9% Other race67 3.5% Two or more races680 5.2% White alone, not Hispanic / Latino216 6.3% Hispanic or LatinoMoved from different state 162 1.1% White / Caucasian16 3.8% Asian79 4.1% Two or more races166 1.3% White alone, not Hispanic / LatinoMoved from abroad 218 1.5% White14 0.1% White alone, not Hispanic / Latino174 5.0% Hispanic or Latino
Children Nativity (place of birth) in Canby
Children under 6 years - Living with two parents Both parents native 781 100.0% NativeBoth parents foreign-born 13 100.0% NativeOne native, one foreign-born parent 25 100.0% NativeChildren under 6 years - Living with one parent Native parent 133 100.0% NativeForeign-born parent 16 100.0% NativeChildren 6 to 17 years - Living with two parents Both parents native 1,806 100.0% NativeBoth parents foreign-born 80 100.0% NativeOne native, one foreign-born parent 153 100.0% NativeChildren 6 to 17 years - Living with one parent Native parent 600 100.0% NativeForeign-born parent 87 47.4% Native97 52.6% Foreign-born
Grandparents responsible for own grandchildren in Canby
Grandparents (30 to 59 years) White / Caucasian 25 20.2% Responsible for grandchildren100 79.8% Not responsible for grandchildrenWhite alone, not Hispanic / Latino 25 42.2% Responsible for grandchildren35 57.8% Not responsible for grandchildrenHispanic or Latino 36 100.0% Not responsible for grandchildrenGrandparents (60 years and over) White / Caucasian 114 43.0% Responsible for grandchildren152 57.0% Not responsible for grandchildrenWhite alone, not Hispanic / Latino 114 57.0% Responsible for grandchildren86 43.0% Not responsible for grandchildrenHispanic or Latino 81 100.0% Not responsible for grandchildren