Races in Camp Lake, Wisconsin (WI) Detailed Stats
Ancestries, Foreign-born residents, place of birth

Recent posts about races in Camp Lake, Wisconsin on our local forum with over 2,400,000 registered users:
 | leaving wisconsin survey (337 replies) |
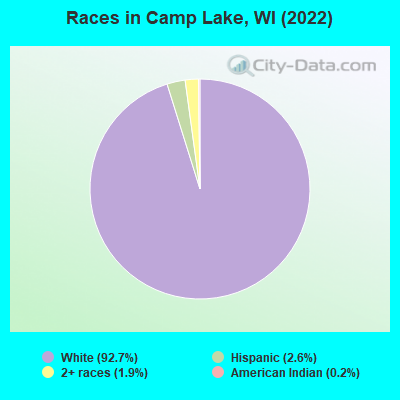
According to 2022 data, the most numerous races in Camp Lake, WI are White alone (3,874 residents), Hispanic (109 residents), and Black alone (0 residents). 95.9% of Camp Lake residents speak English at home. 0.4% of Camp Lake, WI residents are foreign-born , which is 1049.2% less than the foreign-born rate of 5.0% across the entire state of Wisconsin.
Race distribution in Camp Lake

2000
2022

- 4,681,63087.3%White alone
- 300,2455.6%Black alone
- 192,9213.6%Hispanic
- 87,9951.6%Asian alone
- 51,9211.0%Two or more races
- 43,9800.8%American Indian alone
- 3,6370.07%Other race alone
- 1,3460.03%Native Hawaiian and Other
Pacific Islander alone

-
- 4,654,03179.0%White alone
- 447,0227.6%Hispanic
- 345,6785.9%Black alone
- 217,5323.7%Two or more races
- 172,2422.9%Asian alone
- 33,7620.6%American Indian alone
- 19,6800.3%Other race alone
- 2,5920.04%Native Hawaiian and Other
Pacific Islander alone

Income and house value in Camp Lake
- Median household income in 2022
- $87,436White non-Hispanic householders
- $128,043American Indian and Alaska Native householders
- $86,033Some other race householders
- $26,055Two or more races householders
- $83,023Hispanic or Latino race householders
- Median 2022 house value
- $258,126White Non-Hispanic householders
- $214,213American Indian or Alaska Native householders
- $203,502Some other race householders
- $294,543Two or more races householders
- $182,081Hispanic or Latino householders
Household income for White non-Hispanic householders

Household income for Hispanic or Latino race householders

Median age by race in Camp Lake
- 33.7Median age for White residents
- 35.4Males
- 32.9Females
- 9.5Median age for Other race residents
- 63.5Median age for Two or more races residents
- 33.3Median age for White alone residents
- 36.1Males
- 33.0Females
- 37.0Median age for Hispanic or Latino residents
- 20.0Males
- 40.4Females
Owner/renter occupied households by race in Camp Lake
- House owners and renters - White residents
- 1,05578.2%Owner occupied
- 29421.8%Renter occupied
- House owners and renters - Other race residents
- 12100.0%Owner occupied
- House owners and renters - Two or more races residents
- 58100.0%Renter occupied
- House owners and renters - White alone residents
- 1,05077.6%Owner occupied
- 30422.4%Renter occupied
- House owners and renters - Hispanic or Latino residents
- 31100.0%Owner occupied
Language usage in Camp Lake
- English speakers - Total
- 95.9% of residents of Camp Lake speak English at home.
- 0.7% of residents speak Spanish at home
- 28100.0%Speak English very well
- 3.1% of residents speak other language at home
- 119100.0%Speak English very well
- English speakers - Born in the United States
- 96.3% of residents of Camp Lake speak English at home.
- 1.2% of residents speak Spanish at home
- 26100.0%Speak English very well
- 3.6% of residents speak other language at home
- 77100.0%Speak English very well
All residents speak only English at home
- English speakers - Foreign-born
- 91.7% of residents of Camp Lake speak English at home.
White (Caucasian) - Speak only English
| Native: | 99.1% (3,414) |
| Foreign-born: | 96.1% (17) |
White alone - Speak only English
| Native: | 97.3% (3,416) |
| Foreign-born: | 100.0% (18) |
Foreign-born residents in Camp Lake
18 residents are foreign born
| This city: | 0.4% |
| Wisconsin: | 100.0% |


Marital status for residents in Camp Lake
Marital status - White (Caucasian) population 15 years and over
- Males
- 38.6%Never married
- 51.6%Now married
- 1.6%Separated
- 0.6%Widowed
- 7.5%Divorced
- Females
- 38.1%Never married
- 47.1%Now married
- 2.3%Separated
- 3.3%Widowed
- 9.1%Divorced
Women who gave birth in the past 12 months
| Now married: | 15.1% (22) |
| Unmarried: | 84.9% (125) |
Women who did not give birth in the past 12 months
| Now married: | 46.0% (476) |
| Unmarried: | 54.0% (560) |
Marital status - White alone, not Hispanic / Latino population 15 years and over
- Males
- 38.4%Never married
- 51.7%Now married
- 1.6%Separated
- 0.6%Widowed
- 7.6%Divorced
- Females
- 38.5%Never married
- 46.6%Now married
- 2.3%Separated
- 3.3%Widowed
- 9.2%Divorced
Women who gave birth in the past 12 months
| Now married: | 15.1% (23) |
| Unmarried: | 84.9% (127) |
Women who did not give birth in the past 12 months
| Now married: | 45.1% (468) |
| Unmarried: | 54.9% (569) |
Marital status - Hispanic or Latino population 15 years and over
- Males
- 41.9%Never married
- 58.1%Now married
- 0.0%Separated
- 0.0%Widowed
- 0.0%Divorced
- Females
- 0.0%Never married
- 100.0%Now married
- 0.0%Separated
- 0.0%Widowed
- 0.0%Divorced
Women who did not give birth in the past 12 months
| Now married: | 100.0% (43) |
| Unmarried: | 0.0% (0) |
Ancestries in Camp Lake

- 74347.4%German
- 1026.5%Polish
- 966.1%Irish
- 895.7%American
- 835.3%Scottish
- 483.1%Czech
- 291.9%English
- 261.7%Norwegian
- 181.1%Czechoslovakian
- 171.1%Dutch
- 151.0%Italian
- 140.9%Russian
- 130.8%Welsh
- 120.8%French Canadian
- 110.7%Croatian
- 110.7%Swiss
- 80.5%French

Geographical mobility in Camp Lake

- Same house 1 year ago
- 3,15786.6%White (Caucasian)
- 12100.0%American Indian / Alaska Native
- 899.5%Other race
- 9156.0%Two or more races
- 3,19987.5%White alone, not Hispanic / Latino
- 111100.0%Hispanic or Latino

-
- Moved within same county
- 892.4%White / Caucasian
- 952.6%White alone, not Hispanic / Latino

-
- Moved within same state
- 1273.5%White / Caucasian
- 942.6%White alone, not Hispanic / Latino

-
- Moved from different state
- 3469.5%White / Caucasian
- 6640.5%Two or more races
- 2978.1%White alone, not Hispanic / Latino

-
- Moved from abroad
- 210.6%White
- 120.3%White alone, not Hispanic / Latino

Children Nativity (place of birth) in Camp Lake
Place of birth for residents in Camp Lake
![Place of birth for the foreign-born population - Regions]()
- 18Europe
- 18Eastern Europe

Grandparents responsible for own grandchildren in Camp Lake
Zip codes: 53179.