Races in Cambridge, Massachusetts (MA) Detailed Stats
Data:
Races - White alone (%)
Races - White alone (% change since 2000)
Races - Black alone (%)
Races - Black alone (% change since 2000)
Races - American Indian alone (%)
Races - American Indian alone (% change since 2000)
Races - Asian alone (%)
Races - Asian alone (% change since 2000)
Races - Hispanic (%)
Races - Hispanic (% change since 2000)
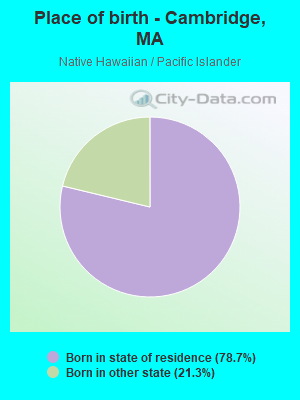
Races - Native Hawaiian and Other Pacific Islander alone (%)
Races - Native Hawaiian and Other Pacific Islander alone (% change since 2000)
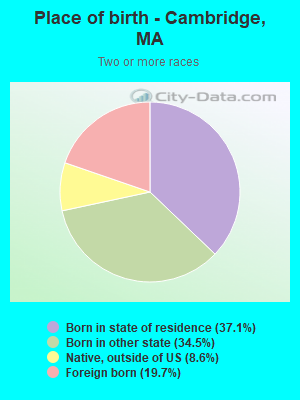
Races - Two or more races(%)
Races - Two or more races(% change since 2000)
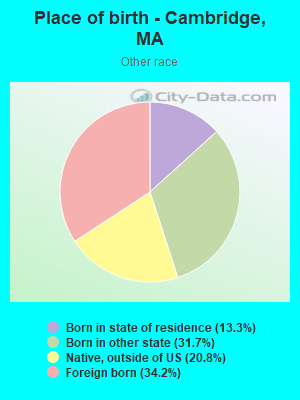
Races - Other race alone (%)
Races - Other race alone (% change since 2000)
Racial diversity
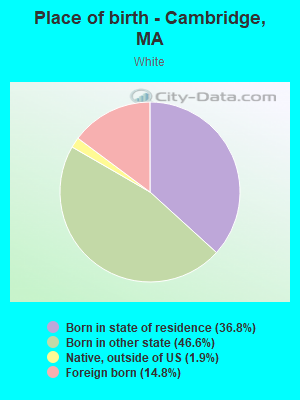
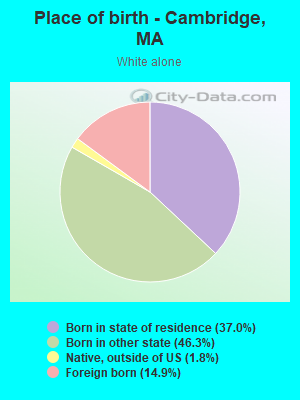
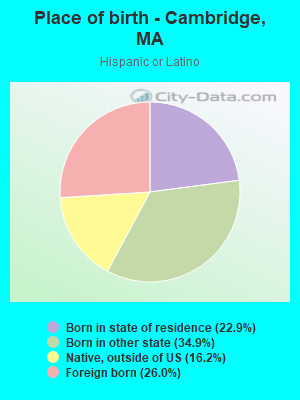
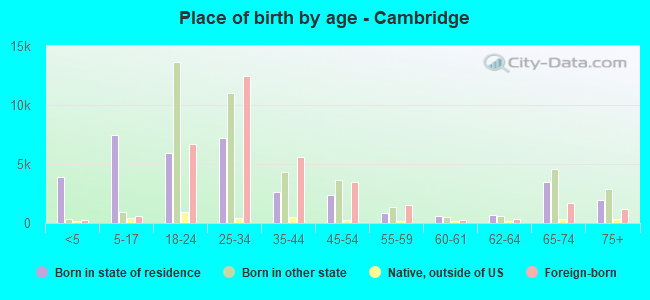
Place of birth - Born in state of residence (%)
Place of birth - Born in state of residence (%) - White
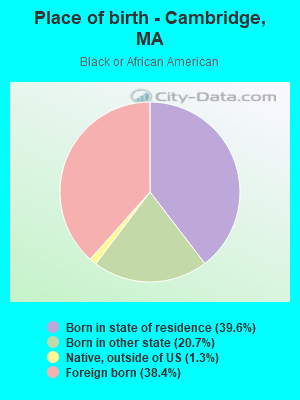
Place of birth - Born in state of residence (%) - Black or African American
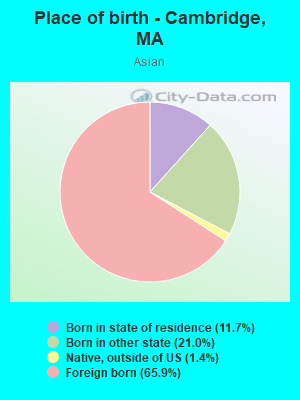
Place of birth - Born in state of residence (%) - Asian
Place of birth - Born in state of residence (%) - Hispanic or Latino
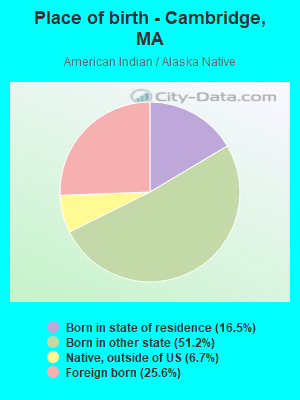
Place of birth - Born in state of residence (%) - American Indian and Alaska Native
Place of birth - Born in state of residence (%) - Multirace
Place of birth - Born in state of residence (%) - Other Race
Place of birth - Born in other state (%)
Place of birth - Born in other state (%) - White
Place of birth - Born in other state (%) - Black or African American
Place of birth - Born in other state (%) - Asian
Place of birth - Born in other state (%) - Hispanic or Latino
Place of birth - Born in other state (%) - American Indian and Alaska Native
Place of birth - Born in other state (%) - Multirace
Place of birth - Born in other state (%) - Other Race
Place of birth - Native, outside of US (%)
Place of birth - Native, outside of US (%) - White
Place of birth - Native, outside of US (%) - Black or African American
Place of birth - Native, outside of US (%) - Asian
Place of birth - Native, outside of US (%) - Hispanic or Latino
Place of birth - Native, outside of US (%) - American Indian and Alaska Native
Place of birth - Native, outside of US (%) - Multirace
Place of birth - Native, outside of US (%) - Other Race
Place of birth - Foreign born (%)
Place of birth - Foreign born (%) - White
Place of birth - Foreign born (%) - Black or African American
Place of birth - Foreign born (%) - Asian
Place of birth - Foreign born (%) - Hispanic or Latino
Place of birth - Foreign born (%) - American Indian and Alaska Native
Place of birth - Foreign born (%) - Multirace
Place of birth - Foreign born (%) - Other Race
Residents speaking English at home (%)
Residents speaking English at home - Born in the United States (%)
Residents speaking English at home - Native, born elsewhere (%)
Residents speaking English at home - Foreign born (%)
Residents speaking Spanish at home (%)
Residents speaking Spanish at home - Born in the United States (%)
Residents speaking Spanish at home - Native, born elsewhere (%)
Residents speaking Spanish at home - Foreign born (%)
Residents speaking other language at home (%)
Residents speaking other language at home - Born in the United States (%)
Residents speaking other language at home - Native, born elsewhere (%)
Residents speaking other language at home - Foreign born (%)
Marital status - Never married (%)
Marital status - Now married (%)
Marital status - Separated (%)
Marital status - Widowed (%)
Marital status - Divorced (%)
Ancestries Reported - Arab (%)
Ancestries Reported - Czech (%)
Ancestries Reported - Danish (%)
Ancestries Reported - Dutch (%)
Ancestries Reported - English (%)
Ancestries Reported - French (%)
Ancestries Reported - French Canadian (%)
Ancestries Reported - German (%)
Ancestries Reported - Greek (%)
Ancestries Reported - Hungarian (%)
Ancestries Reported - Irish (%)
Ancestries Reported - Italian (%)
Ancestries Reported - Lithuanian (%)
Ancestries Reported - Norwegian (%)
Ancestries Reported - Polish (%)
Ancestries Reported - Portuguese (%)
Ancestries Reported - Russian (%)
Ancestries Reported - Scotch-Irish (%)
Ancestries Reported - Scottish (%)
Ancestries Reported - Slovak (%)
Ancestries Reported - Subsaharan African (%)
Ancestries Reported - Swedish (%)
Ancestries Reported - Swiss (%)
Ancestries Reported - Ukrainian (%)
Ancestries Reported - United States (%)
Ancestries Reported - Welsh (%)
Ancestries Reported - West Indian (%)
Ancestries Reported - Other (%)
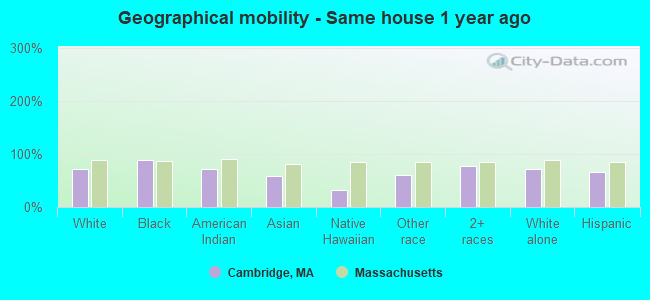
Geographical mobility - Same house 1 year ago (%)
Geographical mobility - Same house 1 year ago (%) - White
Geographical mobility - Same house 1 year ago (%) - Black or African American
Geographical mobility - Same house 1 year ago (%) - Asian
Geographical mobility - Same house 1 year ago (%) - Hispanic or Latino
Geographical mobility - Same house 1 year ago (%) - American Indian and Alaska Native
Geographical mobility - Same house 1 year ago (%) - Multirace
Geographical mobility - Same house 1 year ago (%) - Other Race
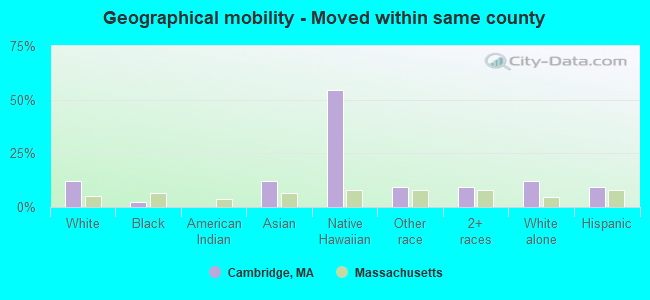
Geographical mobility - Moved within same county (%)
Geographical mobility - Moved within same county (%) - White
Geographical mobility - Moved within same county (%) - Black or African American
Geographical mobility - Moved within same county (%) - Asian
Geographical mobility - Moved within same county (%) - Hispanic or Latino
Geographical mobility - Moved within same county (%) - American Indian and Alaska Native
Geographical mobility - Moved within same county (%) - Multirace
Geographical mobility - Moved within same county (%) - Other Race
Geographical mobility - Moved from different county within same state (%)
Geographical mobility - Moved from different county within same state (%) - White
Geographical mobility - Moved from different county within same state (%) - Black or African American
Geographical mobility - Moved from different county within same state (%) - Asian
Geographical mobility - Moved from different county within same state (%) - Hispanic or Latino
Geographical mobility - Moved from different county within same state (%) - American Indian and Alaska Native
Geographical mobility - Moved from different county within same state (%) - Multirace
Geographical mobility - Moved from different county within same state (%) - Other Race
Geographical mobility - Moved from different state (%)
Geographical mobility - Moved from different state (%) - White
Geographical mobility - Moved from different state (%) - Black or African American
Geographical mobility - Moved from different state (%) - Asian
Geographical mobility - Moved from different state (%) - Hispanic or Latino
Geographical mobility - Moved from different state (%) - American Indian and Alaska Native
Geographical mobility - Moved from different state (%) - Multirace
Geographical mobility - Moved from different state (%) - Other Race
Geographical mobility - Moved from abroad (%)
Geographical mobility - Moved from abroad (%) - White
Geographical mobility - Moved from abroad (%) - Black or African American
Geographical mobility - Moved from abroad (%) - Asian
Geographical mobility - Moved from abroad (%) - Hispanic or Latino
Geographical mobility - Moved from abroad (%) - American Indian and Alaska Native
Geographical mobility - Moved from abroad (%) - Multirace
Geographical mobility - Moved from abroad (%) - Other Race
Place of birth for the foreign-born population - Ireland (%)
Place of birth for the foreign-born population - Denmark (%)
Place of birth for the foreign-born population - Norway (%)
Place of birth for the foreign-born population - Sweden (%)
Place of birth for the foreign-born population - United Kingdom (%)
Place of birth for the foreign-born population - England (%)
Place of birth for the foreign-born population - Scotland (%)
Place of birth for the foreign-born population - Other Northern Europe (%)
Place of birth for the foreign-born population - Austria (%)
Place of birth for the foreign-born population - Belgium (%)
Place of birth for the foreign-born population - France (%)
Place of birth for the foreign-born population - Germany (%)
Place of birth for the foreign-born population - Netherlands (%)
Place of birth for the foreign-born population - Switzerland (%)
Place of birth for the foreign-born population - Other Western Europe (%)
Place of birth for the foreign-born population - Greece (%)
Place of birth for the foreign-born population - Italy (%)
Place of birth for the foreign-born population - Portugal (%)
Place of birth for the foreign-born population - Spain (%)
Place of birth for the foreign-born population - Other Southern Europe (%)
Place of birth for the foreign-born population - Albania (%)
Place of birth for the foreign-born population - Belarus (%)
Place of birth for the foreign-born population - Bosnia and Herzegovina (%)
Place of birth for the foreign-born population - Bulgaria (%)
Place of birth for the foreign-born population - Croatia (%)
Place of birth for the foreign-born population - Czechoslovakia (%)
Place of birth for the foreign-born population - Hungary (%)
Place of birth for the foreign-born population - Latvia (%)
Place of birth for the foreign-born population - Lithuania (%)
Place of birth for the foreign-born population - North Macedonia (Macedonia) (%)
Place of birth for the foreign-born population - Moldova (%)
Place of birth for the foreign-born population - Poland (%)
Place of birth for the foreign-born population - Romania (%)
Place of birth for the foreign-born population - Russia (%)
Place of birth for the foreign-born population - Serbia (%)
Place of birth for the foreign-born population - Ukraine (%)
Place of birth for the foreign-born population - Other Eastern Europe (%)
Place of birth for the foreign-born population - China (%)
Place of birth for the foreign-born population - Hong Kong (%)
Place of birth for the foreign-born population - Taiwan (%)
Place of birth for the foreign-born population - Japan (%)
Place of birth for the foreign-born population - Korea (%)
Place of birth for the foreign-born population - Other Eastern Asia (%)
Place of birth for the foreign-born population - Afghanistan (%)
Place of birth for the foreign-born population - Bangladesh (%)
Place of birth for the foreign-born population - India (%)
Place of birth for the foreign-born population - Iran (%)
Place of birth for the foreign-born population - Kazakhstan (%)
Place of birth for the foreign-born population - Nepal (%)
Place of birth for the foreign-born population - Pakistan (%)
Place of birth for the foreign-born population - Sri Lanka (%)
Place of birth for the foreign-born population - Uzbekistan (%)
Place of birth for the foreign-born population - Other South Central Asia (%)
Place of birth for the foreign-born population - Burma (%)
Place of birth for the foreign-born population - Cambodia (%)
Place of birth for the foreign-born population - Indonesia (%)
Place of birth for the foreign-born population - Laos (%)
Place of birth for the foreign-born population - Malaysia (%)
Place of birth for the foreign-born population - Philippines (%)
Place of birth for the foreign-born population - Singapore (%)
Place of birth for the foreign-born population - Thailand (%)
Place of birth for the foreign-born population - Vietnam (%)
Place of birth for the foreign-born population - Other South Eastern Asia (%)
Place of birth for the foreign-born population - Armenia (%)
Place of birth for the foreign-born population - Iraq (%)
Place of birth for the foreign-born population - Israel (%)
Place of birth for the foreign-born population - Jordan (%)
Place of birth for the foreign-born population - Kuwait (%)
Place of birth for the foreign-born population - Lebanon (%)
Place of birth for the foreign-born population - Saudi Arabia (%)
Place of birth for the foreign-born population - Syria (%)
Place of birth for the foreign-born population - Turkey (%)
Place of birth for the foreign-born population - Yemen (%)
Place of birth for the foreign-born population - Other Western Asia (%)
Place of birth for the foreign-born population - Eritrea (%)
Place of birth for the foreign-born population - Ethiopia (%)
Place of birth for the foreign-born population - Kenya (%)
Place of birth for the foreign-born population - Somalia (%)
Place of birth for the foreign-born population - Uganda (%)
Place of birth for the foreign-born population - Zimbabwe (%)
Place of birth for the foreign-born population - Other Eastern Africa (%)
Place of birth for the foreign-born population - Cameroon (%)
Place of birth for the foreign-born population - Congo (%)
Place of birth for the foreign-born population - Democratic Republic of Congo (Zaire) (%)
Place of birth for the foreign-born population - Other Middle Africa (%)
Place of birth for the foreign-born population - Egypt (%)
Place of birth for the foreign-born population - Morocco (%)
Place of birth for the foreign-born population - Sudan (%)
Place of birth for the foreign-born population - Other Northern Africa (%)
Place of birth for the foreign-born population - South Africa (%)
Place of birth for the foreign-born population - Other Southern Africa (%)
Place of birth for the foreign-born population - Cabo Verde (%)
Place of birth for the foreign-born population - Ghana (%)
Place of birth for the foreign-born population - Liberia (%)
Place of birth for the foreign-born population - Nigeria (%)
Place of birth for the foreign-born population - Senegal (%)
Place of birth for the foreign-born population - Sierra Leone (%)
Place of birth for the foreign-born population - Other Western Africa (%)
Place of birth for the foreign-born population - Australia (%)
Place of birth for the foreign-born population - New Zealand (%)
Place of birth for the foreign-born population - Fiji (%)
Place of birth for the foreign-born population - Micronesia (%)
Place of birth for the foreign-born population - Bahamas (%)
Place of birth for the foreign-born population - Barbados (%)
Place of birth for the foreign-born population - Cuba (%)
Place of birth for the foreign-born population - Dominica (%)
Place of birth for the foreign-born population - Dominican Republic (%)
Place of birth for the foreign-born population - Grenada (%)
Place of birth for the foreign-born population - Haiti (%)
Place of birth for the foreign-born population - Jamaica (%)
Place of birth for the foreign-born population - St. Vincent and the Grenadines (%)
Place of birth for the foreign-born population - Trinidad and Tobago (%)
Place of birth for the foreign-born population - West Indies (%)
Place of birth for the foreign-born population - Other Caribbean (%)
Place of birth for the foreign-born population - Belize (%)
Place of birth for the foreign-born population - Costa Rica (%)
Place of birth for the foreign-born population - El Salvador (%)
Place of birth for the foreign-born population - Guatemala (%)
Place of birth for the foreign-born population - Honduras (%)
Place of birth for the foreign-born population - Mexico (%)
Place of birth for the foreign-born population - Nicaragua (%)
Place of birth for the foreign-born population - Panama (%)
Place of birth for the foreign-born population - Other Central America (%)
Place of birth for the foreign-born population - Argentina (%)
Place of birth for the foreign-born population - Bolivia (%)
Place of birth for the foreign-born population - Brazil (%)
Place of birth for the foreign-born population - Chile (%)
Place of birth for the foreign-born population - Colombia (%)
Place of birth for the foreign-born population - Ecuador (%)
Place of birth for the foreign-born population - Guyana (%)
Place of birth for the foreign-born population - Peru (%)
Place of birth for the foreign-born population - Uruguay (%)
Place of birth for the foreign-born population - Venezuela (%)
Place of birth for the foreign-born population - Other South America (%)
Place of birth for the foreign-born population - Canada (%)
Place of birth for the foreign-born population - Other Northern America (%)
Place of birth for the foreign-born population - Other (%)
Latest news about races in Cambridge, MA collected exclusively by city-data.com from local newspapers, TV, and radio stations
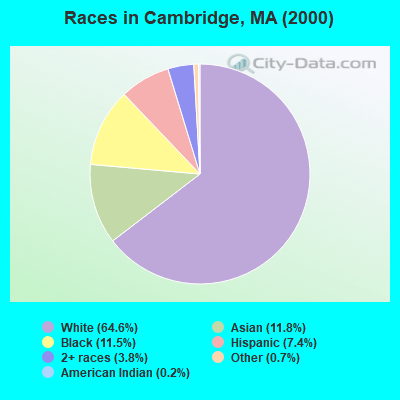
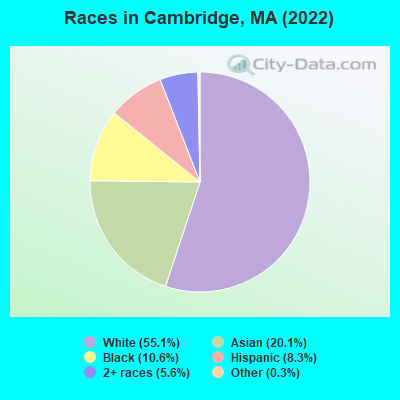
According to 2022 data, the most numerous races in Cambridge, MA are White alone (65,238 residents), Hispanic (9,785 residents), and Asian alone (23,774 residents). 64.5% of Cambridge residents speak English at home. 30.6% of Cambridge, MA residents are foreign-born (14.0% born in Asia, 6.3% born in Europe, 5.2% born in Latin America), which is 41.1% greater than the foreign-born rate of 18.0% across the entire state of Massachusetts.
Race distribution in Cambridge
2000 2022
65,425 64.6% White alone 11,984 11.8% Asian alone 11,627 11.5% Black alone 7,455 7.4% Hispanic 3,867 3.8% Two or more races 713 0.7% Other race alone 213 0.2% American Indian alone 71 0.07% Native Hawaiian and Other
65,238 55.1% White alone 23,774 20.1% Asian alone 12,609 10.6% Black alone 9,785 8.3% Hispanic 6,672 5.6% Two or more races 332 0.3% Other race alone 59 0.05% Native Hawaiian and Other 20 0.02% American Indian alone
2000 2022
5,198,359 81.9% White alone 428,729 6.8% Hispanic 318,329 5.0% Black alone 236,786 3.7% Asian alone 110,338 1.7% Two or more races 43,586 0.7% Other race alone 11,264 0.2% American Indian alone 1,706 0.03% Native Hawaiian and Other
4,676,627 67.0% White alone 911,038 13.0% Hispanic 501,463 7.2% Asian alone 459,740 6.6% Black alone 341,889 4.9% Two or more races 84,403 1.2% Other race alone 5,838 0.08% American Indian alone 976 0.01% Native Hawaiian and Other
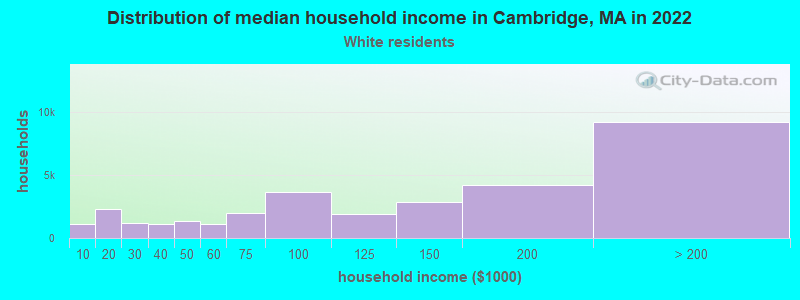
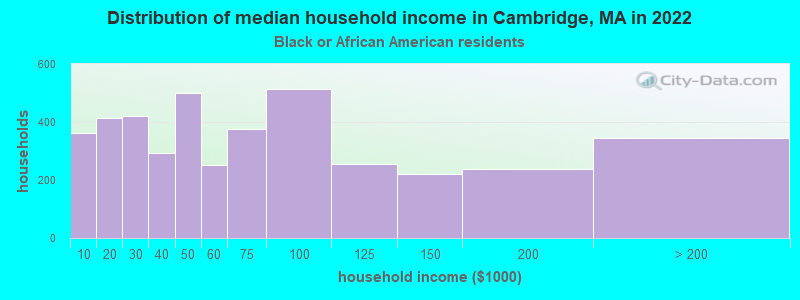
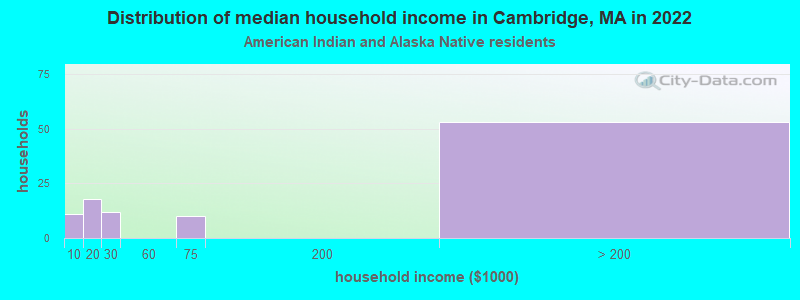
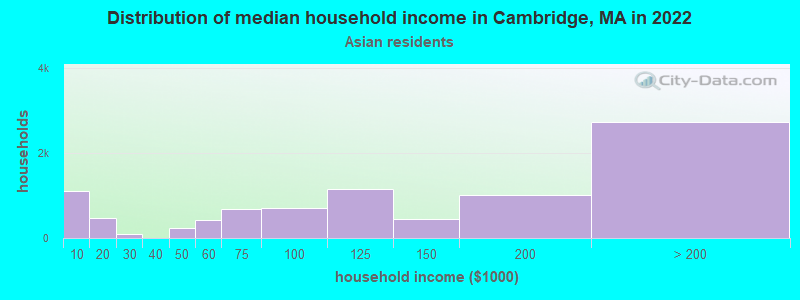
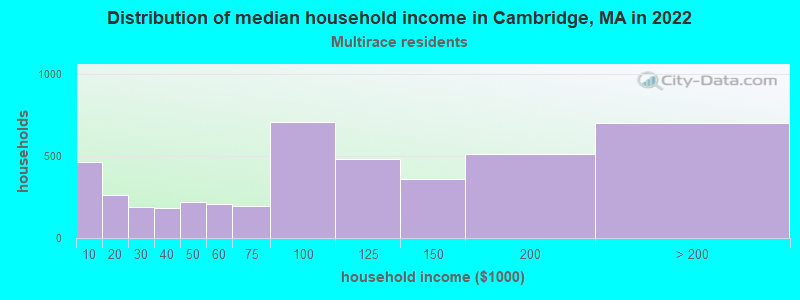
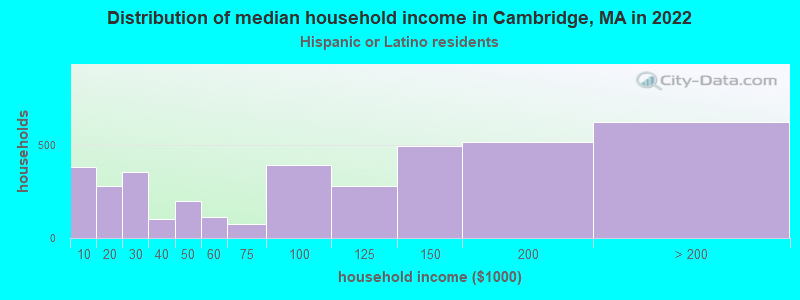
Income and house value in Cambridge Median household income in 2022 $126,355 White non-Hispanic householders$39,173 Black householders$112,045 Asian householders$78,709 Some other race householders$75,667 Two or more races householders$105,314 Hispanic or Latino race householdersMedian 2022 house value over $1,000,000 White Non-Hispanic householders$853,455 Black or African American householders$760,823 American Indian or Alaska Native householders $875,687 Asian householders$754,030 Some other race householders$871,056 Two or more races householders$955,351 Hispanic or Latino householders
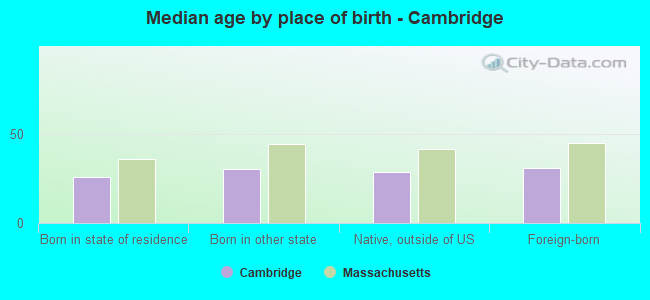
Median age by race in Cambridge
32.0 Median age for White residents31.8 32.4 28.0 Median age for Black or African American residents24.5 33.2 38.2 Median age for American Indian / Alaska Native residents19.3 -666,666,666.0 26.9 Median age for Asian residents27.6 26.6 -666,666,666.0 Median age for Native Hawaiian / Pacific Islander residents-666,666,666.0 -666,666,666.0 30.1 Median age for Other race residents29.0 34.9 24.3 Median age for Two or more races residents23.6 24.8 32.3 Median age for White alone residents31.9 32.7 26.5 Median age for Hispanic or Latino residents25.5 27.3
Owner/renter occupied households by race in Cambridge
House owners and renters - White residents 13,497 42.3% Owner occupied18,387 57.7% Renter occupiedHouse owners and renters - Black or African American residents 791 16.9% Owner occupied3,879 83.1% Renter occupiedHouse owners and renters - American Indian / Alaska Native residents 24 29.1% Owner occupied59 70.9% Renter occupiedHouse owners and renters - Asian residents 1,986 21.9% Owner occupied7,076 78.1% Renter occupiedHouse owners and renters - Native Hawaiian / Pacific Islander residents 8 47.8% Owner occupied9 52.2% Renter occupiedHouse owners and renters - Other race residents 86 5.5% Owner occupied1,477 94.5% Renter occupiedHouse owners and renters - Two or more races residents 750 21.4% Owner occupied2,748 78.6% Renter occupiedHouse owners and renters - White alone residents 13,245 42.7% Owner occupied17,747 57.3% Renter occupiedHouse owners and renters - Hispanic or Latino residents 446 11.3% Owner occupied3,513 88.7% Renter occupied
Language usage in Cambridge
English speakers - Total 64.5% of residents of Cambridge speak English at home.
6.0% of residents speak Spanish at home 5,479 80.6% Speak English very well1,320 19.4% Speak English less than very well29.6% of residents speak other language at home 25,459 75.5% Speak English very well8,241 24.5% Speak English less than very well
English speakers - Born in the United States 85.6% of residents of Cambridge speak English at home.
3.9% of residents speak Spanish at home 1,479 86.7% Speak English very well227 13.3% Speak English less than very well10.5% of residents speak other language at home 4,154 91.0% Speak English very well413 9.0% Speak English less than very well
English speakers - Native, born elsewhere 42.4% of residents of Cambridge speak English at home.
40.7% of residents speak Spanish at home 788 58.3% Speak English very well564 41.7% Speak English less than very well16.8% of residents speak other language at home 502 89.8% Speak English very well57 10.2% Speak English less than very well
English speakers - Foreign-born 20.8% of residents of Cambridge speak English at home.
6.7% of residents speak Spanish at home 1,833 80.7% Speak English very well438 19.3% Speak English less than very well72.6% of residents speak other language at home 17,359 70.5% Speak English very well7,266 29.5% Speak English less than very well
White (Caucasian) - Speak only English Native:
91.8% (50,884)Foreign-born:
30.0% (2,928)
White (Caucasian) - Speak another language Native:
8.2% (4,549)Foreign-born:
70.0% (6,844)
Black or African American - Speak only English Native:
78.2% (5,442)Foreign-born:
15.1% (748)
Black or African American - Speak another language Native:
21.8% (1,516)Foreign-born:
84.9% (4,192)
American Indian / Alaska Native - Speak only English Native:
33.1% (33)Foreign-born:
10.9% (5)
American Indian / Alaska Native - Speak another language Native:
81.5% (82)Foreign-born:
97.8% (45)
Asian - Speak only English Native:
53.3% (3,913)Foreign-born:
17.5% (2,765)
Asian - Speak another language Native:
46.7% (3,423)Foreign-born:
82.5% (13,041)
Other race - Speak only English Native:
27.6% (578)Foreign-born:
9.1% (99)
Other race - Speak another language Native:
72.4% (1,517)Foreign-born:
90.9% (991)
Two or more races - Speak only English Native:
68.5% (5,541)Foreign-born:
23.0% (506)
Two or more races - Speak another language Native:
31.5% (2,544)Foreign-born:
77.0% (1,692)
White alone - Speak only English Native:
92.2% (49,813)Foreign-born:
30.5% (2,928)
White alone - Speak another language Native:
7.8% (4,221)Foreign-born:
69.5% (6,672)
Hispanic or Latino - Speak only English Native:
44.9% (3,188)Foreign-born:
7.8% (199)
Hispanic or Latino - Speak another language Native:
55.1% (3,909)Foreign-born:
92.2% (2,345)
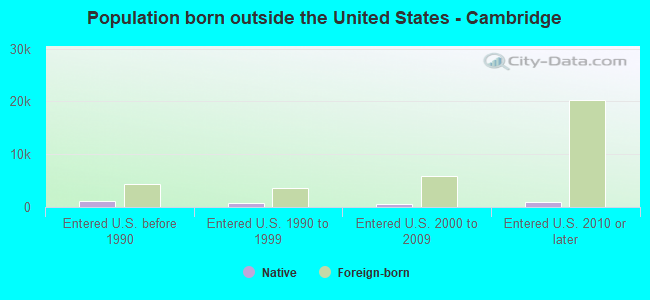
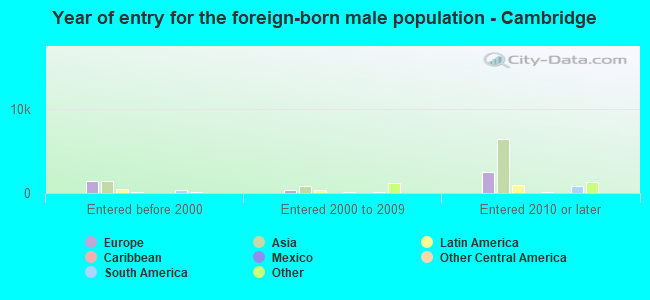
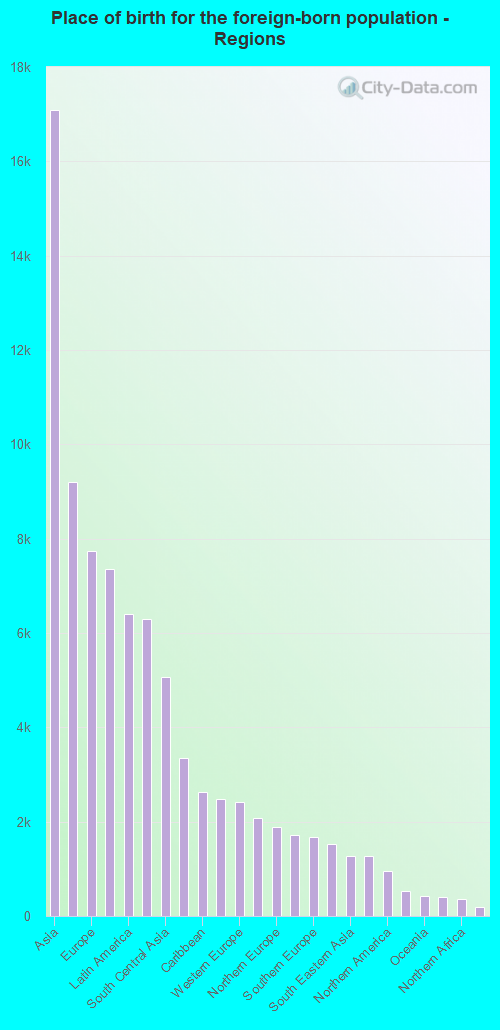
Foreign-born residents in Cambridge 35,937 residents are foreign born (14.0% Asia , 6.3% Europe , 5.2% Latin America ).
This city:
30.6%Massachusetts:
17.6%
Marital status for residents in Cambridge Marital status - White (Caucasian) population 15 years and over
Males 59.0% Never married31.4% Now married0.9% Separated1.9% Widowed6.8% DivorcedFemales 58.4% Never married29.8% Now married1.0% Separated3.9% Widowed7.0% DivorcedWomen who gave birth in the past 12 months Now married:
100.0% (614)Unmarried:
0.0% (0)
Women who did not give birth in the past 12 months Now married:
17.7% (3,456)Unmarried:
82.3% (16,022)
Marital status - Black or African American population 15 years and over
Males 58.5% Never married31.5% Now married0.8% Separated4.5% Widowed4.6% DivorcedFemales 50.2% Never married27.5% Now married5.5% Separated1.1% Widowed15.8% DivorcedWomen who gave birth in the past 12 months Now married:
4.8% (14)Unmarried:
95.2% (278)
Women who did not give birth in the past 12 months Now married:
27.2% (1,107)Unmarried:
72.8% (2,970)
Marital status - American Indian / Alaska Native population 15 years and over
Males 78.0% Never married0.0% Now married0.0% Separated0.0% Widowed22.0% DivorcedFemales 61.9% Never married3.2% Now married0.0% Separated15.9% Widowed19.0% DivorcedWomen who did not give birth in the past 12 months Now married:
4.9% (2)Unmarried:
95.1% (46)
Marital status - Asian population 15 years and over
Males 66.0% Never married32.3% Now married0.1% Separated0.7% Widowed0.9% DivorcedFemales 62.8% Never married32.5% Now married0.3% Separated2.3% Widowed2.2% DivorcedWomen who gave birth in the past 12 months Now married:
80.0% (168)Unmarried:
20.0% (42)
Women who did not give birth in the past 12 months Now married:
21.0% (2,136)Unmarried:
79.0% (8,028)
Marital status - Native Hawaiian / Pacific Islander population 15 years and over
Males 26.4% Never married73.6% Now married0.0% Separated0.0% Widowed0.0% DivorcedFemales 78.3% Never married21.7% Now married0.0% Separated0.0% Widowed0.0% DivorcedWomen who did not give birth in the past 12 months Now married:
21.7% (16)Unmarried:
78.3% (57)
Marital status - Other race population 15 years and over
Males 65.5% Never married27.8% Now married2.5% Separated0.0% Widowed4.2% DivorcedFemales 59.5% Never married16.0% Now married6.0% Separated2.2% Widowed16.4% DivorcedWomen who gave birth in the past 12 months Now married:
0.0% (0)Unmarried:
100.0% (7)
Women who did not give birth in the past 12 months Now married:
15.5% (162)Unmarried:
84.5% (886)
Marital status - Two or more races population 15 years and over
Males 63.2% Never married27.7% Now married0.0% Separated2.3% Widowed6.9% DivorcedFemales 66.7% Never married20.8% Now married1.0% Separated5.8% Widowed5.8% DivorcedWomen who gave birth in the past 12 months Now married:
100.0% (22)Unmarried:
0.0% (0)
Women who did not give birth in the past 12 months Now married:
23.9% (981)Unmarried:
76.1% (3,124)
Marital status - White alone, not Hispanic / Latino population 15 years and over
Males 58.6% Never married31.6% Now married1.0% Separated1.9% Widowed6.9% DivorcedFemales 57.4% Never married30.6% Now married1.0% Separated4.0% Widowed7.0% DivorcedWomen who gave birth in the past 12 months Now married:
100.0% (614)Unmarried:
0.0% (0)
Women who did not give birth in the past 12 months Now married:
18.5% (3,456)Unmarried:
81.5% (15,180)
Marital status - Hispanic or Latino population 15 years and over
Males 85.2% Never married8.8% Now married2.1% Separated2.6% Widowed1.4% DivorcedFemales 72.5% Never married12.7% Now married2.4% Separated4.1% Widowed8.3% DivorcedWomen who gave birth in the past 12 months Now married:
95.0% (116)Unmarried:
5.0% (6)
Women who did not give birth in the past 12 months Now married:
22.6% (770)Unmarried:
77.4% (2,637)
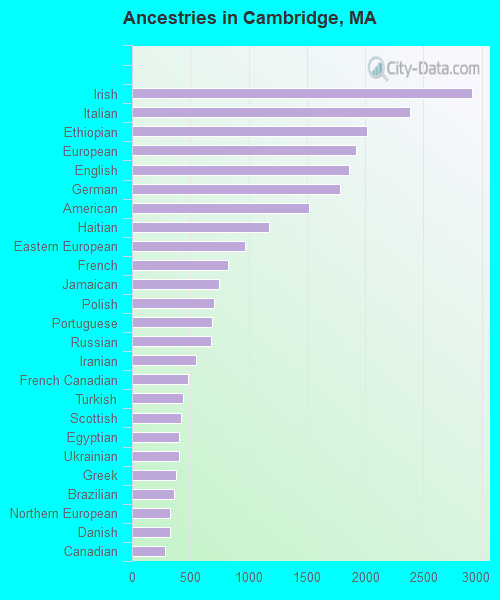
Ancestries in Cambridge
2,917 4.9% Irish2,385 4.0% Italian2,014 3.4% Ethiopian1,920 3.3% European1,859 3.2% English1,783 3.0% German1,516 2.6% American1,173 2.0% Haitian968 1.6% Eastern European826 1.4% French744 1.3% Jamaican702 1.2% Polish683 1.2% Portuguese680 1.2% Russian549 0.9% Iranian477 0.8% French Canadian438 0.7% Turkish422 0.7% Scottish405 0.7% Egyptian402 0.7% Ukrainian379 0.6% Greek362 0.6% Brazilian322 0.5% Northern European322 0.5% Danish280 0.5% Canadian257 0.4% Dutch249 0.4% British247 0.4% Swedish236 0.4% Armenian234 0.4% Nigerian226 0.4% Bulgarian225 0.4% Lebanese216 0.4% Cape Verdean202 0.3% Moroccan191 0.3% Albanian173 0.3% West Indian165 0.3% African150 0.3% Austrian149 0.3% Israeli140 0.2% Romanian139 0.2% Finnish130 0.2% Czech129 0.2% Swiss126 0.2% Norwegian104 0.2% Serbian88 0.1% Lithuanian80 0.1% Scotch-Irish79 0.1% Arab77 0.1% Trinidadian and Tobagonian73 0.1% Zimbabwean67 0.1% Iraqi66 0.1% Kenyan66 0.1% Latvian65 0.1% South African65 0.1% Syrian59 0.1% Barbadian56 0.09% Ugandan44 0.07% Belgian44 0.07% Macedonian43 0.07% Afghan42 0.07% Scandinavian40 0.07% Hungarian39 0.07% Cypriot35 0.06% Guyanese34 0.06% Palestinian33 0.06% Basque32 0.05% Welsh32 0.05% New Zealander26 0.04% Jordanian23 0.04% Slovene22 0.04% Australian22 0.04% Yugoslavian19 0.03% Slovak15 0.03% Icelander12 0.02% Czechoslovakian11 0.02% Assyrian8 0.01% Celtic7 0.01% Somali7 0.01% U.S. Virgin Islander6 0.01% British West Indian5 0.01% Croatian5 0.01% Sierra Leonean
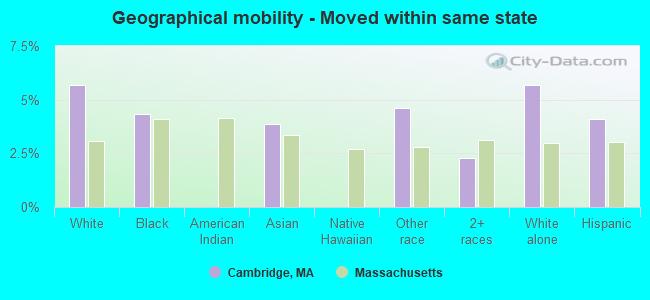
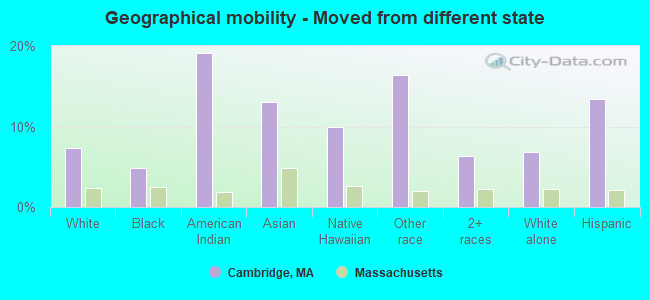
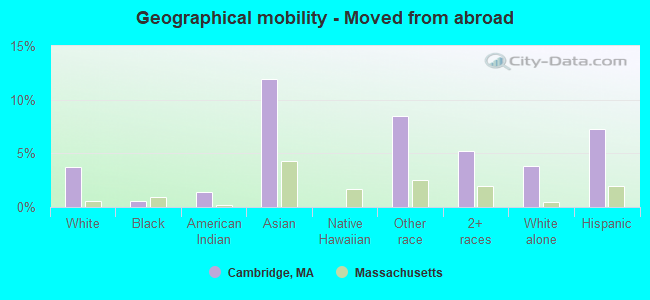
Geographical mobility in Cambridge Same house 1 year ago 47,205 71.3% White (Caucasian)10,934 87.9% Black or African American148 71.5% American Indian / Alaska Native14,259 59.2% Asian45 32.7% Native Hawaiian / Pacific Islander1,950 61.2% Other race8,465 76.7% Two or more races46,392 71.8% White alone, not Hispanic / Latino6,374 65.7% Hispanic or LatinoMoved within same county 7,885 11.9% White / Caucasian289 2.3% Black or African American2,897 12.0% Asian75 54.6% Native Hawaiian / Pacific Islander293 9.2% Other race1,037 9.4% Two or more races7,678 11.9% White alone, not Hispanic / Latino914 9.4% Hispanic or LatinoMoved within same state 3,760 5.7% White / Caucasian541 4.3% Black or African American927 3.8% Asian147 4.6% Other race253 2.3% Two or more races3,674 5.7% White alone, not Hispanic / Latino397 4.1% Hispanic or LatinoMoved from different state 4,882 7.4% White / Caucasian606 4.9% Black or African American40 19.1% American Indian / Alaska Native3,132 13.0% Asian14 9.9% Native Hawaiian / Pacific Islander524 16.5% Other race704 6.4% Two or more races4,417 6.8% White alone, not Hispanic / Latino1,304 13.4% Hispanic or LatinoMoved from abroad 2,474 3.7% White75 0.6% Black or African American3 1.4% American Indian / Alaska Native2,875 11.9% Asian271 8.5% Other race580 5.3% Two or more races2,474 3.8% White alone, not Hispanic / Latino707 7.3% Hispanic or Latino
Children Nativity (place of birth) in Cambridge
Children under 6 years - Living with two parents Both parents native 1,858 100.0% NativeBoth parents foreign-born 1,377 82.4% Native294 17.6% Foreign-bornOne native, one foreign-born parent 832 100.0% NativeChildren under 6 years - Living with one parent Native parent 193 100.0% NativeForeign-born parent 416 100.0% NativeChildren 6 to 17 years - Living with two parents Both parents native 3,174 100.0% NativeBoth parents foreign-born 1,373 83.4% Native274 16.6% Foreign-bornOne native, one foreign-born parent 684 100.0% NativeChildren 6 to 17 years - Living with one parent Native parent 1,552 100.0% NativeForeign-born parent 1,174 53.7% Native1,012 46.3% Foreign-born
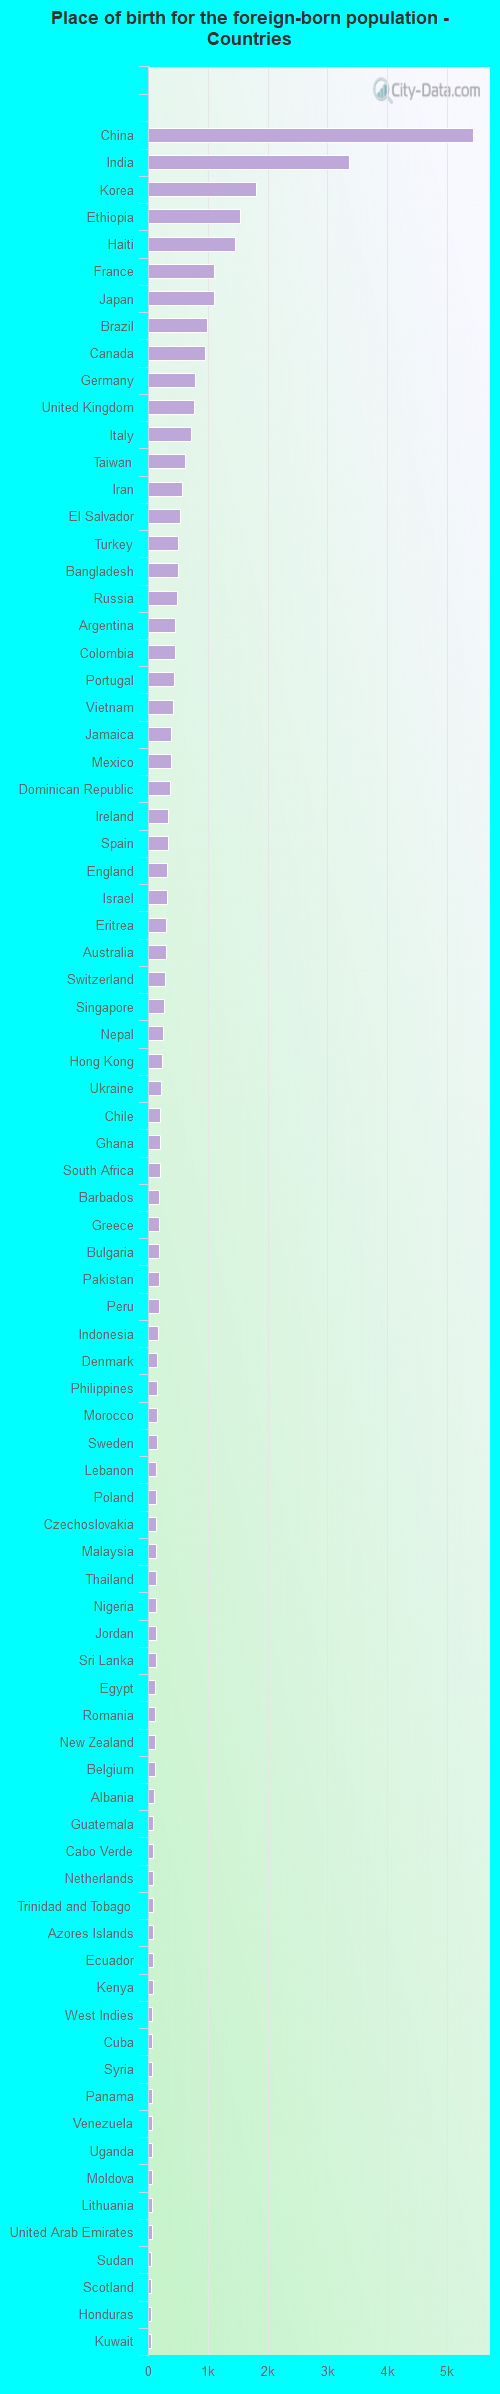
Place of birth for residents in Cambridge 17,089 Asia9,203 Eastern Asia7,728 Europe7,349 Americas6,398 Latin America6,294 China5,077 South Central Asia3,347 Africa2,637 Caribbean2,484 South America2,423 Western Europe2,078 Eastern Africa1,886 Northern Europe1,718 Eastern Europe1,676 Southern Europe1,521 Western Asia1,277 South Eastern Asia1,277 Central America951 Northern America521 Western Africa421 Oceania410 Australia and New Zealand Subregion352 Northern Africa195 Southern Africa85 Middle Africa5,435 China3,358 India1,805 Korea1,540 Ethiopia1,449 Haiti1,112 France1,102 Japan986 Brazil951 Canada789 Germany770 United Kingdom720 Italy621 Taiwan573 Iran538 El Salvador506 Turkey500 Bangladesh490 Russia459 Argentina451 Colombia436 Portugal416 Vietnam386 Jamaica383 Mexico368 Dominican Republic341 Ireland330 Spain316 England313 Israel306 Eritrea299 Australia280 Switzerland267 Singapore256 Nepal236 Hong Kong221 Ukraine207 Chile200 Ghana193 South Africa190 Barbados188 Greece183 Bulgaria183 Pakistan178 Peru162 Indonesia152 Denmark147 Philippines146 Morocco145 Sweden142 Lebanon140 Poland138 Czechoslovakia136 Malaysia130 Thailand129 Nigeria128 Jordan127 Sri Lanka118 Egypt113 Romania110 New Zealand109 Belgium102 Albania91 Guatemala88 Cabo Verde88 Netherlands84 Trinidad and Tobago81 Azores Islands79 Ecuador76 Kenya73 West Indies73 Cuba72 Syria67 Panama67 Venezuela65 Uganda63 Moldova62 Lithuania61 United Arab Emirates54 Sudan54 Scotland53 Honduras51 Kuwait43 Afghanistan42 Iraq42 Austria39 Zimbabwe38 Saudi Arabia35 Kazakhstan35 Hungary33 Georgia33 Armenia29 Belarus24 Costa Rica24 Norway23 Yemen20 Uruguay20 Senegal19 Croatia17 Cameroon16 Bosnia and Herzegovina15 Burma (Myanmar)12 Algeria11 Fiji10 St. Lucia10 Guyana9 North Macedonia (Macedonia)8 Nicaragua8 Tanzania7 Latvia7 Somalia5 Ivory Coast2 Serbia
Grandparents responsible for own grandchildren in Cambridge
Grandparents (30 to 59 years) White / Caucasian 24 100.0% Not responsible for grandchildrenBlack or African American 22 66.8% Responsible for grandchildren11 33.2% Not responsible for grandchildrenAsian 12 100.0% Not responsible for grandchildrenOther race 30 100.0% Not responsible for grandchildrenTwo or more races 5 100.0% Not responsible for grandchildrenWhite alone, not Hispanic / Latino 26 100.0% Not responsible for grandchildrenHispanic or Latino 3 27.7% Responsible for grandchildren9 72.3% Not responsible for grandchildrenGrandparents (60 years and over) White / Caucasian 6 3.6% Responsible for grandchildren161 96.4% Not responsible for grandchildrenBlack or African American 139 100.0% Not responsible for grandchildrenAsian 11 17.2% Responsible for grandchildren53 82.8% Not responsible for grandchildrenOther race 23 100.0% Not responsible for grandchildrenTwo or more races 164 100.0% Not responsible for grandchildrenWhite alone, not Hispanic / Latino 6 4.1% Responsible for grandchildren140 95.9% Not responsible for grandchildrenHispanic or Latino 85 100.0% Not responsible for grandchildren