Races in Calumet-Norvelt, Pennsylvania (PA) Detailed Stats
Ancestries, Foreign-born residents, place of birth

Discuss Calumet-Norvelt, Pennsylvania races on our local forum with over 2,400,000 registered users
0.7% of Calumet-Norvelt, PA residents are foreign-born , which is 881.2% less than the foreign-born rate of 7.0% across the entire state of Pennsylvania.
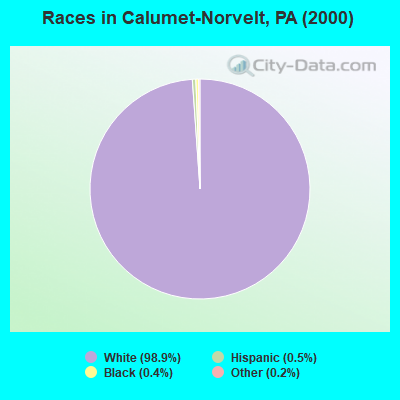
Race distribution in Calumet-Norvelt

- 1,66498.9%White alone
- 80.5%Hispanic
- 60.4%Black alone
- 30.2%Other race alone
- 10.06%Two or more races
2000
2022
-
- 10,322,45584.1%White alone
- 1,202,4379.8%Black alone
- 394,0883.2%Hispanic
- 218,2961.8%Asian alone
- 113,0970.9%Two or more races
- 13,0860.1%Other race alone
- 14,9040.1%American Indian alone
- 2,6910.02%Native Hawaiian and Other
Pacific Islander alone

-
- 9,487,22873.1%White alone
- 1,311,58110.1%Black alone
- 1,115,9978.6%Hispanic
- 493,9423.8%Two or more races
- 487,1243.8%Asian alone
- 63,5820.5%Other race alone
- 10,1300.08%American Indian alone
- 2,4240.02%Native Hawaiian and Other
Pacific Islander alone

Income and house value in Calumet-Norvelt
- Median household income in 2022
- $72,380White non-Hispanic householders
- $100,928Hispanic or Latino race householders
- Median 2022 house value
- $176,255White Non-Hispanic householders
- $358,019Hispanic or Latino householders
Household income for White non-Hispanic householders

Household income for Hispanic or Latino race householders

Foreign-born residents in Calumet-Norvelt
12 residents are foreign born
| This city: | 0.7% |
| Pennsylvania: | 4.1% |
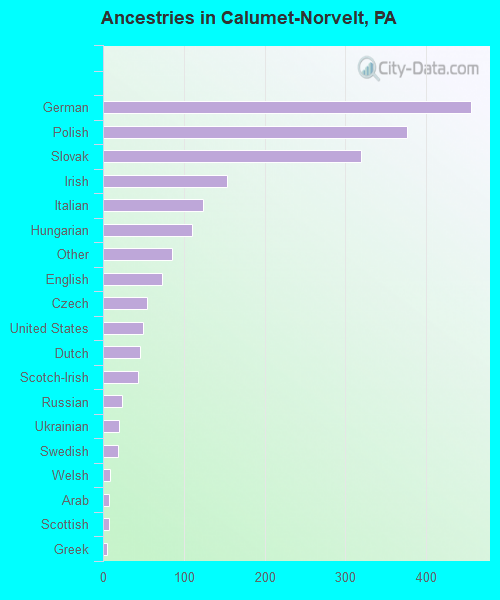
Ancestries in Calumet-Norvelt

- 45523.0%German
- 37619.0%Polish
- 31916.1%Slovak
- 1537.7%Irish
- 1246.3%Italian
- 1105.6%Hungarian
- 864.3%Other
- 733.7%English
- 552.8%Czech
- 492.5%United States
- 462.3%Dutch
- 432.2%Scotch-Irish
- 231.2%Russian
- 201.0%Ukrainian
- 191.0%Swedish
- 90.5%Welsh
- 70.4%Arab
- 70.4%Scottish
- 50.3%Greek
Zip codes: 15666.