Races in Calamus, Wisconsin (WI) Detailed Stats
Ancestries, Foreign-born residents, place of birth
1.5% of Calamus, WI residents are foreign-born , which is 235.0% less than the foreign-born rate of 5.0% across the entire state of Wisconsin.
Race distribution in Calamus

- 97697.1%White alone
- 101.0%Hispanic
- 90.9%American Indian alone
- 70.7%Black alone
- 30.3%Two or more races

2000
2022
-
- 4,681,63087.3%White alone
- 300,2455.6%Black alone
- 192,9213.6%Hispanic
- 87,9951.6%Asian alone
- 51,9211.0%Two or more races
- 43,9800.8%American Indian alone
- 3,6370.07%Other race alone
- 1,3460.03%Native Hawaiian and Other
Pacific Islander alone

-
- 4,654,03179.0%White alone
- 447,0227.6%Hispanic
- 345,6785.9%Black alone
- 217,5323.7%Two or more races
- 172,2422.9%Asian alone
- 33,7620.6%American Indian alone
- 19,6800.3%Other race alone
- 2,5920.04%Native Hawaiian and Other
Pacific Islander alone

Income and house value in Calamus
- Median household income in 2022
- $76,742White non-Hispanic householders
- $93,068Some other race householders
- $83,060Hispanic or Latino race householders
- Median 2022 house value
- $254,578White Non-Hispanic householders
Household income for White non-Hispanic householders

Household income for Hispanic or Latino race householders

Foreign-born residents in Calamus
15 residents are foreign born
| This city: | 1.5% |
| Wisconsin: | 3.6% |
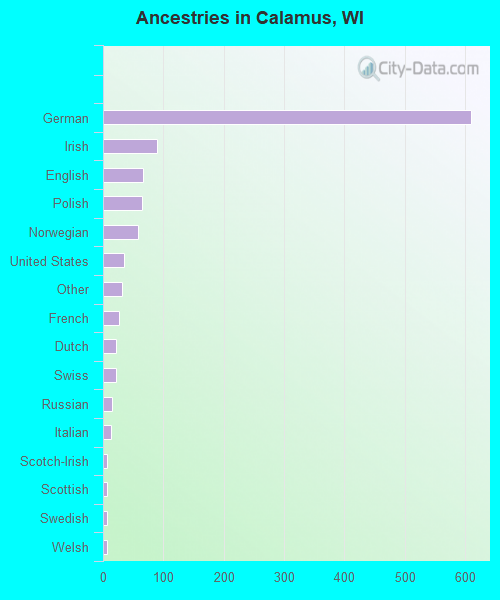
Ancestries in Calamus

- 60956.1%German
- 898.2%Irish
- 676.2%English
- 656.0%Polish
- 585.3%Norwegian
- 343.1%United States
- 312.9%Other
- 272.5%French
- 222.0%Dutch
- 211.9%Swiss
- 151.4%Russian
- 131.2%Italian
- 60.6%Scotch-Irish
- 60.6%Scottish
- 60.6%Swedish
- 60.6%Welsh
- 50.5%French Canadian
- 40.4%Lithuanian
- 10.09%Hungarian
Zip codes: 53925.