Races in Butternuts, New York (NY) Detailed Stats
Ancestries, Foreign-born residents, place of birth
1.5% of Butternuts, NY residents are foreign-born , which is 1416.3% less than the foreign-born rate of 22.0% across the entire state of New York.
Race distribution in Butternuts

- 1,72896.4%White alone
- 211.2%Hispanic
- 140.8%Black alone
- 140.8%Two or more races
- 70.4%American Indian alone
- 50.3%Other race alone
- 30.2%Asian alone

2000
2022
-
- 11,760,98162.0%White alone
- 2,867,58315.1%Hispanic
- 2,812,62314.8%Black alone
- 1,035,9265.5%Asian alone
- 366,1161.9%Two or more races
- 75,4990.4%Other race alone
- 52,4990.3%American Indian alone
- 5,2300.03%Native Hawaiian and Other
Pacific Islander alone

-
- 10,408,93352.9%White alone
- 3,867,29919.7%Hispanic
- 2,633,84013.4%Black alone
- 1,776,2869.0%Asian alone
- 732,6703.7%Two or more races
- 216,1101.1%Other race alone
- 35,0820.2%American Indian alone
- 6,9310.04%Native Hawaiian and Other
Pacific Islander alone

Income and house value in Butternuts
- Median household income in 2022
- $71,995White non-Hispanic householders
- $26,662American Indian and Alaska Native householders
- $107,660Asian householders
- $105,901Some other race householders
- $139,571Two or more races householders
- $100,326Hispanic or Latino race householders
- Median 2022 house value
- $166,567White Non-Hispanic householders
- $221,622American Indian or Alaska Native householders
- $198,294Asian householders
- $75,818Some other race householders
- $174,965Two or more races householders
- $151,636Hispanic or Latino householders
Household income for White non-Hispanic householders

Household income for American Indian and Alaska Native householders

Household income for Asian householders

Household income for Two or more races householders

Household income for Hispanic or Latino race householders

Foreign-born residents in Butternuts
26 residents are foreign born
| This city: | 1.5% |
| New York: | 20.4% |
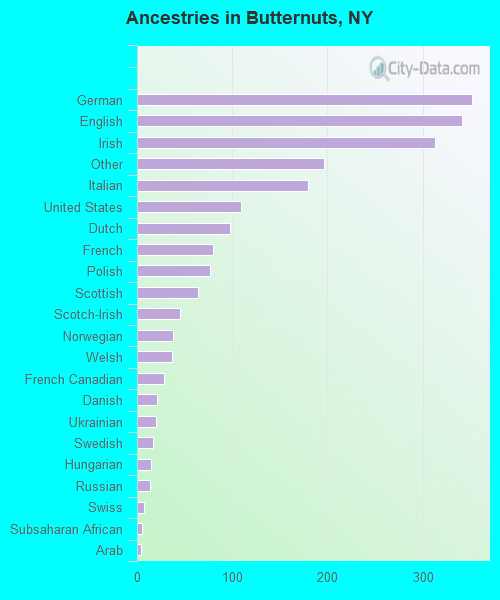
Ancestries in Butternuts

- 35217.0%German
- 34116.5%English
- 31315.1%Irish
- 1969.5%Other
- 1808.7%Italian
- 1095.3%United States
- 984.7%Dutch
- 803.9%French
- 773.7%Polish
- 643.1%Scottish
- 452.2%Scotch-Irish
- 381.8%Norwegian
- 371.8%Welsh
- 281.4%French Canadian
- 211.0%Danish
- 201.0%Ukrainian
- 170.8%Swedish
- 150.7%Hungarian
- 140.7%Russian
- 70.3%Swiss
- 50.2%Subsaharan African
- 40.2%Arab
- 30.1%Greek
- 20.10%West Indian
- 10.05%Portuguese
Zip codes: 13776.