Races in Buffalo, New York (NY) Detailed Stats
Data:
Races - White alone (%)
Races - White alone (% change since 2000)
Races - Black alone (%)
Races - Black alone (% change since 2000)
Races - American Indian alone (%)
Races - American Indian alone (% change since 2000)
Races - Asian alone (%)
Races - Asian alone (% change since 2000)
Races - Hispanic (%)
Races - Hispanic (% change since 2000)
Races - Native Hawaiian and Other Pacific Islander alone (%)
Races - Native Hawaiian and Other Pacific Islander alone (% change since 2000)
Races - Two or more races(%)
Races - Two or more races(% change since 2000)
Races - Other race alone (%)
Races - Other race alone (% change since 2000)
Racial diversity
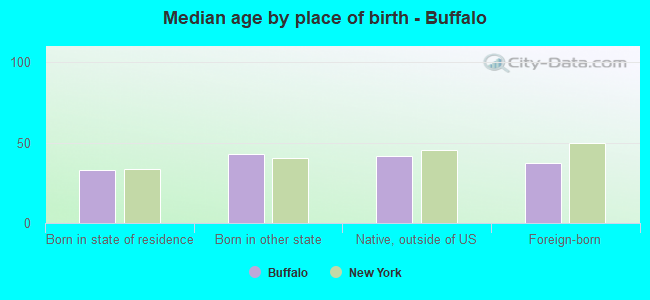
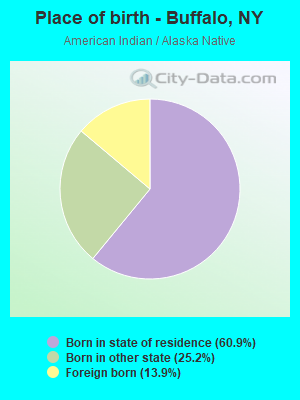
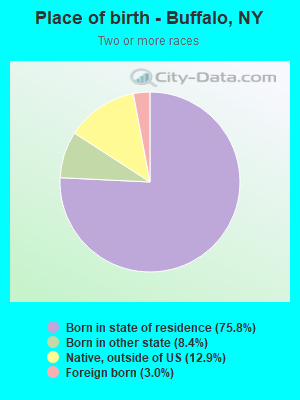
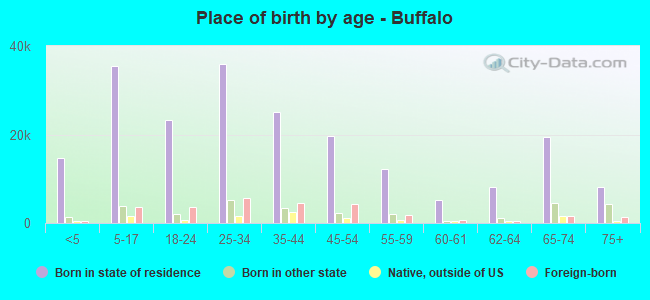
Place of birth - Born in state of residence (%)
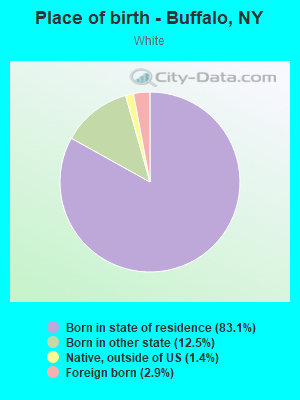
Place of birth - Born in state of residence (%) - White
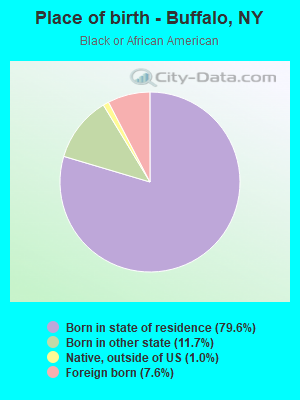
Place of birth - Born in state of residence (%) - Black or African American
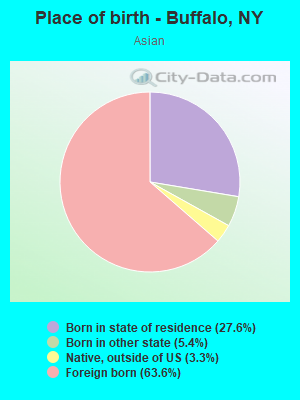
Place of birth - Born in state of residence (%) - Asian
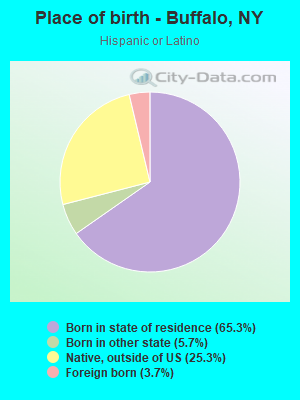
Place of birth - Born in state of residence (%) - Hispanic or Latino
Place of birth - Born in state of residence (%) - American Indian and Alaska Native
Place of birth - Born in state of residence (%) - Multirace
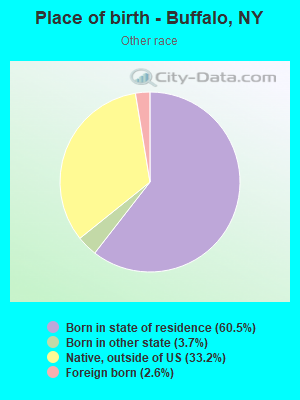
Place of birth - Born in state of residence (%) - Other Race
Place of birth - Born in other state (%)
Place of birth - Born in other state (%) - White
Place of birth - Born in other state (%) - Black or African American
Place of birth - Born in other state (%) - Asian
Place of birth - Born in other state (%) - Hispanic or Latino
Place of birth - Born in other state (%) - American Indian and Alaska Native
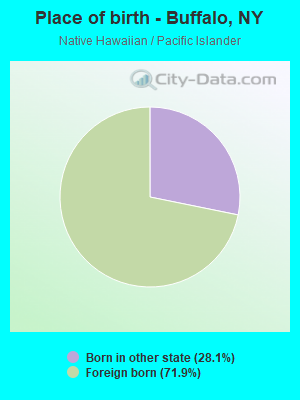
Place of birth - Born in other state (%) - Multirace
Place of birth - Born in other state (%) - Other Race
Place of birth - Native, outside of US (%)
Place of birth - Native, outside of US (%) - White
Place of birth - Native, outside of US (%) - Black or African American
Place of birth - Native, outside of US (%) - Asian
Place of birth - Native, outside of US (%) - Hispanic or Latino
Place of birth - Native, outside of US (%) - American Indian and Alaska Native
Place of birth - Native, outside of US (%) - Multirace
Place of birth - Native, outside of US (%) - Other Race
Place of birth - Foreign born (%)
Place of birth - Foreign born (%) - White
Place of birth - Foreign born (%) - Black or African American
Place of birth - Foreign born (%) - Asian
Place of birth - Foreign born (%) - Hispanic or Latino
Place of birth - Foreign born (%) - American Indian and Alaska Native
Place of birth - Foreign born (%) - Multirace
Place of birth - Foreign born (%) - Other Race
Residents speaking English at home (%)
Residents speaking English at home - Born in the United States (%)
Residents speaking English at home - Native, born elsewhere (%)
Residents speaking English at home - Foreign born (%)
Residents speaking Spanish at home (%)
Residents speaking Spanish at home - Born in the United States (%)
Residents speaking Spanish at home - Native, born elsewhere (%)
Residents speaking Spanish at home - Foreign born (%)
Residents speaking other language at home (%)
Residents speaking other language at home - Born in the United States (%)
Residents speaking other language at home - Native, born elsewhere (%)
Residents speaking other language at home - Foreign born (%)
Marital status - Never married (%)
Marital status - Now married (%)
Marital status - Separated (%)
Marital status - Widowed (%)
Marital status - Divorced (%)
Ancestries Reported - Arab (%)
Ancestries Reported - Czech (%)
Ancestries Reported - Danish (%)
Ancestries Reported - Dutch (%)
Ancestries Reported - English (%)
Ancestries Reported - French (%)
Ancestries Reported - French Canadian (%)
Ancestries Reported - German (%)
Ancestries Reported - Greek (%)
Ancestries Reported - Hungarian (%)
Ancestries Reported - Irish (%)
Ancestries Reported - Italian (%)
Ancestries Reported - Lithuanian (%)
Ancestries Reported - Norwegian (%)
Ancestries Reported - Polish (%)
Ancestries Reported - Portuguese (%)
Ancestries Reported - Russian (%)
Ancestries Reported - Scotch-Irish (%)
Ancestries Reported - Scottish (%)
Ancestries Reported - Slovak (%)
Ancestries Reported - Subsaharan African (%)
Ancestries Reported - Swedish (%)
Ancestries Reported - Swiss (%)
Ancestries Reported - Ukrainian (%)
Ancestries Reported - United States (%)
Ancestries Reported - Welsh (%)
Ancestries Reported - West Indian (%)
Ancestries Reported - Other (%)
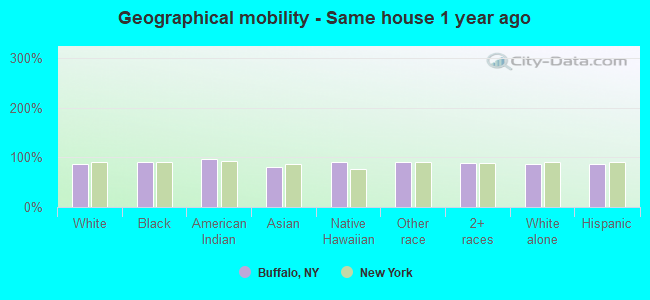
Geographical mobility - Same house 1 year ago (%)
Geographical mobility - Same house 1 year ago (%) - White
Geographical mobility - Same house 1 year ago (%) - Black or African American
Geographical mobility - Same house 1 year ago (%) - Asian
Geographical mobility - Same house 1 year ago (%) - Hispanic or Latino
Geographical mobility - Same house 1 year ago (%) - American Indian and Alaska Native
Geographical mobility - Same house 1 year ago (%) - Multirace
Geographical mobility - Same house 1 year ago (%) - Other Race
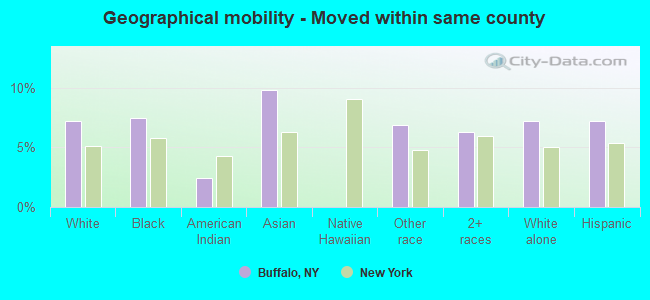
Geographical mobility - Moved within same county (%)
Geographical mobility - Moved within same county (%) - White
Geographical mobility - Moved within same county (%) - Black or African American
Geographical mobility - Moved within same county (%) - Asian
Geographical mobility - Moved within same county (%) - Hispanic or Latino
Geographical mobility - Moved within same county (%) - American Indian and Alaska Native
Geographical mobility - Moved within same county (%) - Multirace
Geographical mobility - Moved within same county (%) - Other Race
Geographical mobility - Moved from different county within same state (%)
Geographical mobility - Moved from different county within same state (%) - White
Geographical mobility - Moved from different county within same state (%) - Black or African American
Geographical mobility - Moved from different county within same state (%) - Asian
Geographical mobility - Moved from different county within same state (%) - Hispanic or Latino
Geographical mobility - Moved from different county within same state (%) - American Indian and Alaska Native
Geographical mobility - Moved from different county within same state (%) - Multirace
Geographical mobility - Moved from different county within same state (%) - Other Race
Geographical mobility - Moved from different state (%)
Geographical mobility - Moved from different state (%) - White
Geographical mobility - Moved from different state (%) - Black or African American
Geographical mobility - Moved from different state (%) - Asian
Geographical mobility - Moved from different state (%) - Hispanic or Latino
Geographical mobility - Moved from different state (%) - American Indian and Alaska Native
Geographical mobility - Moved from different state (%) - Multirace
Geographical mobility - Moved from different state (%) - Other Race
Geographical mobility - Moved from abroad (%)
Geographical mobility - Moved from abroad (%) - White
Geographical mobility - Moved from abroad (%) - Black or African American
Geographical mobility - Moved from abroad (%) - Asian
Geographical mobility - Moved from abroad (%) - Hispanic or Latino
Geographical mobility - Moved from abroad (%) - American Indian and Alaska Native
Geographical mobility - Moved from abroad (%) - Multirace
Geographical mobility - Moved from abroad (%) - Other Race
Place of birth for the foreign-born population - Ireland (%)
Place of birth for the foreign-born population - Denmark (%)
Place of birth for the foreign-born population - Norway (%)
Place of birth for the foreign-born population - Sweden (%)
Place of birth for the foreign-born population - United Kingdom (%)
Place of birth for the foreign-born population - England (%)
Place of birth for the foreign-born population - Scotland (%)
Place of birth for the foreign-born population - Other Northern Europe (%)
Place of birth for the foreign-born population - Austria (%)
Place of birth for the foreign-born population - Belgium (%)
Place of birth for the foreign-born population - France (%)
Place of birth for the foreign-born population - Germany (%)
Place of birth for the foreign-born population - Netherlands (%)
Place of birth for the foreign-born population - Switzerland (%)
Place of birth for the foreign-born population - Other Western Europe (%)
Place of birth for the foreign-born population - Greece (%)
Place of birth for the foreign-born population - Italy (%)
Place of birth for the foreign-born population - Portugal (%)
Place of birth for the foreign-born population - Spain (%)
Place of birth for the foreign-born population - Other Southern Europe (%)
Place of birth for the foreign-born population - Albania (%)
Place of birth for the foreign-born population - Belarus (%)
Place of birth for the foreign-born population - Bosnia and Herzegovina (%)
Place of birth for the foreign-born population - Bulgaria (%)
Place of birth for the foreign-born population - Croatia (%)
Place of birth for the foreign-born population - Czechoslovakia (%)
Place of birth for the foreign-born population - Hungary (%)
Place of birth for the foreign-born population - Latvia (%)
Place of birth for the foreign-born population - Lithuania (%)
Place of birth for the foreign-born population - North Macedonia (Macedonia) (%)
Place of birth for the foreign-born population - Moldova (%)
Place of birth for the foreign-born population - Poland (%)
Place of birth for the foreign-born population - Romania (%)
Place of birth for the foreign-born population - Russia (%)
Place of birth for the foreign-born population - Serbia (%)
Place of birth for the foreign-born population - Ukraine (%)
Place of birth for the foreign-born population - Other Eastern Europe (%)
Place of birth for the foreign-born population - China (%)
Place of birth for the foreign-born population - Hong Kong (%)
Place of birth for the foreign-born population - Taiwan (%)
Place of birth for the foreign-born population - Japan (%)
Place of birth for the foreign-born population - Korea (%)
Place of birth for the foreign-born population - Other Eastern Asia (%)
Place of birth for the foreign-born population - Afghanistan (%)
Place of birth for the foreign-born population - Bangladesh (%)
Place of birth for the foreign-born population - India (%)
Place of birth for the foreign-born population - Iran (%)
Place of birth for the foreign-born population - Kazakhstan (%)
Place of birth for the foreign-born population - Nepal (%)
Place of birth for the foreign-born population - Pakistan (%)
Place of birth for the foreign-born population - Sri Lanka (%)
Place of birth for the foreign-born population - Uzbekistan (%)
Place of birth for the foreign-born population - Other South Central Asia (%)
Place of birth for the foreign-born population - Burma (%)
Place of birth for the foreign-born population - Cambodia (%)
Place of birth for the foreign-born population - Indonesia (%)
Place of birth for the foreign-born population - Laos (%)
Place of birth for the foreign-born population - Malaysia (%)
Place of birth for the foreign-born population - Philippines (%)
Place of birth for the foreign-born population - Singapore (%)
Place of birth for the foreign-born population - Thailand (%)
Place of birth for the foreign-born population - Vietnam (%)
Place of birth for the foreign-born population - Other South Eastern Asia (%)
Place of birth for the foreign-born population - Armenia (%)
Place of birth for the foreign-born population - Iraq (%)
Place of birth for the foreign-born population - Israel (%)
Place of birth for the foreign-born population - Jordan (%)
Place of birth for the foreign-born population - Kuwait (%)
Place of birth for the foreign-born population - Lebanon (%)
Place of birth for the foreign-born population - Saudi Arabia (%)
Place of birth for the foreign-born population - Syria (%)
Place of birth for the foreign-born population - Turkey (%)
Place of birth for the foreign-born population - Yemen (%)
Place of birth for the foreign-born population - Other Western Asia (%)
Place of birth for the foreign-born population - Eritrea (%)
Place of birth for the foreign-born population - Ethiopia (%)
Place of birth for the foreign-born population - Kenya (%)
Place of birth for the foreign-born population - Somalia (%)
Place of birth for the foreign-born population - Uganda (%)
Place of birth for the foreign-born population - Zimbabwe (%)
Place of birth for the foreign-born population - Other Eastern Africa (%)
Place of birth for the foreign-born population - Cameroon (%)
Place of birth for the foreign-born population - Congo (%)
Place of birth for the foreign-born population - Democratic Republic of Congo (Zaire) (%)
Place of birth for the foreign-born population - Other Middle Africa (%)
Place of birth for the foreign-born population - Egypt (%)
Place of birth for the foreign-born population - Morocco (%)
Place of birth for the foreign-born population - Sudan (%)
Place of birth for the foreign-born population - Other Northern Africa (%)
Place of birth for the foreign-born population - South Africa (%)
Place of birth for the foreign-born population - Other Southern Africa (%)
Place of birth for the foreign-born population - Cabo Verde (%)
Place of birth for the foreign-born population - Ghana (%)
Place of birth for the foreign-born population - Liberia (%)
Place of birth for the foreign-born population - Nigeria (%)
Place of birth for the foreign-born population - Senegal (%)
Place of birth for the foreign-born population - Sierra Leone (%)
Place of birth for the foreign-born population - Other Western Africa (%)
Place of birth for the foreign-born population - Australia (%)
Place of birth for the foreign-born population - New Zealand (%)
Place of birth for the foreign-born population - Fiji (%)
Place of birth for the foreign-born population - Micronesia (%)
Place of birth for the foreign-born population - Bahamas (%)
Place of birth for the foreign-born population - Barbados (%)
Place of birth for the foreign-born population - Cuba (%)
Place of birth for the foreign-born population - Dominica (%)
Place of birth for the foreign-born population - Dominican Republic (%)
Place of birth for the foreign-born population - Grenada (%)
Place of birth for the foreign-born population - Haiti (%)
Place of birth for the foreign-born population - Jamaica (%)
Place of birth for the foreign-born population - St. Vincent and the Grenadines (%)
Place of birth for the foreign-born population - Trinidad and Tobago (%)
Place of birth for the foreign-born population - West Indies (%)
Place of birth for the foreign-born population - Other Caribbean (%)
Place of birth for the foreign-born population - Belize (%)
Place of birth for the foreign-born population - Costa Rica (%)
Place of birth for the foreign-born population - El Salvador (%)
Place of birth for the foreign-born population - Guatemala (%)
Place of birth for the foreign-born population - Honduras (%)
Place of birth for the foreign-born population - Mexico (%)
Place of birth for the foreign-born population - Nicaragua (%)
Place of birth for the foreign-born population - Panama (%)
Place of birth for the foreign-born population - Other Central America (%)
Place of birth for the foreign-born population - Argentina (%)
Place of birth for the foreign-born population - Bolivia (%)
Place of birth for the foreign-born population - Brazil (%)
Place of birth for the foreign-born population - Chile (%)
Place of birth for the foreign-born population - Colombia (%)
Place of birth for the foreign-born population - Ecuador (%)
Place of birth for the foreign-born population - Guyana (%)
Place of birth for the foreign-born population - Peru (%)
Place of birth for the foreign-born population - Uruguay (%)
Place of birth for the foreign-born population - Venezuela (%)
Place of birth for the foreign-born population - Other South America (%)
Place of birth for the foreign-born population - Canada (%)
Place of birth for the foreign-born population - Other Northern America (%)
Place of birth for the foreign-born population - Other (%)
Latest news about races in Buffalo, NY collected exclusively by city-data.com from local newspapers, TV, and radio stations
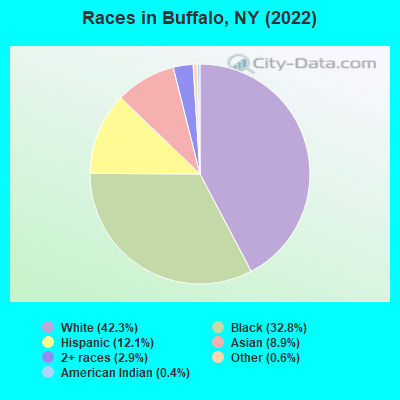
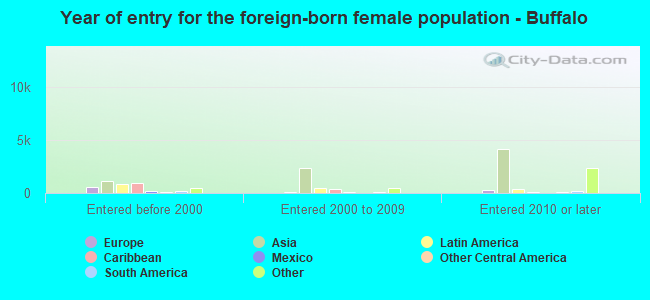
According to 2022 data, the most numerous races in Buffalo, NY are White alone (116,924 residents), Hispanic (33,544 residents), and Black alone (90,754 residents). 81.3% of Buffalo residents speak English at home. 10.6% of Buffalo, NY residents are foreign-born (5.8% born in Asia, 2.1% born in Africa, 1.8% born in Latin America), which is 106.6% less than the foreign-born rate of 22.0% across the entire state of New York.
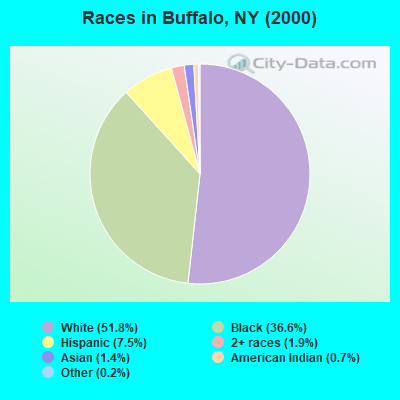
Race distribution in Buffalo
2000 2022
151,450 51.8% White alone 107,066 36.6% Black alone 22,076 7.5% Hispanic 5,456 1.9% Two or more races 4,045 1.4% Asian alone 2,010 0.7% American Indian alone 474 0.2% Other race alone 71 0.02% Native Hawaiian and Other
116,924 42.3% White alone 90,754 32.8% Black alone 33,544 12.1% Hispanic 24,572 8.9% Asian alone 8,016 2.9% Two or more races 1,556 0.6% Other race alone 1,125 0.4% American Indian alone
2000 2022
11,760,981 62.0% White alone 2,867,583 15.1% Hispanic 2,812,623 14.8% Black alone 1,035,926 5.5% Asian alone 366,116 1.9% Two or more races 75,499 0.4% Other race alone 52,499 0.3% American Indian alone 5,230 0.03% Native Hawaiian and Other
10,408,933 52.9% White alone 3,867,299 19.7% Hispanic 2,633,840 13.4% Black alone 1,776,286 9.0% Asian alone 732,670 3.7% Two or more races 216,110 1.1% Other race alone 35,082 0.2% American Indian alone 6,931 0.04% Native Hawaiian and Other
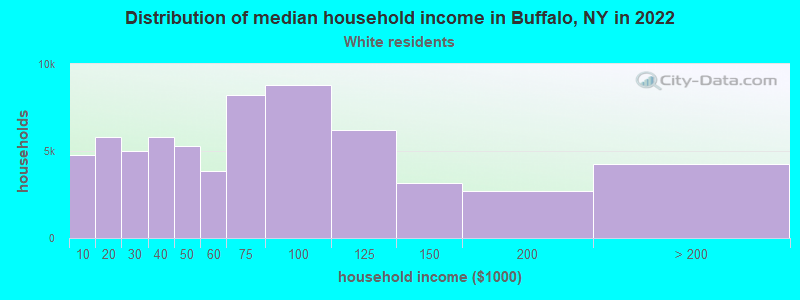
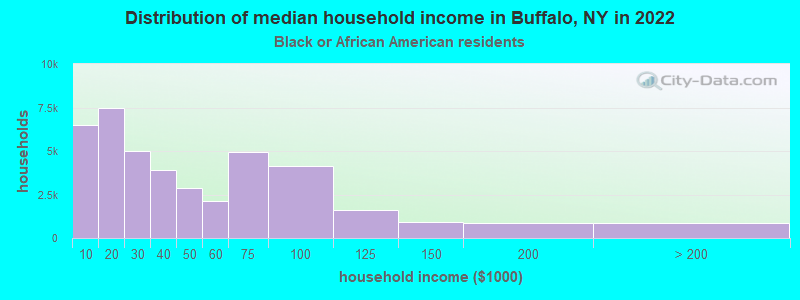
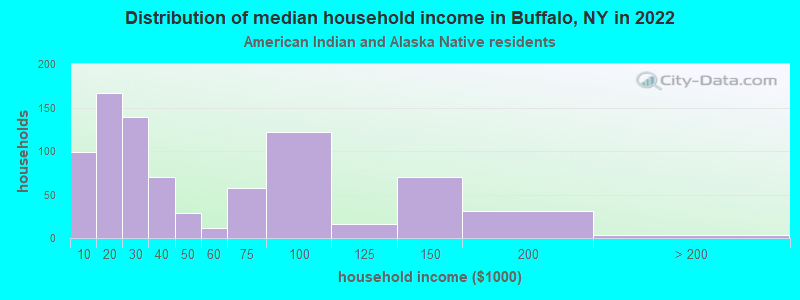
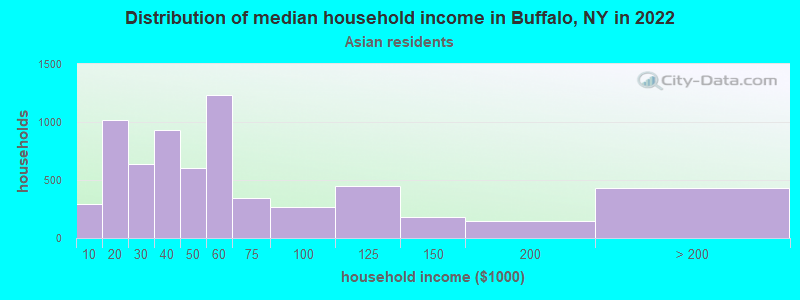
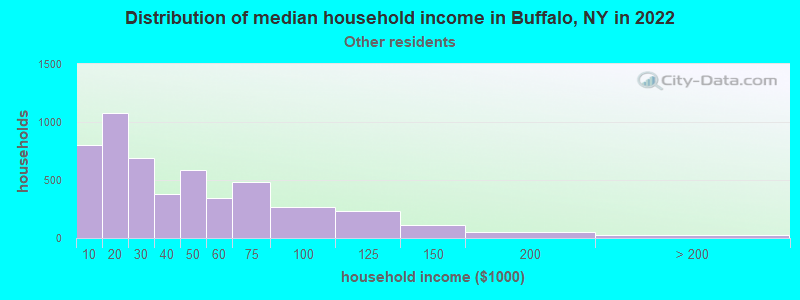
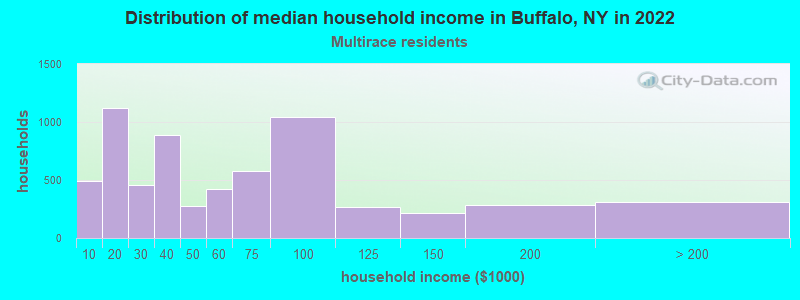
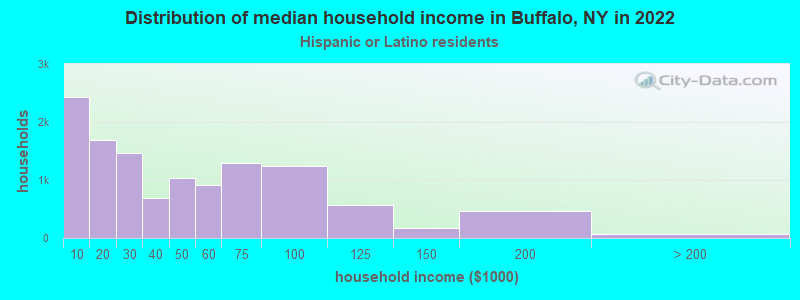
Income and house value in Buffalo Median household income in 2022 $62,947 White non-Hispanic householders$33,802 Black householders$38,946 American Indian and Alaska Native householders$44,706 Asian householders$39,562 Some other race householders$46,821 Two or more races householders$35,429 Hispanic or Latino race householdersMedian 2022 house value $176,278 White Non-Hispanic householders$134,189 Black or African American householders$169,718 American Indian or Alaska Native householders $149,494 Asian householders$153,320 Some other race householders$169,718 Two or more races householders$165,346 Hispanic or Latino householders
Median age by race in Buffalo
39.9 Median age for White residents40.2 39.7 34.1 Median age for Black or African American residents32.0 35.6 40.9 Median age for American Indian / Alaska Native residents28.4 35.5 25.5 Median age for Asian residents25.0 25.8 -666,666,666.0 Median age for Native Hawaiian / Pacific Islander residents-666,666,666.0 -666,666,666.0 29.6 Median age for Other race residents30.6 29.3 20.2 Median age for Two or more races residents19.8 20.2 40.9 Median age for White alone residents41.1 40.6 25.8 Median age for Hispanic or Latino residents22.7 27.2
Owner/renter occupied households by race in Buffalo
House owners and renters - White residents 30,861 48.3% Owner occupied32,973 51.7% Renter occupiedHouse owners and renters - Black or African American residents 15,877 38.6% Owner occupied25,293 61.4% Renter occupiedHouse owners and renters - American Indian / Alaska Native residents 403 47.6% Owner occupied443 52.4% Renter occupiedHouse owners and renters - Asian residents 3,480 53.3% Owner occupied3,050 46.7% Renter occupiedHouse owners and renters - Native Hawaiian / Pacific Islander residents 4 100.0% Renter occupiedHouse owners and renters - Other race residents 434 8.3% Owner occupied4,785 91.7% Renter occupiedHouse owners and renters - Two or more races residents 2,335 46.9% Owner occupied2,644 53.1% Renter occupiedHouse owners and renters - White alone residents 29,798 49.3% Owner occupied30,645 50.7% Renter occupiedHouse owners and renters - Hispanic or Latino residents 2,688 22.4% Owner occupied9,324 77.6% Renter occupied
Language usage in Buffalo
English speakers - Total 81.3% of residents of Buffalo speak English at home.
6.6% of residents speak Spanish at home 10,913 63.1% Speak English very well6,373 36.9% Speak English less than very well12.1% of residents speak other language at home 17,767 56.6% Speak English very well13,639 43.4% Speak English less than very well
English speakers - Born in the United States 93.9% of residents of Buffalo speak English at home.
3.0% of residents speak Spanish at home 614 69.9% Speak English very well264 30.1% Speak English less than very well3.1% of residents speak other language at home 801 89.6% Speak English very well93 10.4% Speak English less than very well
English speakers - Native, born elsewhere 16.3% of residents of Buffalo speak English at home.
71.2% of residents speak Spanish at home 3,115 41.2% Speak English very well4,452 58.8% Speak English less than very well12.4% of residents speak other language at home 938 71.0% Speak English very well384 29.0% Speak English less than very well
English speakers - Foreign-born 15.8% of residents of Buffalo speak English at home.
3.8% of residents speak Spanish at home 479 45.9% Speak English very well564 54.1% Speak English less than very well80.4% of residents speak other language at home 9,928 44.9% Speak English very well12,205 55.1% Speak English less than very well
White (Caucasian) - Speak only English Native:
95.5% (110,299)Foreign-born:
37.1% (1,335)
White (Caucasian) - Speak another language Native:
4.5% (5,226)Foreign-born:
62.9% (2,268)
Black or African American - Speak only English Native:
95.1% (76,456)Foreign-born:
18.7% (1,337)
Black or African American - Speak another language Native:
4.9% (3,913)Foreign-born:
81.3% (5,829)
American Indian / Alaska Native - Speak only English Native:
81.4% (978)Foreign-born:
46.3% (85)
American Indian / Alaska Native - Speak another language Native:
11.7% (140)Foreign-born:
29.7% (54)
Asian - Speak only English Native:
24.7% (1,718)Foreign-born:
9.1% (1,426)
Asian - Speak another language Native:
75.3% (5,247)Foreign-born:
90.9% (14,175)
Native Hawaiian / Pacific Islander - Speak only English Native:
100.0% (4)Foreign-born:
100.0% (14)
Other race - Speak only English Native:
44.4% (5,846)Foreign-born:
18.5% (70)
Other race - Speak another language Native:
55.6% (7,333)Foreign-born:
81.5% (308)
Two or more races - Speak only English Native:
75.6% (11,651)Foreign-born:
8.5% (48)
Two or more races - Speak another language Native:
24.4% (3,755)Foreign-born:
91.5% (515)
White alone - Speak only English Native:
96.4% (106,104)Foreign-born:
39.0% (1,335)
White alone - Speak another language Native:
3.6% (4,006)Foreign-born:
61.0% (2,088)
Hispanic or Latino - Speak only English Native:
53.4% (15,527)Foreign-born:
9.5% (118)
Hispanic or Latino - Speak another language Native:
46.6% (13,573)Foreign-born:
90.5% (1,126)
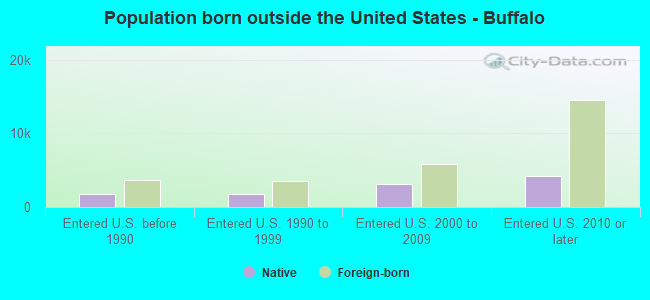
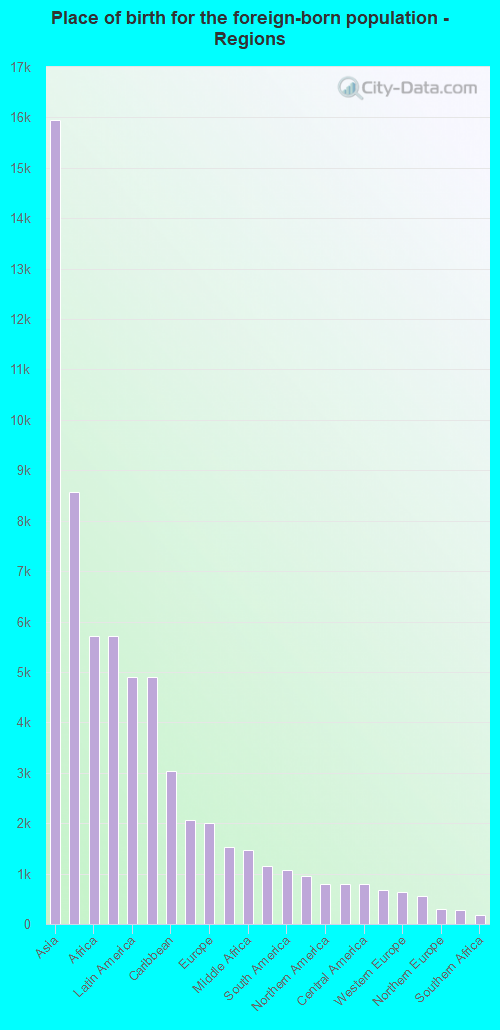
Foreign-born residents in Buffalo 29,436 residents are foreign born (5.8% Asia , 2.1% Africa , 1.8% Latin America ).
This city:
10.6%New York:
22.6%
Marital status for residents in Buffalo Marital status - White (Caucasian) population 15 years and over
Males 50.6% Never married31.5% Now married1.8% Separated3.8% Widowed12.4% DivorcedFemales 47.9% Never married29.7% Now married2.3% Separated7.3% Widowed12.7% DivorcedWomen who gave birth in the past 12 months Now married:
55.3% (564)Unmarried:
44.7% (456)
Women who did not give birth in the past 12 months Now married:
23.9% (6,979)Unmarried:
76.1% (22,212)
Marital status - Black or African American population 15 years and over
Males 57.9% Never married27.8% Now married3.8% Separated2.3% Widowed8.2% DivorcedFemales 53.1% Never married19.9% Now married3.9% Separated9.2% Widowed14.0% DivorcedWomen who gave birth in the past 12 months Now married:
41.7% (698)Unmarried:
58.3% (977)
Women who did not give birth in the past 12 months Now married:
21.3% (5,140)Unmarried:
78.7% (19,016)
Marital status - American Indian / Alaska Native population 15 years and over
Males 51.7% Never married32.3% Now married0.0% Separated2.1% Widowed13.9% DivorcedFemales 55.6% Never married20.6% Now married3.6% Separated2.5% Widowed17.7% DivorcedWomen who did not give birth in the past 12 months Now married:
11.8% (63)Unmarried:
88.2% (471)
Marital status - Asian population 15 years and over
Males 47.4% Never married48.2% Now married1.3% Separated0.8% Widowed2.4% DivorcedFemales 31.5% Never married58.3% Now married2.0% Separated4.3% Widowed4.0% DivorcedWomen who gave birth in the past 12 months Now married:
100.0% (316)Unmarried:
0.0% (0)
Women who did not give birth in the past 12 months Now married:
57.1% (3,848)Unmarried:
42.9% (2,886)
Marital status - Other race population 15 years and over
Males 52.1% Never married33.2% Now married0.0% Separated0.0% Widowed14.7% DivorcedFemales 77.9% Never married15.0% Now married0.0% Separated1.8% Widowed5.3% DivorcedWomen who gave birth in the past 12 months Now married:
38.3% (141)Unmarried:
61.7% (227)
Women who did not give birth in the past 12 months Now married:
18.3% (759)Unmarried:
81.7% (3,395)
Marital status - Two or more races population 15 years and over
Males 68.8% Never married19.2% Now married0.3% Separated0.0% Widowed11.6% DivorcedFemales 58.2% Never married27.3% Now married9.8% Separated2.0% Widowed2.7% DivorcedWomen who gave birth in the past 12 months Now married:
45.3% (85)Unmarried:
54.7% (103)
Women who did not give birth in the past 12 months Now married:
22.1% (1,112)Unmarried:
77.9% (3,911)
Marital status - White alone, not Hispanic / Latino population 15 years and over
Males 50.3% Never married31.7% Now married1.5% Separated3.9% Widowed12.6% DivorcedFemales 47.2% Never married30.0% Now married2.0% Separated7.8% Widowed12.9% DivorcedWomen who gave birth in the past 12 months Now married:
55.3% (564)Unmarried:
44.7% (456)
Women who did not give birth in the past 12 months Now married:
23.7% (6,314)Unmarried:
76.3% (20,299)
Marital status - Hispanic or Latino population 15 years and over
Males 60.2% Never married24.2% Now married3.4% Separated0.0% Widowed12.2% DivorcedFemales 65.8% Never married20.4% Now married5.8% Separated1.6% Widowed6.4% DivorcedWomen who gave birth in the past 12 months Now married:
27.8% (170)Unmarried:
72.2% (441)
Women who did not give birth in the past 12 months Now married:
21.6% (2,054)Unmarried:
78.4% (7,457)
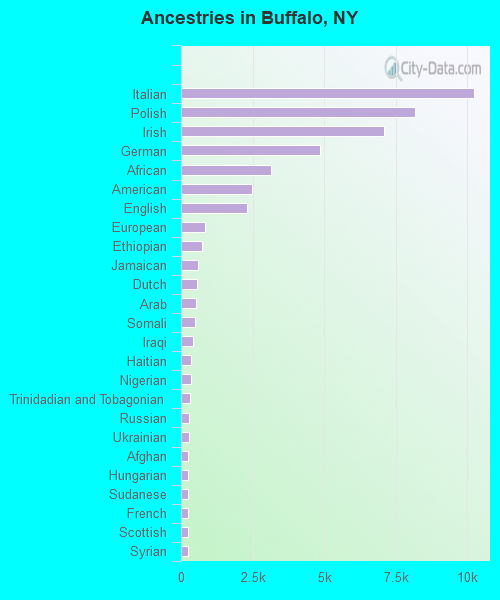
Ancestries in Buffalo
10,253 7.0% Italian8,181 5.6% Polish7,106 4.9% Irish4,862 3.3% German3,152 2.2% African2,466 1.7% American2,307 1.6% English846 0.6% European727 0.5% Ethiopian587 0.4% Jamaican564 0.4% Dutch521 0.4% Arab477 0.3% Somali423 0.3% Iraqi367 0.3% Haitian342 0.2% Nigerian310 0.2% Trinidadian and Tobagonian289 0.2% Russian277 0.2% Ukrainian251 0.2% Afghan250 0.2% Hungarian246 0.2% Sudanese243 0.2% French235 0.2% Scottish233 0.2% Syrian222 0.2% Eastern European194 0.1% Scotch-Irish188 0.1% Swedish178 0.1% Turkish165 0.1% Norwegian164 0.1% Portuguese161 0.1% British152 0.1% Liberian152 0.1% French Canadian143 0.10% Lebanese131 0.09% Scandinavian131 0.09% Belizean128 0.09% Israeli119 0.08% Swiss119 0.08% Ghanaian111 0.08% Greek109 0.07% Lithuanian100 0.07% Canadian100 0.07% Croatian94 0.06% Welsh87 0.06% West Indian80 0.05% Egyptian80 0.05% Palestinian78 0.05% Northern European78 0.05% Yugoslavian75 0.05% Guyanese68 0.05% Dutch West Indian60 0.04% Latvian60 0.04% British West Indian54 0.04% Romanian49 0.03% German Russian44 0.03% Danish40 0.03% Serbian40 0.03% Celtic39 0.03% Albanian33 0.02% Austrian32 0.02% Moroccan31 0.02% Slovak24 0.02% Czech20 0.01% Iranian20 0.01% Finnish19 0.01% Czechoslovakian18 0.01% Slovene18 0.01% Slavic18 0.01% Jordanian15 0.01% Brazilian11 0.01% Bahamian11 0.01% U.S. Virgin Islander9 0.01% Bulgarian9 0.01% Belgian8 0.01% Australian8 0.01% Barbadian
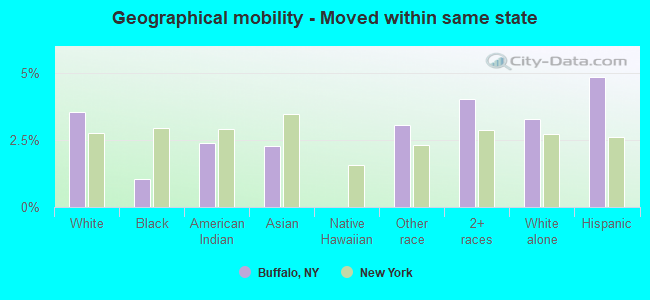
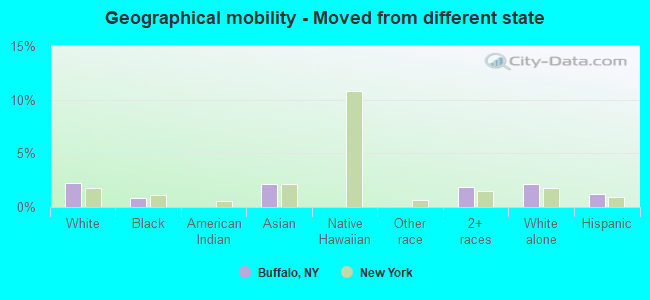
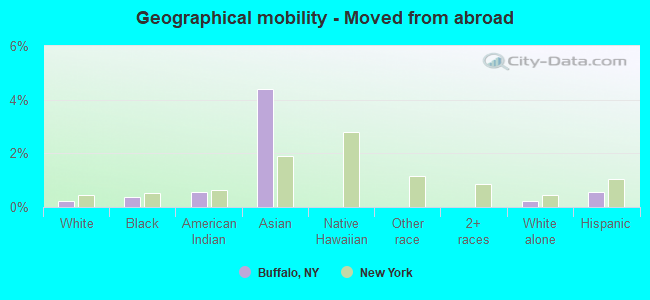
Geographical mobility in Buffalo Same house 1 year ago 105,865 86.8% White (Caucasian)83,225 90.3% Black or African American1,452 96.3% American Indian / Alaska Native19,757 81.4% Asian16 89.7% Native Hawaiian / Pacific Islander13,177 90.0% Other race16,431 87.8% Two or more races101,325 87.1% White alone, not Hispanic / Latino28,438 86.2% Hispanic or LatinoMoved within same county 8,768 7.2% White / Caucasian6,885 7.5% Black or African American36 2.4% American Indian / Alaska Native2,380 9.8% Asian1,011 6.9% Other race1,184 6.3% Two or more races8,421 7.2% White alone, not Hispanic / Latino2,374 7.2% Hispanic or LatinoMoved within same state 4,324 3.5% White / Caucasian965 1.0% Black or African American36 2.4% American Indian / Alaska Native549 2.3% Asian445 3.0% Other race756 4.0% Two or more races3,805 3.3% White alone, not Hispanic / Latino1,596 4.8% Hispanic or LatinoMoved from different state 2,725 2.2% White / Caucasian743 0.8% Black or African American526 2.2% Asian345 1.8% Two or more races2,536 2.2% White alone, not Hispanic / Latino385 1.2% Hispanic or LatinoMoved from abroad 267 0.2% White345 0.4% Black or African American8 0.5% American Indian / Alaska Native1,070 4.4% Asian267 0.2% White alone, not Hispanic / Latino180 0.5% Hispanic or Latino
Children Nativity (place of birth) in Buffalo
Children under 6 years - Living with two parents Both parents native 5,356 100.0% NativeBoth parents foreign-born 3,328 100.0% NativeOne native, one foreign-born parent 628 77.4% Native183 22.6% Foreign-bornChildren under 6 years - Living with one parent Native parent 10,651 100.0% NativeChildren 6 to 17 years - Living with two parents Both parents native 10,696 99.7% Native37 0.3% Foreign-bornBoth parents foreign-born 2,795 46.1% Native3,273 53.9% Foreign-bornOne native, one foreign-born parent 778 100.0% NativeChildren 6 to 17 years - Living with one parent Native parent 18,171 100.0% NativeForeign-born parent 1,971 50.6% Native1,928 49.4% Foreign-born
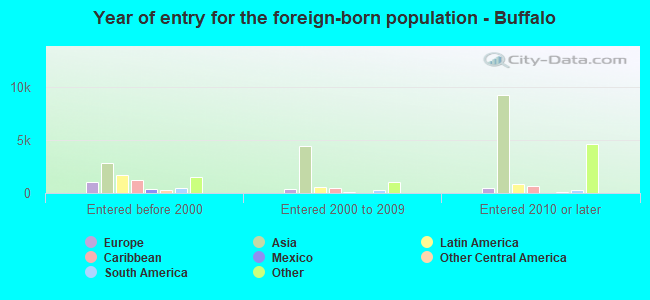
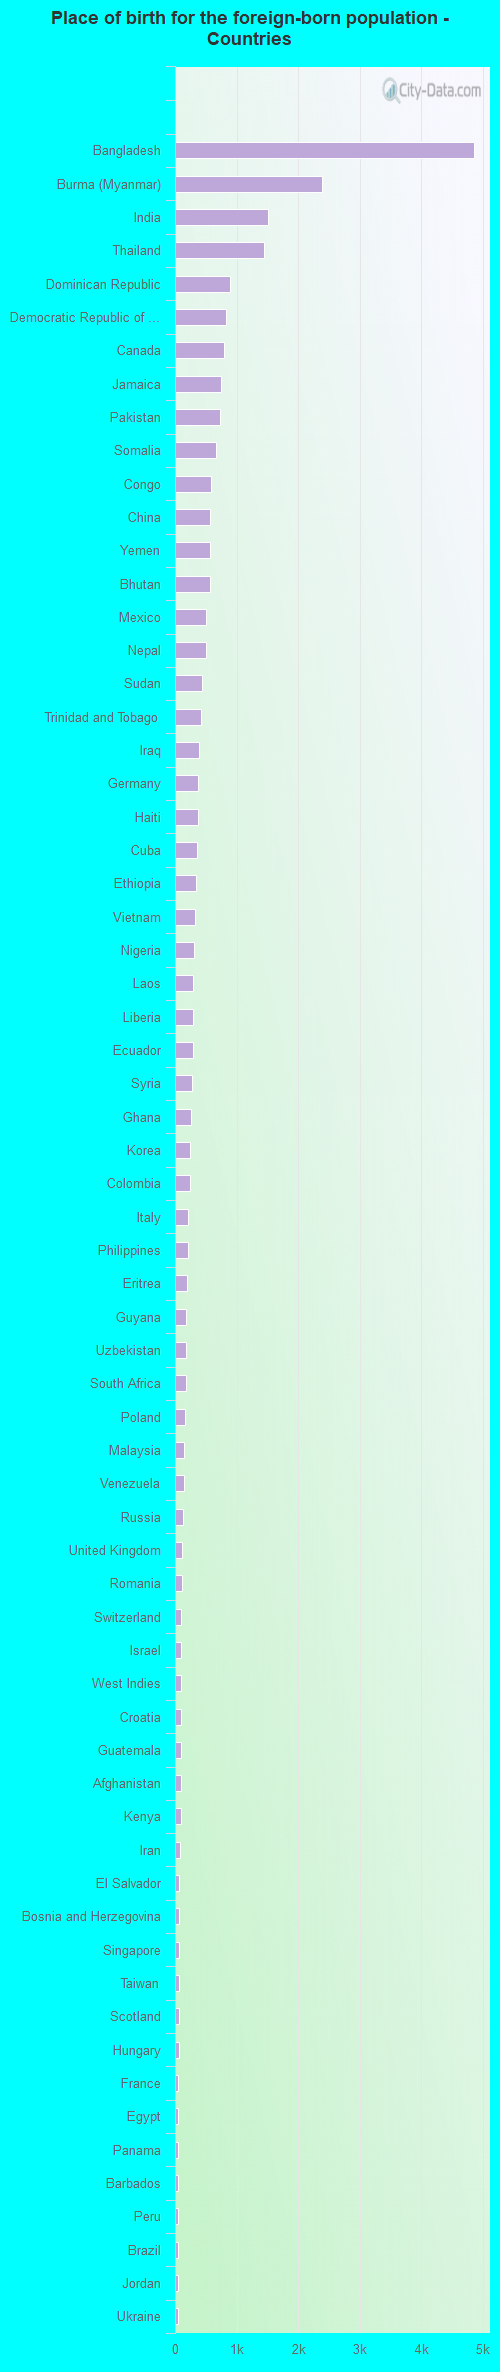
Place of birth for residents in Buffalo 15,956 Asia8,564 South Central Asia5,708 Africa5,706 Americas4,903 Latin America4,893 South Eastern Asia3,037 Caribbean2,063 Eastern Africa1,995 Europe1,533 Western Asia1,471 Middle Africa1,146 Western Africa1,077 South America955 Eastern Asia802 Northern America800 Eastern Europe789 Central America673 China626 Western Europe550 Northern Africa300 Northern Europe268 Southern Europe171 Southern Africa71 Oceania43 Australia and New Zealand Subregion4,856 Bangladesh2,383 Burma (Myanmar)1,515 India1,438 Thailand891 Dominican Republic830 Democratic Republic of Congo (Zaire)802 Canada743 Jamaica732 Pakistan668 Somalia585 Congo576 China565 Yemen564 Bhutan506 Mexico505 Nepal443 Sudan426 Trinidad and Tobago397 Iraq373 Germany367 Haiti351 Cuba334 Ethiopia322 Vietnam315 Nigeria300 Laos300 Liberia295 Ecuador275 Syria260 Ghana251 Korea246 Colombia213 Italy211 Philippines196 Eritrea181 Guyana175 Uzbekistan171 South Africa170 Poland145 Malaysia141 Venezuela136 Russia116 United Kingdom111 Romania104 Switzerland104 Israel104 West Indies104 Croatia100 Guatemala99 Afghanistan93 Kenya77 Iran73 El Salvador71 Bosnia and Herzegovina64 Singapore63 Taiwan61 Scotland57 Hungary56 France55 Egypt52 Panama51 Barbados51 Peru49 Brazil47 Jordan45 Ukraine44 Argentina43 England43 Senegal43 Uganda43 Australia42 Netherlands41 Sweden37 Sri Lanka37 Ireland36 Tanzania35 Albania35 Austria35 Kuwait34 Spain33 Togo33 Hong Kong33 Lebanon30 Japan25 Zimbabwe23 Saudi Arabia22 Latvia22 Turkey21 Costa Rica20 Honduras19 Greece18 Bolivia18 Indonesia18 United Arab Emirates17 Serbia16 Morocco14 St. Lucia13 Nicaragua12 Dominica12 St. Vincent and the Grenadines12 Belgium11 Chile9 Czechoslovakia9 Ivory Coast7 Sierra Leone7 Bulgaria7 Cambodia6 Lithuania4 Cameroon3 Micronesia1 Belarus
Grandparents responsible for own grandchildren in Buffalo
Grandparents (30 to 59 years) White / Caucasian 229 39.0% Responsible for grandchildren358 61.0% Not responsible for grandchildrenBlack or African American 901 64.6% Responsible for grandchildren494 35.4% Not responsible for grandchildrenAmerican Indian / Alaska Native 29 100.0% Not responsible for grandchildrenAsian 13 8.9% Responsible for grandchildren132 91.1% Not responsible for grandchildrenOther race 91 40.9% Responsible for grandchildren131 59.1% Not responsible for grandchildrenTwo or more races 48 100.0% Not responsible for grandchildrenWhite alone, not Hispanic / Latino 180 34.7% Responsible for grandchildren340 65.3% Not responsible for grandchildrenHispanic or Latino 74 23.6% Responsible for grandchildren241 76.4% Not responsible for grandchildrenGrandparents (60 years and over) White / Caucasian 305 41.2% Responsible for grandchildren434 58.8% Not responsible for grandchildrenBlack or African American 405 38.0% Responsible for grandchildren661 62.0% Not responsible for grandchildrenAsian 22 5.4% Responsible for grandchildren375 94.6% Not responsible for grandchildrenOther race 66 62.9% Responsible for grandchildren39 37.1% Not responsible for grandchildrenTwo or more races 15 44.7% Responsible for grandchildren18 55.3% Not responsible for grandchildrenWhite alone, not Hispanic / Latino 292 43.5% Responsible for grandchildren379 56.5% Not responsible for grandchildrenHispanic or Latino 105 48.3% Responsible for grandchildren113 51.7% Not responsible for grandchildren
Zip codes: 14201 , 14202 , 14203 , 14204 , 14206 , 14207 , 14208 , 14209 , 14210 , 14211 , 14212 , 14213 , 14214 , 14215 , 14216 , 14218 , 14220 , 14222 , 14223 , 14225 .