Races in Brushy Creek, South Carolina (SC) Detailed Stats
Ancestries, Foreign-born residents, place of birth
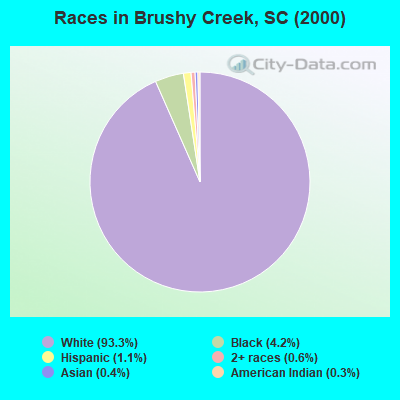
Race distribution in Brushy Creek

- 18,35293.3%White alone
- 8354.2%Black alone
- 2251.1%Hispanic
- 1120.6%Two or more races
- 740.4%Asian alone
- 540.3%American Indian alone
- 90.05%Other race alone
- 40.02%Native Hawaiian and Other
Pacific Islander alone
2000
2022
-
- 2,652,29166.1%White alone
- 1,178,48629.4%Black alone
- 95,0762.4%Hispanic
- 35,5680.9%Asian alone
- 33,2900.8%Two or more races
- 12,7650.3%American Indian alone
- 3,2660.08%Other race alone
- 1,2700.03%Native Hawaiian and Other
Pacific Islander alone

-
- 3,301,73962.5%White alone
- 1,313,29024.9%Black alone
- 343,7836.5%Hispanic
- 190,5083.6%Two or more races
- 89,8881.7%Asian alone
- 29,3900.6%Other race alone
- 12,1120.2%American Indian alone
- 1,9240.04%Native Hawaiian and Other
Pacific Islander alone

Income and house value in Brushy Creek
- Median household income in 2022
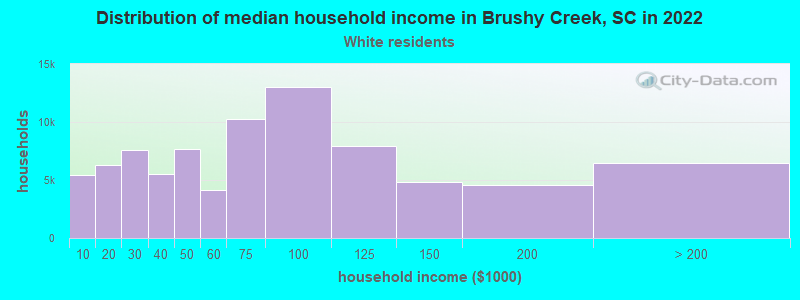
- $84,552White non-Hispanic householders
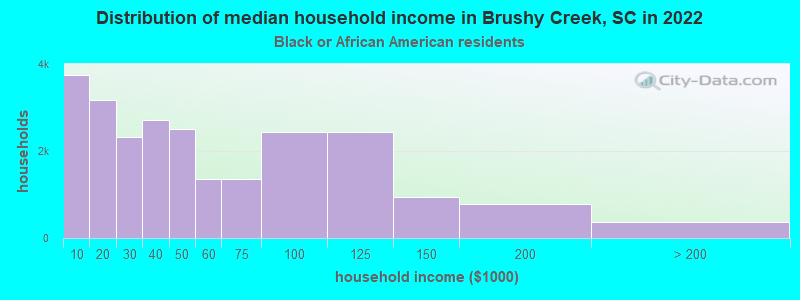
- $77,515Black householders
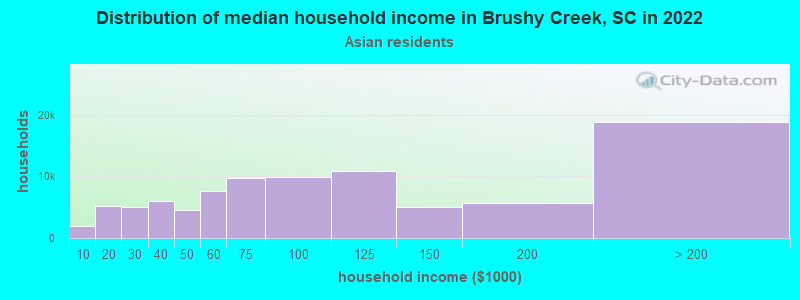
- over $200,000Asian householders
- $145,933Some other race householders
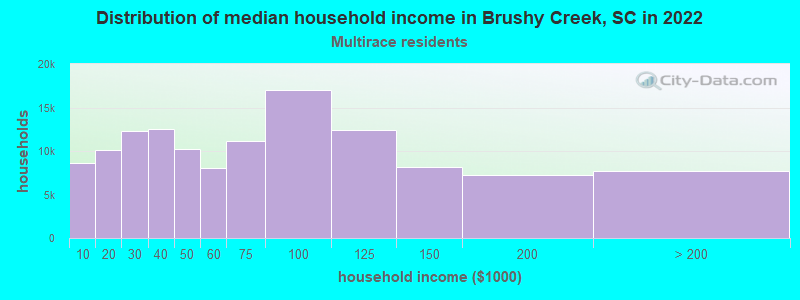
- $56,126Two or more races householders
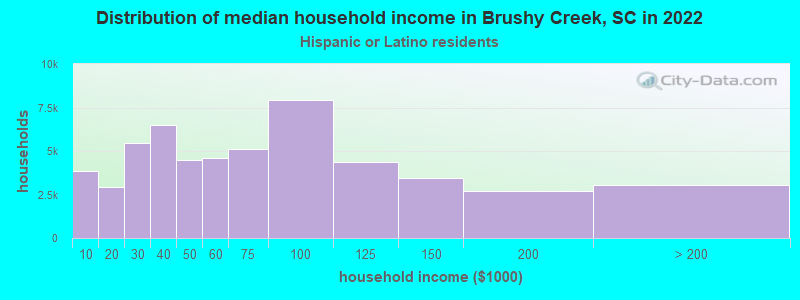
- $84,860Hispanic or Latino race householders
- Median 2022 house value
- $367,600White Non-Hispanic householders
- $288,788Black or African American householders
- $533,476Asian householders
- $782,432Some other race householders
- $182,662Two or more races householders
- $569,041Hispanic or Latino householders
Household income for White non-Hispanic householders
Household income for Black householders
Household income for Asian householders
Household income for Two or more races householders
Household income for Hispanic or Latino race householders
Zip code: 29673