Races in Brown Deer, Wisconsin (WI) Detailed Stats
Data:
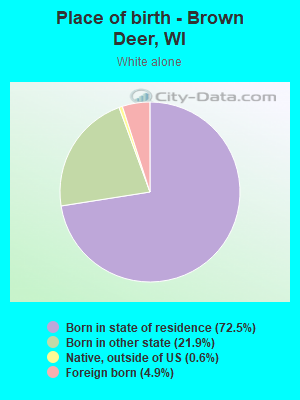
Races - White alone (%)
Races - White alone (% change since 2000)
Races - Black alone (%)
Races - Black alone (% change since 2000)
Races - American Indian alone (%)
Races - American Indian alone (% change since 2000)
Races - Asian alone (%)
Races - Asian alone (% change since 2000)
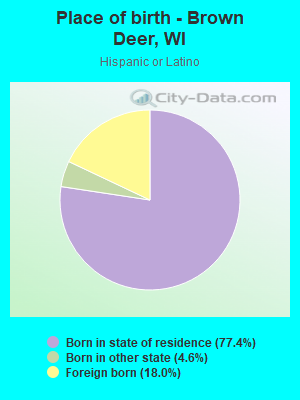
Races - Hispanic (%)
Races - Hispanic (% change since 2000)
Races - Native Hawaiian and Other Pacific Islander alone (%)
Races - Native Hawaiian and Other Pacific Islander alone (% change since 2000)
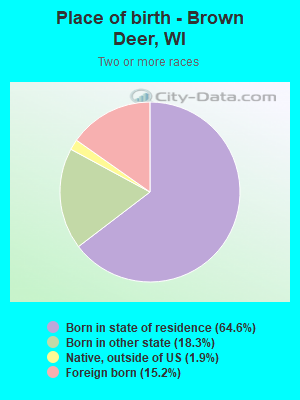
Races - Two or more races(%)
Races - Two or more races(% change since 2000)
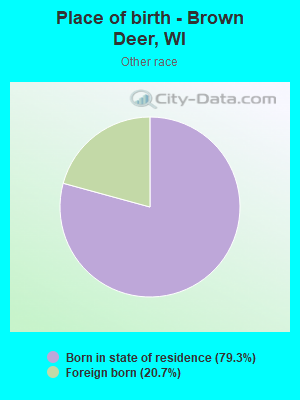
Races - Other race alone (%)
Races - Other race alone (% change since 2000)
Racial diversity
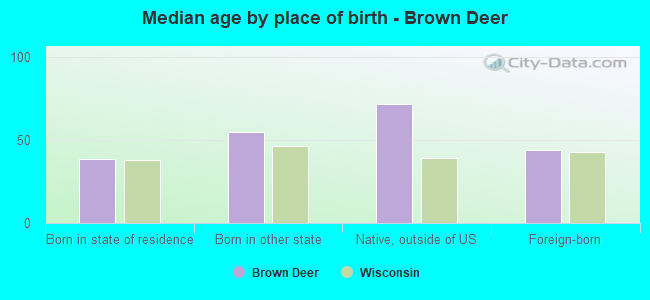
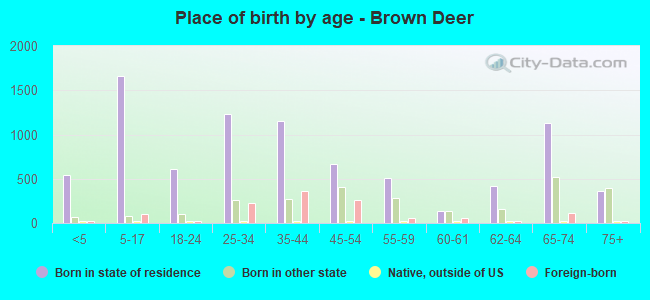
Place of birth - Born in state of residence (%)
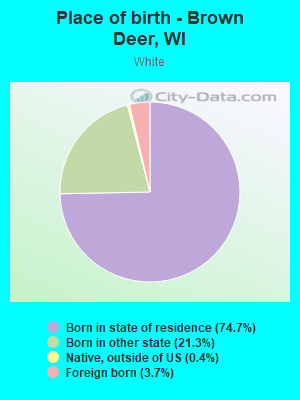
Place of birth - Born in state of residence (%) - White
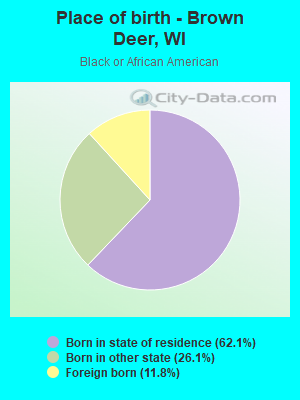
Place of birth - Born in state of residence (%) - Black or African American
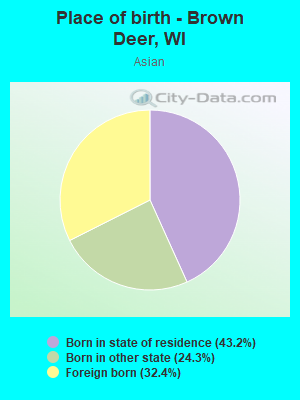
Place of birth - Born in state of residence (%) - Asian
Place of birth - Born in state of residence (%) - Hispanic or Latino
Place of birth - Born in state of residence (%) - American Indian and Alaska Native
Place of birth - Born in state of residence (%) - Multirace
Place of birth - Born in state of residence (%) - Other Race
Place of birth - Born in other state (%)
Place of birth - Born in other state (%) - White
Place of birth - Born in other state (%) - Black or African American
Place of birth - Born in other state (%) - Asian
Place of birth - Born in other state (%) - Hispanic or Latino
Place of birth - Born in other state (%) - American Indian and Alaska Native
Place of birth - Born in other state (%) - Multirace
Place of birth - Born in other state (%) - Other Race
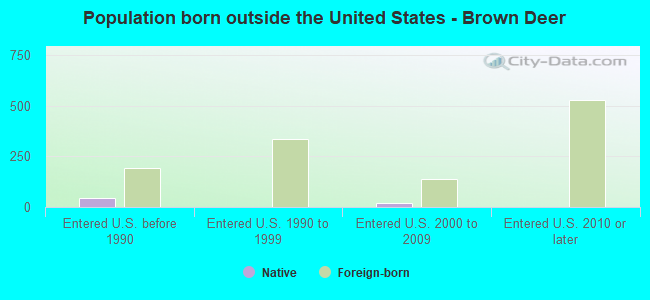
Place of birth - Native, outside of US (%)
Place of birth - Native, outside of US (%) - White
Place of birth - Native, outside of US (%) - Black or African American
Place of birth - Native, outside of US (%) - Asian
Place of birth - Native, outside of US (%) - Hispanic or Latino
Place of birth - Native, outside of US (%) - American Indian and Alaska Native
Place of birth - Native, outside of US (%) - Multirace
Place of birth - Native, outside of US (%) - Other Race
Place of birth - Foreign born (%)
Place of birth - Foreign born (%) - White
Place of birth - Foreign born (%) - Black or African American
Place of birth - Foreign born (%) - Asian
Place of birth - Foreign born (%) - Hispanic or Latino
Place of birth - Foreign born (%) - American Indian and Alaska Native
Place of birth - Foreign born (%) - Multirace
Place of birth - Foreign born (%) - Other Race
Residents speaking English at home (%)
Residents speaking English at home - Born in the United States (%)
Residents speaking English at home - Native, born elsewhere (%)
Residents speaking English at home - Foreign born (%)
Residents speaking Spanish at home (%)
Residents speaking Spanish at home - Born in the United States (%)
Residents speaking Spanish at home - Native, born elsewhere (%)
Residents speaking Spanish at home - Foreign born (%)
Residents speaking other language at home (%)
Residents speaking other language at home - Born in the United States (%)
Residents speaking other language at home - Native, born elsewhere (%)
Residents speaking other language at home - Foreign born (%)
Marital status - Never married (%)
Marital status - Now married (%)
Marital status - Separated (%)
Marital status - Widowed (%)
Marital status - Divorced (%)
Ancestries Reported - Arab (%)
Ancestries Reported - Czech (%)
Ancestries Reported - Danish (%)
Ancestries Reported - Dutch (%)
Ancestries Reported - English (%)
Ancestries Reported - French (%)
Ancestries Reported - French Canadian (%)
Ancestries Reported - German (%)
Ancestries Reported - Greek (%)
Ancestries Reported - Hungarian (%)
Ancestries Reported - Irish (%)
Ancestries Reported - Italian (%)
Ancestries Reported - Lithuanian (%)
Ancestries Reported - Norwegian (%)
Ancestries Reported - Polish (%)
Ancestries Reported - Portuguese (%)
Ancestries Reported - Russian (%)
Ancestries Reported - Scotch-Irish (%)
Ancestries Reported - Scottish (%)
Ancestries Reported - Slovak (%)
Ancestries Reported - Subsaharan African (%)
Ancestries Reported - Swedish (%)
Ancestries Reported - Swiss (%)
Ancestries Reported - Ukrainian (%)
Ancestries Reported - United States (%)
Ancestries Reported - Welsh (%)
Ancestries Reported - West Indian (%)
Ancestries Reported - Other (%)
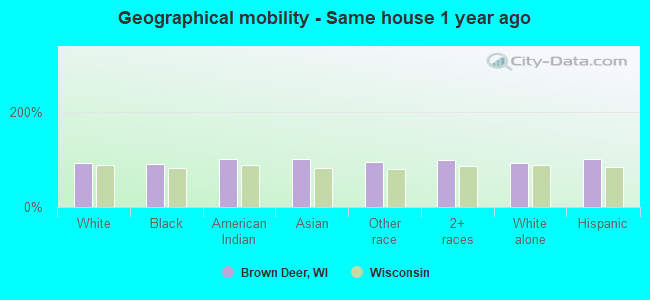
Geographical mobility - Same house 1 year ago (%)
Geographical mobility - Same house 1 year ago (%) - White
Geographical mobility - Same house 1 year ago (%) - Black or African American
Geographical mobility - Same house 1 year ago (%) - Asian
Geographical mobility - Same house 1 year ago (%) - Hispanic or Latino
Geographical mobility - Same house 1 year ago (%) - American Indian and Alaska Native
Geographical mobility - Same house 1 year ago (%) - Multirace
Geographical mobility - Same house 1 year ago (%) - Other Race
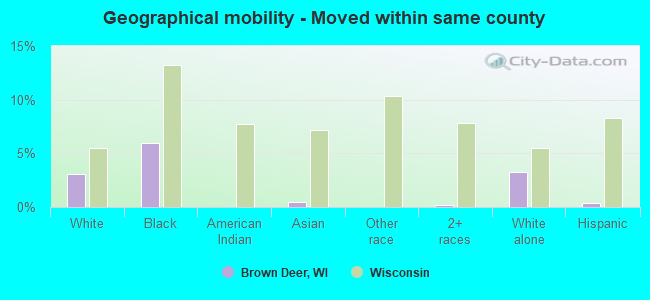
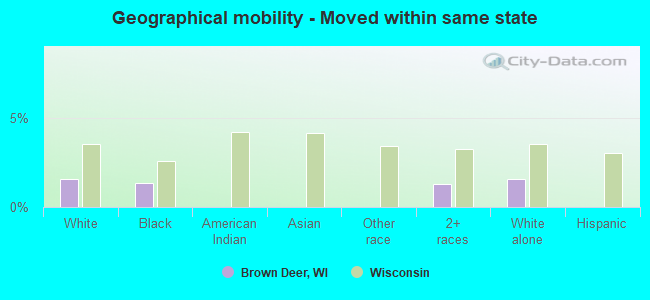
Geographical mobility - Moved within same county (%)
Geographical mobility - Moved within same county (%) - White
Geographical mobility - Moved within same county (%) - Black or African American
Geographical mobility - Moved within same county (%) - Asian
Geographical mobility - Moved within same county (%) - Hispanic or Latino
Geographical mobility - Moved within same county (%) - American Indian and Alaska Native
Geographical mobility - Moved within same county (%) - Multirace
Geographical mobility - Moved within same county (%) - Other Race
Geographical mobility - Moved from different county within same state (%)
Geographical mobility - Moved from different county within same state (%) - White
Geographical mobility - Moved from different county within same state (%) - Black or African American
Geographical mobility - Moved from different county within same state (%) - Asian
Geographical mobility - Moved from different county within same state (%) - Hispanic or Latino
Geographical mobility - Moved from different county within same state (%) - American Indian and Alaska Native
Geographical mobility - Moved from different county within same state (%) - Multirace
Geographical mobility - Moved from different county within same state (%) - Other Race
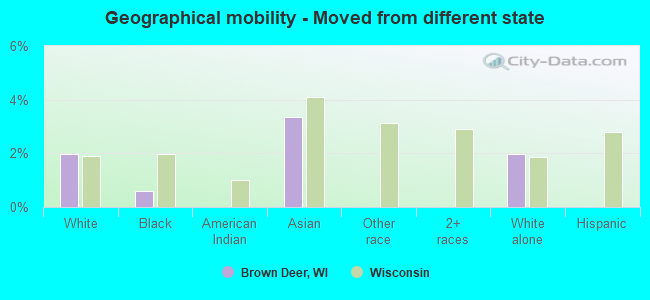
Geographical mobility - Moved from different state (%)
Geographical mobility - Moved from different state (%) - White
Geographical mobility - Moved from different state (%) - Black or African American
Geographical mobility - Moved from different state (%) - Asian
Geographical mobility - Moved from different state (%) - Hispanic or Latino
Geographical mobility - Moved from different state (%) - American Indian and Alaska Native
Geographical mobility - Moved from different state (%) - Multirace
Geographical mobility - Moved from different state (%) - Other Race
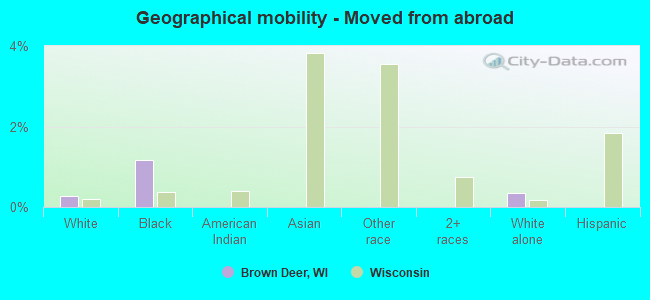
Geographical mobility - Moved from abroad (%)
Geographical mobility - Moved from abroad (%) - White
Geographical mobility - Moved from abroad (%) - Black or African American
Geographical mobility - Moved from abroad (%) - Asian
Geographical mobility - Moved from abroad (%) - Hispanic or Latino
Geographical mobility - Moved from abroad (%) - American Indian and Alaska Native
Geographical mobility - Moved from abroad (%) - Multirace
Geographical mobility - Moved from abroad (%) - Other Race
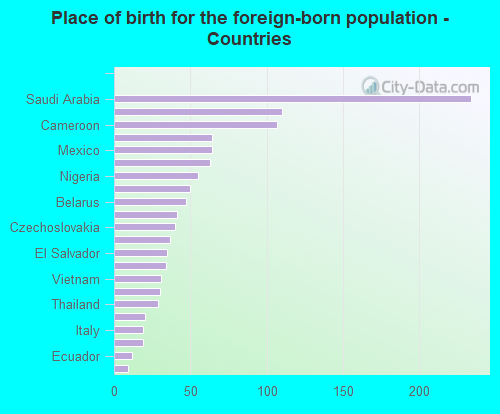
Place of birth for the foreign-born population - Ireland (%)
Place of birth for the foreign-born population - Denmark (%)
Place of birth for the foreign-born population - Norway (%)
Place of birth for the foreign-born population - Sweden (%)
Place of birth for the foreign-born population - United Kingdom (%)
Place of birth for the foreign-born population - England (%)
Place of birth for the foreign-born population - Scotland (%)
Place of birth for the foreign-born population - Other Northern Europe (%)
Place of birth for the foreign-born population - Austria (%)
Place of birth for the foreign-born population - Belgium (%)
Place of birth for the foreign-born population - France (%)
Place of birth for the foreign-born population - Germany (%)
Place of birth for the foreign-born population - Netherlands (%)
Place of birth for the foreign-born population - Switzerland (%)
Place of birth for the foreign-born population - Other Western Europe (%)
Place of birth for the foreign-born population - Greece (%)
Place of birth for the foreign-born population - Italy (%)
Place of birth for the foreign-born population - Portugal (%)
Place of birth for the foreign-born population - Spain (%)
Place of birth for the foreign-born population - Other Southern Europe (%)
Place of birth for the foreign-born population - Albania (%)
Place of birth for the foreign-born population - Belarus (%)
Place of birth for the foreign-born population - Bosnia and Herzegovina (%)
Place of birth for the foreign-born population - Bulgaria (%)
Place of birth for the foreign-born population - Croatia (%)
Place of birth for the foreign-born population - Czechoslovakia (%)
Place of birth for the foreign-born population - Hungary (%)
Place of birth for the foreign-born population - Latvia (%)
Place of birth for the foreign-born population - Lithuania (%)
Place of birth for the foreign-born population - North Macedonia (Macedonia) (%)
Place of birth for the foreign-born population - Moldova (%)
Place of birth for the foreign-born population - Poland (%)
Place of birth for the foreign-born population - Romania (%)
Place of birth for the foreign-born population - Russia (%)
Place of birth for the foreign-born population - Serbia (%)
Place of birth for the foreign-born population - Ukraine (%)
Place of birth for the foreign-born population - Other Eastern Europe (%)
Place of birth for the foreign-born population - China (%)
Place of birth for the foreign-born population - Hong Kong (%)
Place of birth for the foreign-born population - Taiwan (%)
Place of birth for the foreign-born population - Japan (%)
Place of birth for the foreign-born population - Korea (%)
Place of birth for the foreign-born population - Other Eastern Asia (%)
Place of birth for the foreign-born population - Afghanistan (%)
Place of birth for the foreign-born population - Bangladesh (%)
Place of birth for the foreign-born population - India (%)
Place of birth for the foreign-born population - Iran (%)
Place of birth for the foreign-born population - Kazakhstan (%)
Place of birth for the foreign-born population - Nepal (%)
Place of birth for the foreign-born population - Pakistan (%)
Place of birth for the foreign-born population - Sri Lanka (%)
Place of birth for the foreign-born population - Uzbekistan (%)
Place of birth for the foreign-born population - Other South Central Asia (%)
Place of birth for the foreign-born population - Burma (%)
Place of birth for the foreign-born population - Cambodia (%)
Place of birth for the foreign-born population - Indonesia (%)
Place of birth for the foreign-born population - Laos (%)
Place of birth for the foreign-born population - Malaysia (%)
Place of birth for the foreign-born population - Philippines (%)
Place of birth for the foreign-born population - Singapore (%)
Place of birth for the foreign-born population - Thailand (%)
Place of birth for the foreign-born population - Vietnam (%)
Place of birth for the foreign-born population - Other South Eastern Asia (%)
Place of birth for the foreign-born population - Armenia (%)
Place of birth for the foreign-born population - Iraq (%)
Place of birth for the foreign-born population - Israel (%)
Place of birth for the foreign-born population - Jordan (%)
Place of birth for the foreign-born population - Kuwait (%)
Place of birth for the foreign-born population - Lebanon (%)
Place of birth for the foreign-born population - Saudi Arabia (%)
Place of birth for the foreign-born population - Syria (%)
Place of birth for the foreign-born population - Turkey (%)
Place of birth for the foreign-born population - Yemen (%)
Place of birth for the foreign-born population - Other Western Asia (%)
Place of birth for the foreign-born population - Eritrea (%)
Place of birth for the foreign-born population - Ethiopia (%)
Place of birth for the foreign-born population - Kenya (%)
Place of birth for the foreign-born population - Somalia (%)
Place of birth for the foreign-born population - Uganda (%)
Place of birth for the foreign-born population - Zimbabwe (%)
Place of birth for the foreign-born population - Other Eastern Africa (%)
Place of birth for the foreign-born population - Cameroon (%)
Place of birth for the foreign-born population - Congo (%)
Place of birth for the foreign-born population - Democratic Republic of Congo (Zaire) (%)
Place of birth for the foreign-born population - Other Middle Africa (%)
Place of birth for the foreign-born population - Egypt (%)
Place of birth for the foreign-born population - Morocco (%)
Place of birth for the foreign-born population - Sudan (%)
Place of birth for the foreign-born population - Other Northern Africa (%)
Place of birth for the foreign-born population - South Africa (%)
Place of birth for the foreign-born population - Other Southern Africa (%)
Place of birth for the foreign-born population - Cabo Verde (%)
Place of birth for the foreign-born population - Ghana (%)
Place of birth for the foreign-born population - Liberia (%)
Place of birth for the foreign-born population - Nigeria (%)
Place of birth for the foreign-born population - Senegal (%)
Place of birth for the foreign-born population - Sierra Leone (%)
Place of birth for the foreign-born population - Other Western Africa (%)
Place of birth for the foreign-born population - Australia (%)
Place of birth for the foreign-born population - New Zealand (%)
Place of birth for the foreign-born population - Fiji (%)
Place of birth for the foreign-born population - Micronesia (%)
Place of birth for the foreign-born population - Bahamas (%)
Place of birth for the foreign-born population - Barbados (%)
Place of birth for the foreign-born population - Cuba (%)
Place of birth for the foreign-born population - Dominica (%)
Place of birth for the foreign-born population - Dominican Republic (%)
Place of birth for the foreign-born population - Grenada (%)
Place of birth for the foreign-born population - Haiti (%)
Place of birth for the foreign-born population - Jamaica (%)
Place of birth for the foreign-born population - St. Vincent and the Grenadines (%)
Place of birth for the foreign-born population - Trinidad and Tobago (%)
Place of birth for the foreign-born population - West Indies (%)
Place of birth for the foreign-born population - Other Caribbean (%)
Place of birth for the foreign-born population - Belize (%)
Place of birth for the foreign-born population - Costa Rica (%)
Place of birth for the foreign-born population - El Salvador (%)
Place of birth for the foreign-born population - Guatemala (%)
Place of birth for the foreign-born population - Honduras (%)
Place of birth for the foreign-born population - Mexico (%)
Place of birth for the foreign-born population - Nicaragua (%)
Place of birth for the foreign-born population - Panama (%)
Place of birth for the foreign-born population - Other Central America (%)
Place of birth for the foreign-born population - Argentina (%)
Place of birth for the foreign-born population - Bolivia (%)
Place of birth for the foreign-born population - Brazil (%)
Place of birth for the foreign-born population - Chile (%)
Place of birth for the foreign-born population - Colombia (%)
Place of birth for the foreign-born population - Ecuador (%)
Place of birth for the foreign-born population - Guyana (%)
Place of birth for the foreign-born population - Peru (%)
Place of birth for the foreign-born population - Uruguay (%)
Place of birth for the foreign-born population - Venezuela (%)
Place of birth for the foreign-born population - Other South America (%)
Place of birth for the foreign-born population - Canada (%)
Place of birth for the foreign-born population - Other Northern America (%)
Place of birth for the foreign-born population - Other (%)
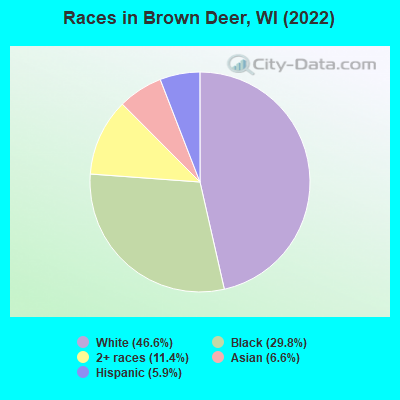
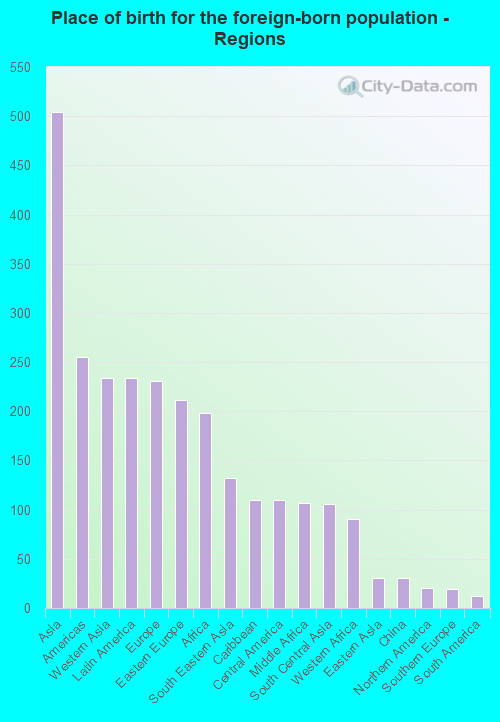
According to 2022 data, the most numerous races in Brown Deer, WI are White alone (5,774 residents), Hispanic (734 residents), and Black alone (3,698 residents). 88.5% of Brown Deer residents speak English at home. 9.6% of Brown Deer, WI residents are foreign-born (4.0% born in Asia, 1.9% born in Latin America, 1.8% born in Europe, 1.6% born in Africa), which is 47.9% greater than the foreign-born rate of 5.0% across the entire state of Wisconsin.
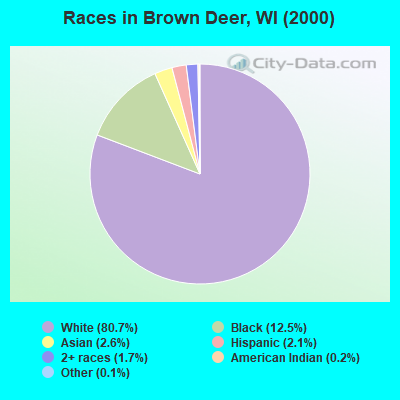
Race distribution in Brown Deer
2000 2022
4,681,630 87.3% White alone 300,245 5.6% Black alone 192,921 3.6% Hispanic 87,995 1.6% Asian alone 51,921 1.0% Two or more races 43,980 0.8% American Indian alone 3,637 0.07% Other race alone 1,346 0.03% Native Hawaiian and Other
4,654,031 79.0% White alone 447,022 7.6% Hispanic 345,678 5.9% Black alone 217,532 3.7% Two or more races 172,242 2.9% Asian alone 33,762 0.6% American Indian alone 19,680 0.3% Other race alone 2,592 0.04% Native Hawaiian and Other
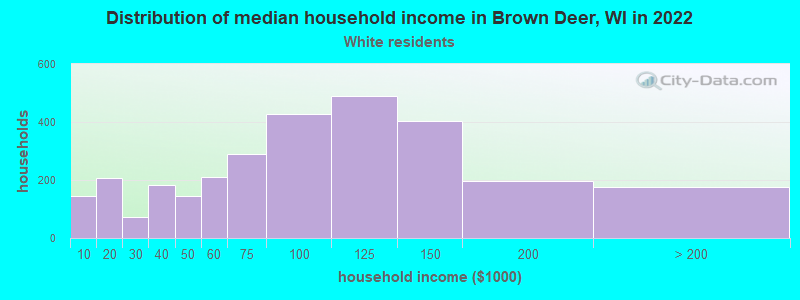
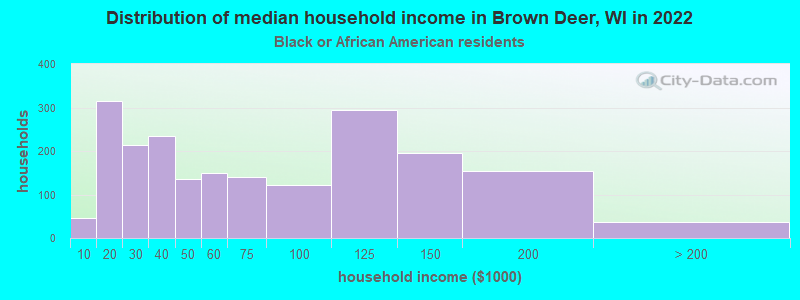
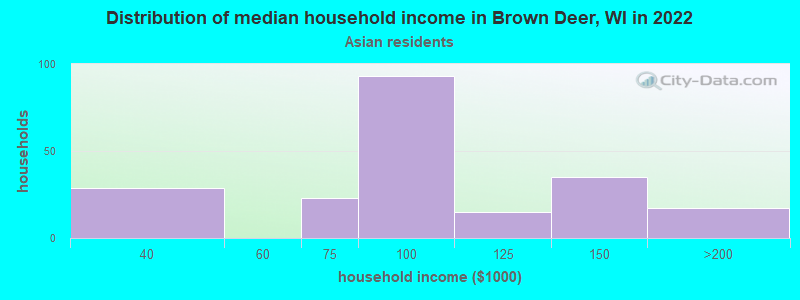
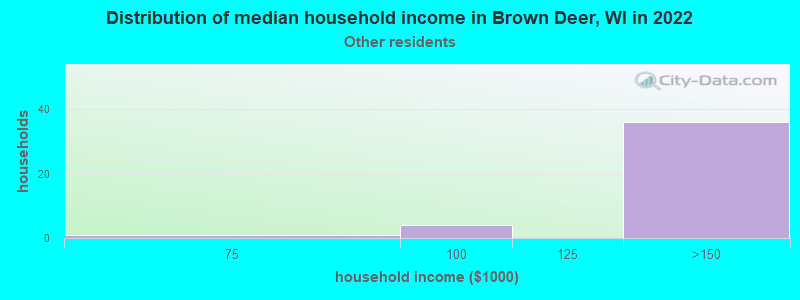
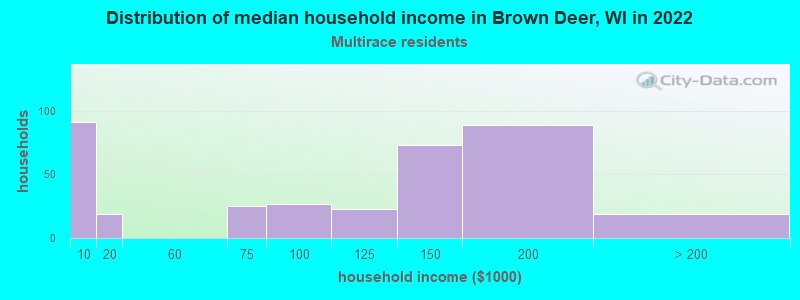
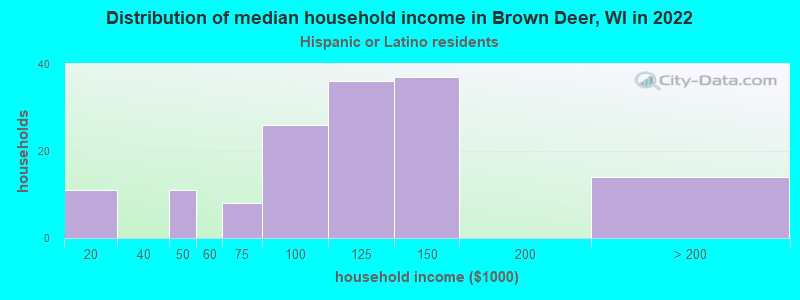
Income and house value in Brown Deer Median household income in 2022 $90,509 White non-Hispanic householders$57,421 Black householders$95,589 Asian householders$124,000 Some other race householders$143,484 Two or more races householders$106,343 Hispanic or Latino race householdersMedian 2022 house value $228,081 White Non-Hispanic householders$282,162 Black or African American householders $240,426 Asian householders$220,439 Some other race householders$210,250 Two or more races householders$246,304 Hispanic or Latino householders
Median age by race in Brown Deer
48.8 Median age for White residents48.7 50.6 49.0 Median age for Black or African American residents41.9 59.1 -699,907,663.2 Median age for American Indian / Alaska Native residents-833,824,974.6 -627,763,040.9 26.8 Median age for Asian residents27.2 23.4 -825,688,072.6 Median age for Native Hawaiian / Pacific Islander residents-862,745,097.2 -732,444,443.7 36.9 Median age for Other race residents41.4 2.1 17.7 Median age for Two or more races residents21.1 16.6 49.7 Median age for White alone residents49.8 50.0 40.6 Median age for Hispanic or Latino residents40.6 11.0
Owner/renter occupied households by race in Brown Deer
House owners and renters - White residents 2,309 77.4% Owner occupied675 22.6% Renter occupiedHouse owners and renters - Black or African American residents 1,012 48.3% Owner occupied1,082 51.7% Renter occupiedHouse owners and renters - American Indian / Alaska Native residents 11 100.0% Renter occupiedHouse owners and renters - Asian residents 139 66.8% Owner occupied69 33.2% Renter occupiedHouse owners and renters - Other race residents 33 100.0% Owner occupiedHouse owners and renters - Two or more races residents 197 56.3% Owner occupied153 43.7% Renter occupiedHouse owners and renters - White alone residents 2,310 76.7% Owner occupied701 23.3% Renter occupiedHouse owners and renters - Hispanic or Latino residents 125 84.7% Owner occupied23 15.3% Renter occupied
Language usage in Brown Deer
English speakers - Total 88.5% of residents of Brown Deer speak English at home.
1.9% of residents speak Spanish at home 85 37.8% Speak English very well140 62.2% Speak English less than very well9.8% of residents speak other language at home 720 62.6% Speak English very well430 37.4% Speak English less than very well
English speakers - Born in the United States 93.7% of residents of Brown Deer speak English at home.
9.2% of residents speak other language at home 60 24.3% Speak English very well187 75.7% Speak English less than very well
All residents speak only English at home
English speakers - Foreign-born 31.6% of residents of Brown Deer speak English at home.
5.2% of residents speak Spanish at home 9 14.3% Speak English very well54 85.7% Speak English less than very well62.6% of residents speak other language at home 512 66.8% Speak English very well254 33.2% Speak English less than very well
White (Caucasian) - Speak only English Native:
100.0% (5,376)Foreign-born:
63.7% (134)
White (Caucasian) - Speak another language Native:
1.1% (58)Foreign-born:
46.9% (99)
Black or African American - Speak only English Native:
98.8% (3,276)Foreign-born:
49.3% (221)
Black or African American - Speak another language Native:
1.2% (40)Foreign-born:
48.4% (217)
Asian - Speak another language Native:
65.8% (298)Foreign-born:
100.0% (280)
Other race - Speak only English Native:
100.0% (82)Foreign-born:
100.0% (28)
Two or more races - Speak another language Native:
13.9% (228)Foreign-born:
100.0% (347)
White alone - Speak only English Native:
99.3% (5,243)Foreign-born:
41.8% (119)
White alone - Speak another language Native:
0.9% (48)Foreign-born:
57.3% (163)
Hispanic or Latino - Speak only English Native:
88.9% (502)Foreign-born:
60.4% (78)
Hispanic or Latino - Speak another language Native:
12.6% (71)Foreign-born:
46.4% (60)
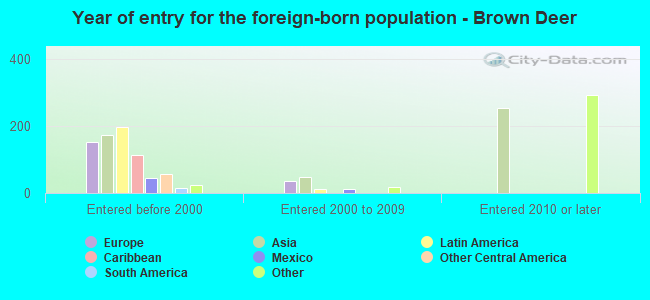
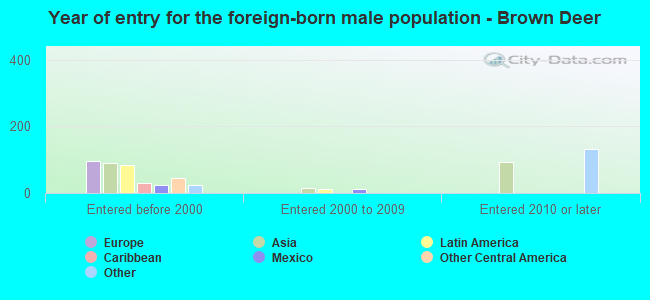
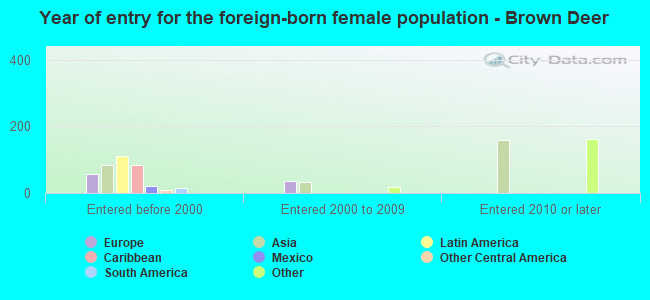
Foreign-born residents in Brown Deer 1,190 residents are foreign born (4.0% Asia , 1.9% Latin America , 1.8% Europe , 1.6% Africa ).
This city:
9.6%Wisconsin:
5.0%
Marital status for residents in Brown Deer Marital status - White (Caucasian) population 15 years and over
Males 23.5% Never married63.6% Now married0.0% Separated2.1% Widowed10.7% DivorcedFemales 19.8% Never married61.4% Now married1.2% Separated5.1% Widowed12.5% DivorcedWomen who gave birth in the past 12 months Now married:
100.0% (78)Unmarried:
0.0% (0)
Women who did not give birth in the past 12 months Now married:
60.9% (635)Unmarried:
39.1% (408)
Marital status - Black or African American population 15 years and over
Males 30.3% Never married51.7% Now married2.6% Separated6.2% Widowed9.2% DivorcedFemales 36.3% Never married44.8% Now married0.0% Separated10.8% Widowed8.2% DivorcedWomen who did not give birth in the past 12 months Now married:
25.6% (173)Unmarried:
74.4% (502)
Marital status - American Indian / Alaska Native population 15 years and over
Males 0.0% Never married100.0% Now married0.0% Separated0.0% Widowed0.0% DivorcedFemales 0.0% Never married100.0% Now married0.0% Separated0.0% Widowed0.0% DivorcedWomen who did not give birth in the past 12 months Now married:
100.0% (14)Unmarried:
0.0% (0)
Marital status - Asian population 15 years and over
Males 37.6% Never married57.0% Now married0.0% Separated0.0% Widowed5.4% DivorcedFemales 57.4% Never married42.6% Now married0.0% Separated0.0% Widowed0.0% DivorcedWomen who did not give birth in the past 12 months Now married:
38.2% (114)Unmarried:
61.8% (183)
Marital status - Other race population 15 years and over
Males 0.0% Never married100.0% Now married0.0% Separated0.0% Widowed0.0% DivorcedFemales 0.0% Never married100.0% Now married0.0% Separated0.0% Widowed0.0% DivorcedWomen who did not give birth in the past 12 months Now married:
100.0% (17)Unmarried:
0.0% (0)
Marital status - Two or more races population 15 years and over
Males 63.7% Never married35.1% Now married1.2% Separated0.0% Widowed0.0% DivorcedFemales 49.5% Never married35.7% Now married0.0% Separated0.0% Widowed14.8% DivorcedWomen who did not give birth in the past 12 months Now married:
20.4% (101)Unmarried:
79.6% (393)
Marital status - White alone, not Hispanic / Latino population 15 years and over
Males 23.7% Never married62.8% Now married0.0% Separated2.3% Widowed11.3% DivorcedFemales 19.8% Never married61.4% Now married1.2% Separated5.1% Widowed12.5% DivorcedWomen who gave birth in the past 12 months Now married:
100.0% (83)Unmarried:
0.0% (0)
Women who did not give birth in the past 12 months Now married:
60.9% (669)Unmarried:
39.1% (430)
Marital status - Hispanic or Latino population 15 years and over
Males 23.4% Never married76.6% Now married0.0% Separated0.0% Widowed0.0% DivorcedFemales 0.0% Never married88.0% Now married0.0% Separated0.0% Widowed12.0% DivorcedWomen who did not give birth in the past 12 months Now married:
100.0% (46)Unmarried:
0.0% (0)
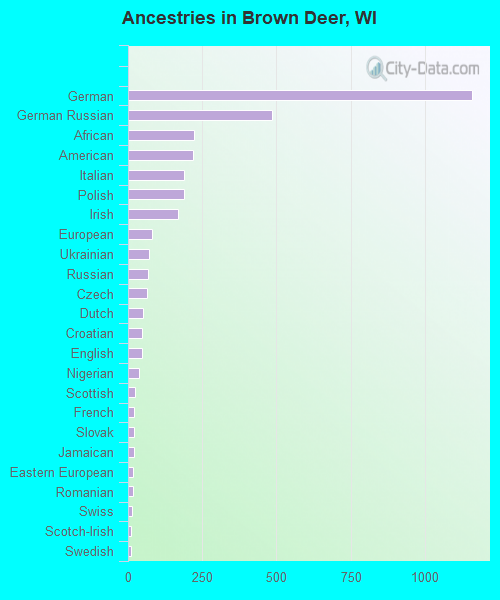
Ancestries in Brown Deer
1,158 15.6% German484 6.5% German Russian222 3.0% African220 3.0% American190 2.6% Italian188 2.5% Polish168 2.3% Irish81 1.1% European72 1.0% Ukrainian69 0.9% Russian64 0.9% Czech50 0.7% Dutch47 0.6% Croatian46 0.6% English38 0.5% Nigerian22 0.3% Scottish19 0.3% French19 0.3% Slovak19 0.3% Jamaican16 0.2% Eastern European16 0.2% Romanian12 0.2% Swiss11 0.1% Scotch-Irish11 0.1% Swedish10 0.1% Norwegian8 0.1% Canadian8 0.1% Czechoslovakian
Children Nativity (place of birth) in Brown Deer
Children under 6 years - Living with two parents Both parents native 450 100.0% NativeBoth parents foreign-born 196 100.0% NativeOne native, one foreign-born parent 16 100.0% NativeChildren under 6 years - Living with one parent Native parent 95 100.0% NativeChildren 6 to 17 years - Living with two parents Both parents native 764 99.4% Native5 0.6% Foreign-bornBoth parents foreign-born 145 59.9% Native97 40.1% Foreign-bornOne native, one foreign-born parent 188 93.0% Native14 7.0% Foreign-bornChildren 6 to 17 years - Living with one parent Native parent 468 100.0% NativeForeign-born parent 85 48.9% Native89 51.1% Foreign-born
Grandparents responsible for own grandchildren in Brown Deer
Grandparents (30 to 59 years) Black or African American 18 100.0% Responsible for grandchildren
Grandparents (60 years and over) Black or African American 35 100.0% Not responsible for grandchildren