Races in Brookfield, Wisconsin (WI) Detailed Stats
Data:
Races - White alone (%)
Races - White alone (% change since 2000)
Races - Black alone (%)
Races - Black alone (% change since 2000)
Races - American Indian alone (%)
Races - American Indian alone (% change since 2000)
Races - Asian alone (%)
Races - Asian alone (% change since 2000)
Races - Hispanic (%)
Races - Hispanic (% change since 2000)
Races - Native Hawaiian and Other Pacific Islander alone (%)
Races - Native Hawaiian and Other Pacific Islander alone (% change since 2000)
Races - Two or more races(%)
Races - Two or more races(% change since 2000)
Races - Other race alone (%)
Races - Other race alone (% change since 2000)
Racial diversity
Place of birth - Born in state of residence (%)
Place of birth - Born in state of residence (%) - White
Place of birth - Born in state of residence (%) - Black or African American
Place of birth - Born in state of residence (%) - Asian
Place of birth - Born in state of residence (%) - Hispanic or Latino
Place of birth - Born in state of residence (%) - American Indian and Alaska Native
Place of birth - Born in state of residence (%) - Multirace
Place of birth - Born in state of residence (%) - Other Race
Place of birth - Born in other state (%)
Place of birth - Born in other state (%) - White
Place of birth - Born in other state (%) - Black or African American
Place of birth - Born in other state (%) - Asian
Place of birth - Born in other state (%) - Hispanic or Latino
Place of birth - Born in other state (%) - American Indian and Alaska Native
Place of birth - Born in other state (%) - Multirace
Place of birth - Born in other state (%) - Other Race
Place of birth - Native, outside of US (%)
Place of birth - Native, outside of US (%) - White
Place of birth - Native, outside of US (%) - Black or African American
Place of birth - Native, outside of US (%) - Asian
Place of birth - Native, outside of US (%) - Hispanic or Latino
Place of birth - Native, outside of US (%) - American Indian and Alaska Native
Place of birth - Native, outside of US (%) - Multirace
Place of birth - Native, outside of US (%) - Other Race
Place of birth - Foreign born (%)
Place of birth - Foreign born (%) - White
Place of birth - Foreign born (%) - Black or African American
Place of birth - Foreign born (%) - Asian
Place of birth - Foreign born (%) - Hispanic or Latino
Place of birth - Foreign born (%) - American Indian and Alaska Native
Place of birth - Foreign born (%) - Multirace
Place of birth - Foreign born (%) - Other Race
Residents speaking English at home (%)
Residents speaking English at home - Born in the United States (%)
Residents speaking English at home - Native, born elsewhere (%)
Residents speaking English at home - Foreign born (%)
Residents speaking Spanish at home (%)
Residents speaking Spanish at home - Born in the United States (%)
Residents speaking Spanish at home - Native, born elsewhere (%)
Residents speaking Spanish at home - Foreign born (%)
Residents speaking other language at home (%)
Residents speaking other language at home - Born in the United States (%)
Residents speaking other language at home - Native, born elsewhere (%)
Residents speaking other language at home - Foreign born (%)
Marital status - Never married (%)
Marital status - Now married (%)
Marital status - Separated (%)
Marital status - Widowed (%)
Marital status - Divorced (%)
Ancestries Reported - Arab (%)
Ancestries Reported - Czech (%)
Ancestries Reported - Danish (%)
Ancestries Reported - Dutch (%)
Ancestries Reported - English (%)
Ancestries Reported - French (%)
Ancestries Reported - French Canadian (%)
Ancestries Reported - German (%)
Ancestries Reported - Greek (%)
Ancestries Reported - Hungarian (%)
Ancestries Reported - Irish (%)
Ancestries Reported - Italian (%)
Ancestries Reported - Lithuanian (%)
Ancestries Reported - Norwegian (%)
Ancestries Reported - Polish (%)
Ancestries Reported - Portuguese (%)
Ancestries Reported - Russian (%)
Ancestries Reported - Scotch-Irish (%)
Ancestries Reported - Scottish (%)
Ancestries Reported - Slovak (%)
Ancestries Reported - Subsaharan African (%)
Ancestries Reported - Swedish (%)
Ancestries Reported - Swiss (%)
Ancestries Reported - Ukrainian (%)
Ancestries Reported - United States (%)
Ancestries Reported - Welsh (%)
Ancestries Reported - West Indian (%)
Ancestries Reported - Other (%)
Geographical mobility - Same house 1 year ago (%)
Geographical mobility - Same house 1 year ago (%) - White
Geographical mobility - Same house 1 year ago (%) - Black or African American
Geographical mobility - Same house 1 year ago (%) - Asian
Geographical mobility - Same house 1 year ago (%) - Hispanic or Latino
Geographical mobility - Same house 1 year ago (%) - American Indian and Alaska Native
Geographical mobility - Same house 1 year ago (%) - Multirace
Geographical mobility - Same house 1 year ago (%) - Other Race
Geographical mobility - Moved within same county (%)
Geographical mobility - Moved within same county (%) - White
Geographical mobility - Moved within same county (%) - Black or African American
Geographical mobility - Moved within same county (%) - Asian
Geographical mobility - Moved within same county (%) - Hispanic or Latino
Geographical mobility - Moved within same county (%) - American Indian and Alaska Native
Geographical mobility - Moved within same county (%) - Multirace
Geographical mobility - Moved within same county (%) - Other Race
Geographical mobility - Moved from different county within same state (%)
Geographical mobility - Moved from different county within same state (%) - White
Geographical mobility - Moved from different county within same state (%) - Black or African American
Geographical mobility - Moved from different county within same state (%) - Asian
Geographical mobility - Moved from different county within same state (%) - Hispanic or Latino
Geographical mobility - Moved from different county within same state (%) - American Indian and Alaska Native
Geographical mobility - Moved from different county within same state (%) - Multirace
Geographical mobility - Moved from different county within same state (%) - Other Race
Geographical mobility - Moved from different state (%)
Geographical mobility - Moved from different state (%) - White
Geographical mobility - Moved from different state (%) - Black or African American
Geographical mobility - Moved from different state (%) - Asian
Geographical mobility - Moved from different state (%) - Hispanic or Latino
Geographical mobility - Moved from different state (%) - American Indian and Alaska Native
Geographical mobility - Moved from different state (%) - Multirace
Geographical mobility - Moved from different state (%) - Other Race
Geographical mobility - Moved from abroad (%)
Geographical mobility - Moved from abroad (%) - White
Geographical mobility - Moved from abroad (%) - Black or African American
Geographical mobility - Moved from abroad (%) - Asian
Geographical mobility - Moved from abroad (%) - Hispanic or Latino
Geographical mobility - Moved from abroad (%) - American Indian and Alaska Native
Geographical mobility - Moved from abroad (%) - Multirace
Geographical mobility - Moved from abroad (%) - Other Race
Place of birth for the foreign-born population - Ireland (%)
Place of birth for the foreign-born population - Denmark (%)
Place of birth for the foreign-born population - Norway (%)
Place of birth for the foreign-born population - Sweden (%)
Place of birth for the foreign-born population - United Kingdom (%)
Place of birth for the foreign-born population - England (%)
Place of birth for the foreign-born population - Scotland (%)
Place of birth for the foreign-born population - Other Northern Europe (%)
Place of birth for the foreign-born population - Austria (%)
Place of birth for the foreign-born population - Belgium (%)
Place of birth for the foreign-born population - France (%)
Place of birth for the foreign-born population - Germany (%)
Place of birth for the foreign-born population - Netherlands (%)
Place of birth for the foreign-born population - Switzerland (%)
Place of birth for the foreign-born population - Other Western Europe (%)
Place of birth for the foreign-born population - Greece (%)
Place of birth for the foreign-born population - Italy (%)
Place of birth for the foreign-born population - Portugal (%)
Place of birth for the foreign-born population - Spain (%)
Place of birth for the foreign-born population - Other Southern Europe (%)
Place of birth for the foreign-born population - Albania (%)
Place of birth for the foreign-born population - Belarus (%)
Place of birth for the foreign-born population - Bosnia and Herzegovina (%)
Place of birth for the foreign-born population - Bulgaria (%)
Place of birth for the foreign-born population - Croatia (%)
Place of birth for the foreign-born population - Czechoslovakia (%)
Place of birth for the foreign-born population - Hungary (%)
Place of birth for the foreign-born population - Latvia (%)
Place of birth for the foreign-born population - Lithuania (%)
Place of birth for the foreign-born population - North Macedonia (Macedonia) (%)
Place of birth for the foreign-born population - Moldova (%)
Place of birth for the foreign-born population - Poland (%)
Place of birth for the foreign-born population - Romania (%)
Place of birth for the foreign-born population - Russia (%)
Place of birth for the foreign-born population - Serbia (%)
Place of birth for the foreign-born population - Ukraine (%)
Place of birth for the foreign-born population - Other Eastern Europe (%)
Place of birth for the foreign-born population - China (%)
Place of birth for the foreign-born population - Hong Kong (%)
Place of birth for the foreign-born population - Taiwan (%)
Place of birth for the foreign-born population - Japan (%)
Place of birth for the foreign-born population - Korea (%)
Place of birth for the foreign-born population - Other Eastern Asia (%)
Place of birth for the foreign-born population - Afghanistan (%)
Place of birth for the foreign-born population - Bangladesh (%)
Place of birth for the foreign-born population - India (%)
Place of birth for the foreign-born population - Iran (%)
Place of birth for the foreign-born population - Kazakhstan (%)
Place of birth for the foreign-born population - Nepal (%)
Place of birth for the foreign-born population - Pakistan (%)
Place of birth for the foreign-born population - Sri Lanka (%)
Place of birth for the foreign-born population - Uzbekistan (%)
Place of birth for the foreign-born population - Other South Central Asia (%)
Place of birth for the foreign-born population - Burma (%)
Place of birth for the foreign-born population - Cambodia (%)
Place of birth for the foreign-born population - Indonesia (%)
Place of birth for the foreign-born population - Laos (%)
Place of birth for the foreign-born population - Malaysia (%)
Place of birth for the foreign-born population - Philippines (%)
Place of birth for the foreign-born population - Singapore (%)
Place of birth for the foreign-born population - Thailand (%)
Place of birth for the foreign-born population - Vietnam (%)
Place of birth for the foreign-born population - Other South Eastern Asia (%)
Place of birth for the foreign-born population - Armenia (%)
Place of birth for the foreign-born population - Iraq (%)
Place of birth for the foreign-born population - Israel (%)
Place of birth for the foreign-born population - Jordan (%)
Place of birth for the foreign-born population - Kuwait (%)
Place of birth for the foreign-born population - Lebanon (%)
Place of birth for the foreign-born population - Saudi Arabia (%)
Place of birth for the foreign-born population - Syria (%)
Place of birth for the foreign-born population - Turkey (%)
Place of birth for the foreign-born population - Yemen (%)
Place of birth for the foreign-born population - Other Western Asia (%)
Place of birth for the foreign-born population - Eritrea (%)
Place of birth for the foreign-born population - Ethiopia (%)
Place of birth for the foreign-born population - Kenya (%)
Place of birth for the foreign-born population - Somalia (%)
Place of birth for the foreign-born population - Uganda (%)
Place of birth for the foreign-born population - Zimbabwe (%)
Place of birth for the foreign-born population - Other Eastern Africa (%)
Place of birth for the foreign-born population - Cameroon (%)
Place of birth for the foreign-born population - Congo (%)
Place of birth for the foreign-born population - Democratic Republic of Congo (Zaire) (%)
Place of birth for the foreign-born population - Other Middle Africa (%)
Place of birth for the foreign-born population - Egypt (%)
Place of birth for the foreign-born population - Morocco (%)
Place of birth for the foreign-born population - Sudan (%)
Place of birth for the foreign-born population - Other Northern Africa (%)
Place of birth for the foreign-born population - South Africa (%)
Place of birth for the foreign-born population - Other Southern Africa (%)
Place of birth for the foreign-born population - Cabo Verde (%)
Place of birth for the foreign-born population - Ghana (%)
Place of birth for the foreign-born population - Liberia (%)
Place of birth for the foreign-born population - Nigeria (%)
Place of birth for the foreign-born population - Senegal (%)
Place of birth for the foreign-born population - Sierra Leone (%)
Place of birth for the foreign-born population - Other Western Africa (%)
Place of birth for the foreign-born population - Australia (%)
Place of birth for the foreign-born population - New Zealand (%)
Place of birth for the foreign-born population - Fiji (%)
Place of birth for the foreign-born population - Micronesia (%)
Place of birth for the foreign-born population - Bahamas (%)
Place of birth for the foreign-born population - Barbados (%)
Place of birth for the foreign-born population - Cuba (%)
Place of birth for the foreign-born population - Dominica (%)
Place of birth for the foreign-born population - Dominican Republic (%)
Place of birth for the foreign-born population - Grenada (%)
Place of birth for the foreign-born population - Haiti (%)
Place of birth for the foreign-born population - Jamaica (%)
Place of birth for the foreign-born population - St. Vincent and the Grenadines (%)
Place of birth for the foreign-born population - Trinidad and Tobago (%)
Place of birth for the foreign-born population - West Indies (%)
Place of birth for the foreign-born population - Other Caribbean (%)
Place of birth for the foreign-born population - Belize (%)
Place of birth for the foreign-born population - Costa Rica (%)
Place of birth for the foreign-born population - El Salvador (%)
Place of birth for the foreign-born population - Guatemala (%)
Place of birth for the foreign-born population - Honduras (%)
Place of birth for the foreign-born population - Mexico (%)
Place of birth for the foreign-born population - Nicaragua (%)
Place of birth for the foreign-born population - Panama (%)
Place of birth for the foreign-born population - Other Central America (%)
Place of birth for the foreign-born population - Argentina (%)
Place of birth for the foreign-born population - Bolivia (%)
Place of birth for the foreign-born population - Brazil (%)
Place of birth for the foreign-born population - Chile (%)
Place of birth for the foreign-born population - Colombia (%)
Place of birth for the foreign-born population - Ecuador (%)
Place of birth for the foreign-born population - Guyana (%)
Place of birth for the foreign-born population - Peru (%)
Place of birth for the foreign-born population - Uruguay (%)
Place of birth for the foreign-born population - Venezuela (%)
Place of birth for the foreign-born population - Other South America (%)
Place of birth for the foreign-born population - Canada (%)
Place of birth for the foreign-born population - Other Northern America (%)
Place of birth for the foreign-born population - Other (%)
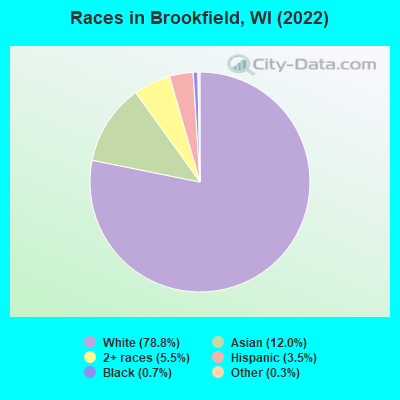
According to 2022 data, the most numerous races in Brookfield, WI are White alone (32,827 residents), Hispanic (1,455 residents), and Black alone (303 residents). 85.7% of Brookfield residents speak English at home. 11.3% of Brookfield, WI residents are foreign-born (8.6% born in Asia, 1.7% born in Europe), which is 55.7% greater than the foreign-born rate of 5.0% across the entire state of Wisconsin.
Race distribution in Brookfield
2000 2022
4,681,630 87.3% White alone 300,245 5.6% Black alone 192,921 3.6% Hispanic 87,995 1.6% Asian alone 51,921 1.0% Two or more races 43,980 0.8% American Indian alone 3,637 0.07% Other race alone 1,346 0.03% Native Hawaiian and Other
4,654,031 79.0% White alone 447,022 7.6% Hispanic 345,678 5.9% Black alone 217,532 3.7% Two or more races 172,242 2.9% Asian alone 33,762 0.6% American Indian alone 19,680 0.3% Other race alone 2,592 0.04% Native Hawaiian and Other
Income and house value in Brookfield Median household income in 2022 $117,687 White non-Hispanic householders$75,269 Black householdersover $200,000 Asian householders$185,682 Some other race householders$110,480 Two or more races householders$126,041 Hispanic or Latino race householdersMedian 2022 house value $418,466 White Non-Hispanic householders$400,060 Black or African American householders$287,626 American Indian or Alaska Native householders $510,720 Asian householders$452,840 Some other race householders$272,546 Two or more races householders$526,687 Hispanic or Latino householders
Median age by race in Brookfield
48.2 Median age for White residents48.0 48.6 34.6 Median age for Black or African American residents31.0 41.9 65.8 Median age for American Indian / Alaska Native residents18.5 48.9 43.2 Median age for Asian residents43.4 40.6 -825,688,072.6 Median age for Native Hawaiian / Pacific Islander residents-862,745,097.2 -666,666,666.0 30.6 Median age for Other race residents45.7 29.9 22.2 Median age for Two or more races residents21.1 22.2 48.6 Median age for White alone residents48.5 49.0 26.6 Median age for Hispanic or Latino residents16.8 33.3
Owner/renter occupied households by race in Brookfield
House owners and renters - White residents 11,903 86.7% Owner occupied1,832 13.3% Renter occupiedHouse owners and renters - Black or African American residents 55 28.2% Owner occupied140 71.8% Renter occupiedHouse owners and renters - American Indian / Alaska Native residents 1 29.8% Owner occupied3 70.2% Renter occupiedHouse owners and renters - Asian residents 1,321 80.2% Owner occupied327 19.8% Renter occupiedHouse owners and renters - Other race residents 175 100.0% Owner occupiedHouse owners and renters - Two or more races residents 531 72.8% Owner occupied198 27.2% Renter occupiedHouse owners and renters - White alone residents 11,838 86.5% Owner occupied1,850 13.5% Renter occupiedHouse owners and renters - Hispanic or Latino residents 226 79.5% Owner occupied58 20.5% Renter occupied
Language usage in Brookfield
English speakers - Total 85.7% of residents of Brookfield speak English at home.
1.1% of residents speak Spanish at home 367 82.5% Speak English very well78 17.5% Speak English less than very well14.4% of residents speak other language at home 4,537 79.3% Speak English very well1,183 20.7% Speak English less than very well
English speakers - Born in the United States 95.1% of residents of Brookfield speak English at home.
1.5% of residents speak Spanish at home 144 100.0% Speak English very well4.2% of residents speak other language at home 310 76.7% Speak English very well94 23.3% Speak English less than very well
English speakers - Native, born elsewhere 42.1% of residents of Brookfield speak English at home.
15.9% of residents speak Spanish at home 43 100.0% Speak English very well93.7% of residents speak other language at home 236 92.9% Speak English very well18 7.1% Speak English less than very well
English speakers - Foreign-born 13.3% of residents of Brookfield speak English at home.
3.2% of residents speak Spanish at home 96 63.6% Speak English very well55 36.4% Speak English less than very well89.4% of residents speak other language at home 3,236 77.6% Speak English very well932 22.4% Speak English less than very well
White (Caucasian) - Speak only English Native:
97.6% (29,824)Foreign-born:
18.2% (159)
White (Caucasian) - Speak another language Native:
2.4% (742)Foreign-born:
83.1% (725)
Black or African American - Speak only English Native:
100.0% (201)Foreign-born:
76.6% (38)
American Indian / Alaska Native - Speak only English Native:
94.8% (30)Foreign-born:
95.6% (1)
Asian - Speak only English Native:
60.1% (866)Foreign-born:
9.9% (348)
Asian - Speak another language Native:
40.2% (580)Foreign-born:
91.2% (3,211)
Other race - Speak only English Native:
80.1% (254)Foreign-born:
12.5% (11)
Other race - Speak another language Native:
21.2% (67)Foreign-born:
86.8% (73)
Two or more races - Speak only English Native:
92.3% (2,472)Foreign-born:
35.3% (59)
Two or more races - Speak another language Native:
7.8% (208)Foreign-born:
70.3% (118)
White alone - Speak only English Native:
97.5% (29,523)Foreign-born:
16.0% (149)
White alone - Speak another language Native:
2.6% (785)Foreign-born:
88.3% (826)
Hispanic or Latino - Speak only English Native:
83.9% (936)Foreign-born:
23.9% (48)
Hispanic or Latino - Speak another language Native:
18.1% (202)Foreign-born:
76.0% (153)
Foreign-born residents in Brookfield 4,705 residents are foreign born (8.6% Asia , 1.7% Europe ).
This city:
11.3%Wisconsin:
5.0%
Marital status for residents in Brookfield Marital status - White (Caucasian) population 15 years and over
Males 22.0% Never married67.1% Now married0.5% Separated2.7% Widowed7.8% DivorcedFemales 18.8% Never married61.1% Now married0.3% Separated11.5% Widowed8.4% DivorcedWomen who gave birth in the past 12 months Now married:
100.0% (306)Unmarried:
0.0% (0)
Women who did not give birth in the past 12 months Now married:
55.7% (3,082)Unmarried:
44.3% (2,449)
Marital status - Black or African American population 15 years and over
Males 46.7% Never married53.3% Now married0.0% Separated0.0% Widowed0.0% DivorcedFemales 27.9% Never married16.4% Now married38.5% Separated4.1% Widowed13.1% DivorcedWomen who did not give birth in the past 12 months Now married:
63.6% (61)Unmarried:
36.4% (35)
Marital status - American Indian / Alaska Native population 15 years and over
Males 100.0% Never married0.0% Now married0.0% Separated0.0% Widowed0.0% DivorcedFemales 7.7% Never married92.3% Now married0.0% Separated0.0% Widowed0.0% DivorcedWomen who did not give birth in the past 12 months Now married:
91.7% (10)Unmarried:
8.3% (1)
Marital status - Asian population 15 years and over
Males 27.3% Never married71.2% Now married0.0% Separated0.4% Widowed1.1% DivorcedFemales 16.4% Never married74.5% Now married0.0% Separated3.9% Widowed5.1% DivorcedWomen who gave birth in the past 12 months Now married:
100.0% (14)Unmarried:
0.0% (0)
Women who did not give birth in the past 12 months Now married:
73.0% (993)Unmarried:
27.0% (367)
Marital status - Other race population 15 years and over
Males 6.5% Never married84.3% Now married0.0% Separated0.0% Widowed9.3% DivorcedFemales 9.7% Never married84.3% Now married0.0% Separated6.0% Widowed0.0% DivorcedWomen who did not give birth in the past 12 months Now married:
87.6% (84)Unmarried:
12.4% (12)
Marital status - Two or more races population 15 years and over
Males 44.2% Never married47.5% Now married0.0% Separated6.3% Widowed2.0% DivorcedFemales 51.3% Never married42.9% Now married0.0% Separated3.0% Widowed2.8% DivorcedWomen who gave birth in the past 12 months Now married:
75.9% (28)Unmarried:
24.1% (9)
Women who did not give birth in the past 12 months Now married:
21.6% (155)Unmarried:
78.4% (564)
Marital status - White alone, not Hispanic / Latino population 15 years and over
Males 21.3% Never married67.5% Now married0.5% Separated2.8% Widowed7.9% DivorcedFemales 18.8% Never married61.0% Now married0.3% Separated11.6% Widowed8.3% DivorcedWomen who gave birth in the past 12 months Now married:
100.0% (312)Unmarried:
0.0% (0)
Women who did not give birth in the past 12 months Now married:
55.4% (3,066)Unmarried:
44.6% (2,464)
Marital status - Hispanic or Latino population 15 years and over
Males 36.2% Never married51.0% Now married0.0% Separated10.5% Widowed2.3% DivorcedFemales 31.5% Never married56.2% Now married0.0% Separated4.3% Widowed7.9% DivorcedWomen who gave birth in the past 12 months Now married:
65.0% (12)Unmarried:
35.0% (7)
Women who did not give birth in the past 12 months Now married:
50.9% (192)Unmarried:
49.1% (185)
Ancestries in Brookfield
5,183 28.8% German1,075 6.0% American908 5.0% Polish893 5.0% Irish831 4.6% European721 4.0% Italian477 2.6% English376 2.1% Norwegian313 1.7% Greek158 0.9% Swedish154 0.9% Dutch126 0.7% Swiss110 0.6% Ukrainian94 0.5% Syrian71 0.4% Hungarian71 0.4% Slovak70 0.4% Eastern European70 0.4% Scandinavian69 0.4% Iranian69 0.4% Scottish61 0.3% French Canadian56 0.3% Austrian52 0.3% Arab48 0.3% Czech46 0.3% Russian45 0.2% Welsh44 0.2% Latvian42 0.2% Finnish41 0.2% Luxembourger39 0.2% French37 0.2% Northern European37 0.2% Danish34 0.2% Macedonian32 0.2% Scotch-Irish31 0.2% Slavic30 0.2% Belgian30 0.2% Czechoslovakian29 0.2% Jamaican26 0.1% British25 0.1% Slovene23 0.1% Canadian22 0.1% Armenian17 0.09% Brazilian16 0.09% Croatian16 0.09% Portuguese15 0.08% Lebanese14 0.08% Turkish13 0.07% Israeli12 0.07% Palestinian12 0.07% Jordanian9 0.05% Romanian7 0.04% Serbian1 0.01% Lithuanian
Geographical mobility in Brookfield Same house 1 year ago 29,408 89.2% White (Caucasian)234 97.2% Black or African American26 77.3% American Indian / Alaska Native4,567 91.3% Asian218 80.5% Other race2,731 95.7% Two or more races29,155 89.3% White alone, not Hispanic / Latino1,234 88.1% Hispanic or LatinoMoved within same county 1,580 4.8% White / Caucasian38 0.8% Asian31 11.4% Other race1,571 4.8% White alone, not Hispanic / Latino71 5.1% Hispanic or LatinoMoved within same state 1,214 3.7% White / Caucasian5 2.1% Black or African American144 2.9% Asian14 5.3% Other race68 2.4% Two or more races1,218 3.7% White alone, not Hispanic / Latino24 1.7% Hispanic or LatinoMoved from different state 539 1.6% White / Caucasian5 14.8% American Indian / Alaska Native576 11.5% Asian30 1.0% Two or more races522 1.6% White alone, not Hispanic / Latino24 1.7% Hispanic or LatinoMoved from abroad 114 0.3% White21 0.1% White alone, not Hispanic / Latino35 2.5% Hispanic or Latino
Children Nativity (place of birth) in Brookfield
Children under 6 years - Living with two parents Both parents native 1,985 100.0% NativeBoth parents foreign-born 172 81.3% Native40 18.7% Foreign-bornOne native, one foreign-born parent 197 100.0% NativeChildren under 6 years - Living with one parent Native parent 99 100.0% NativeChildren 6 to 17 years - Living with two parents Both parents native 4,291 99.2% Native36 0.8% Foreign-bornBoth parents foreign-born 816 73.1% Native301 26.9% Foreign-bornOne native, one foreign-born parent 561 98.7% Native7 1.3% Foreign-bornChildren 6 to 17 years - Living with one parent Native parent 683 100.0% NativeForeign-born parent 84 56.8% Native64 43.2% Foreign-born
Grandparents responsible for own grandchildren in Brookfield
Grandparents (30 to 59 years) Asian 20 100.0% Responsible for grandchildren
Grandparents (60 years and over) Asian 83 100.0% Not responsible for grandchildren