Races in Bristol, Vermont (VT) Detailed Stats
Ancestries, Foreign-born residents, place of birth

Data:
Latest news about races in Bristol, VT collected exclusively by city-data.com from local newspapers, TV, and radio stations
1.2% of Bristol, VT residents are foreign-born , which is 222.4% less than the foreign-born rate of 4.0% across the entire state of Vermont.
Race distribution in Bristol

- 3,71298.0%White alone
- 260.7%Two or more races
- 190.5%Hispanic
- 150.4%Asian alone
- 90.2%Black alone
- 50.1%American Indian alone
- 20.05%Other race alone
2000
2022
-
- 585,43196.2%White alone
- 6,8091.1%Two or more races
- 5,5040.9%Hispanic
- 5,1600.8%Asian alone
- 2,9210.5%Black alone
- 2,3250.4%American Indian alone
- 5570.09%Other race alone
- 1200.02%Native Hawaiian and Other
Pacific Islander alone
-
- 583,54690.2%White alone
- 27,3404.2%Two or more races
- 14,7702.3%Hispanic
- 11,5121.8%Asian alone
- 6,2641.0%Black alone
- 2,5210.4%Other race alone
- 1,0520.2%American Indian alone
- 590.01%Native Hawaiian and Other
Pacific Islander alone
Income and house value in Bristol
- Median household income in 2022
- $77,922White non-Hispanic householders
- $46,666Black householders
- $79,184Some other race householders
- $98,612Two or more races householders
- $63,496Hispanic or Latino race householders
- Median 2022 house value
- $334,919White Non-Hispanic householders
- $411,909Some other race householders
- $322,038Hispanic or Latino householders
Foreign-born residents in Bristol
47 residents are foreign born
| This city: | 1.2% |
| Vermont: | 3.8% |
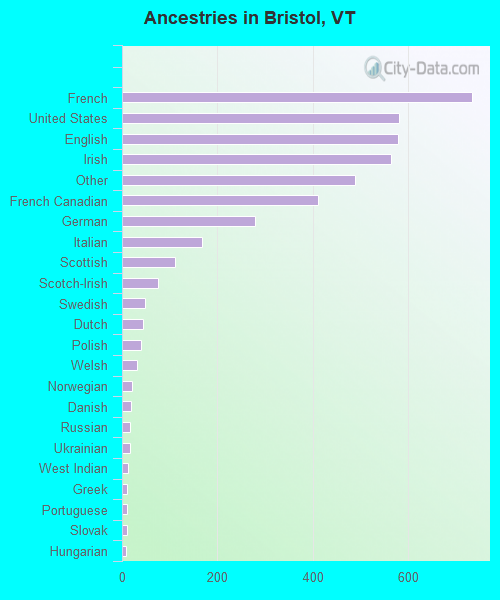
Ancestries in Bristol

- 73217.1%French
- 58113.5%United States
- 57913.5%English
- 56313.1%Irish
- 48911.4%Other
- 4119.6%French Canadian
- 2786.5%German
- 1673.9%Italian
- 1112.6%Scottish
- 761.8%Scotch-Irish
- 481.1%Swedish
- 441.0%Dutch
- 400.9%Polish
- 310.7%Welsh
- 200.5%Norwegian
- 190.4%Danish
- 170.4%Russian
- 160.4%Ukrainian
- 130.3%West Indian
- 110.3%Greek
- 110.3%Portuguese
- 110.3%Slovak
- 90.2%Hungarian
- 60.1%Czech
- 50.1%Arab
- 50.1%Lithuanian